React-apollo: Memory leak in renderToStringWithData
Intended outcome:
I have a service which uses the renderToStringWithData function from react-apollo. I expect the function to not have any memory leaks.
Actual outcome:
The service crashes every now and then, because it runs out of memory. I read a tutorial on how to diagnose memory leaks and I think I found one that is caused by the mentioned function. I have the same issue with another node app which uses renderToStringWithData.
This graph shows the growing memory consumption of my reproduction with GitHunt:
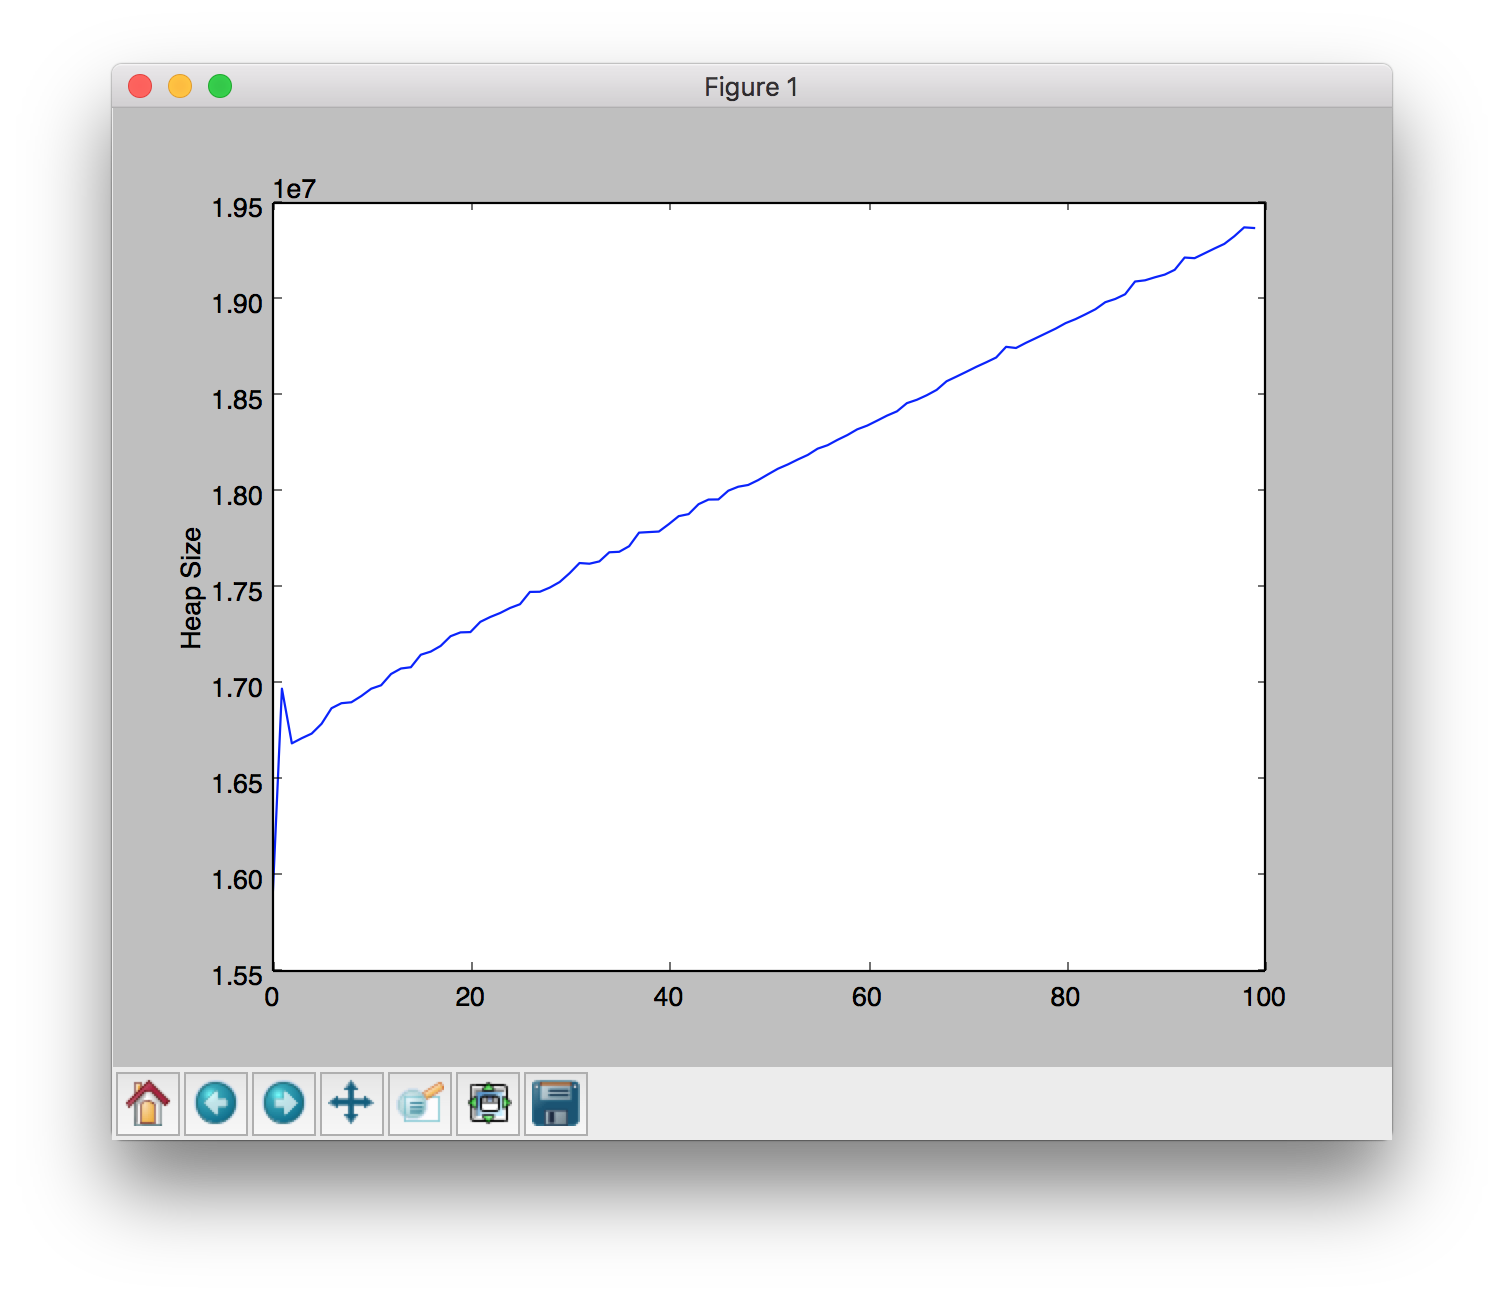
How to reproduce the issue:
- Clone https://github.com/amannn/GitHunt-React
- Make sure you're on the
memory-profilingbranch. - Do the regular GitHunt setup.
yarn buildyarn startab -n 100 http://127.0.0.1:3000/(sends a request to the server 100 times)- When the requests are through, stop the server. This will cause the profiling data to be written to
stats.json. - Run
python plot.pyto see the graph.
The mentioned tutorial also outlines a method for getting more information about which objects are allocated and never released by garbage collection.
Version
 amannn
All 25 comments
We are seeing the same thing, same versions, however we use renderToString manually, and getDataFromTree from react-apollo separately
 patroza
on 24 Jun 2018
patroza
on 24 Jun 2018
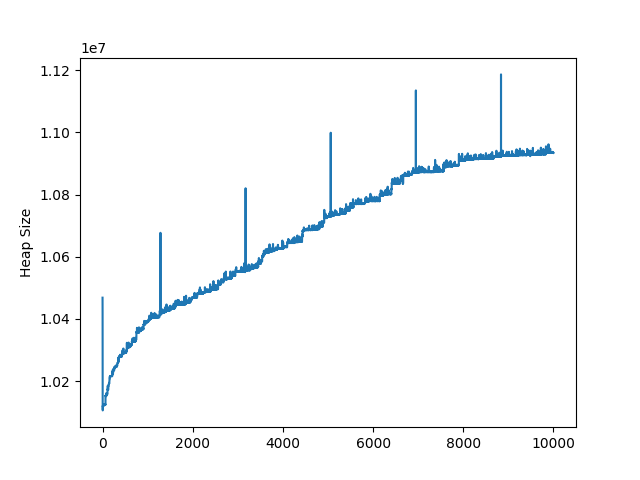
We are also trying to profile a memory leak in our app that appears to involve a branch of walkTree hanging. I had no luck tracking down why our app was leaking but decided to profile the GitHunt project under a couple other other scenarios (I ran with n=10000 for these tests):
Here it is with ssr={false} on the queries:

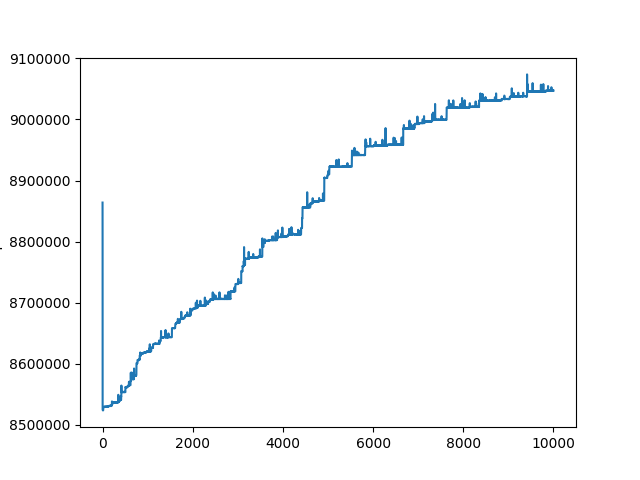
Here it is without even running getDataFromTree:

 ctbarna
on 23 Jul 2018
ctbarna
on 23 Jul 2018
We have been seeing this in production for a while. One other thing to note is that a corresponding CPU "leak" is accompanies the increased memory usage. Note the drop where a deploy restarted all nodes:

I suppose this should be a suspect with any JS memory leak, but we might want to start by looking at anything explicitly passed to the next event frame (such as with setTimeout/setImmediate/setInterval/requestIdleCallback).
 mike-marcacci
on 25 Jul 2018
mike-marcacci
on 25 Jul 2018
I'm behind from chasing my tail on all sorts of upstream issues today, so I can't really dive into this anymore, but my current suspicion is this setInterval which is never cleared internally or by react-apollo.
Everything in its scope is going to stay in memory indefinitely, and we're going to add a new scheduler every time we create an apollo client instance.
If this is correct, this also effects browser environments, but isn't problematic since they're so much shorter lived.
mike-marcacci
on 25 Jul 2018
Thanks for the excellent reproduction @amannn!
When I zoom in on small slices of the tail of my allocation profile, the newly created objects are almost all copies of query documents, so I suspect there’s some accidental cloning of queries happening somewhere, possibly compounded by subscription-related closures hanging around too long, like the setInterval idea @mike-marcacci mentioned.
 benjamn
on 19 Oct 2018
benjamn
on 19 Oct 2018
In addition to trying to create fewer clones of query documents (see commits referenced above), I believe this issue may be contributing to the leak, since the reproduction repository uses apollo-link-persisted-queries here. I just put together a PR to fix that leak here.
benjamn
on 22 Oct 2018
I'm affected by this issue. In my case, I'm only relying on getDataFromTree and rendering the React tree to a string with renderToString from react-dom/server. I've tried updating to the newest versions of Apollo libraries, (because I have old versions of them running in production) and I got a similar memory leak on every request, growing at a different rate, but in both cases it seems to be a consistent bump in heap size on every rendered page.
This issue is quite significant as it will force me to set up my node servers to restart once in a while to avoid slow GC cycles, and to prevent them from running out of memory.
 UwUnyaa
on 13 Dec 2018
UwUnyaa
on 13 Dec 2018
I can confirm we see the memory leak too and our containers are killed and restarted once every ~24 hours. I am using await getDataFromTree and then ReactDOMServer.renderToNodeStream.
Simply not calling getDataFromTree and letting the app render with whatever data it already has in the cache, seems to avoid the memory leak
 RamIdeas
on 17 Jan 2019
RamIdeas
on 17 Jan 2019
Bump. Is anyone working on this or looking into it?
RamIdeas
on 7 Feb 2019
+1 on @RamIdeas .. We are really looking forward on an update on this issue at my office.
 simonbergstrom
on 7 Feb 2019
simonbergstrom
on 7 Feb 2019
We see the exact same problem. Would really like som feedback on this issue.
 Nahlen
on 11 Feb 2019
Nahlen
on 11 Feb 2019
Can any of you either put together a reproduction, or start Node with node --inspect ... and attach Chrome DevTools to the server process, so you can record a memory allocation timeline?
Some notes:
- Please be sure you're not hanging onto old
ApolloClientinstances. When you're doing SSR, you should be creating a fresh client for each request. - If you click-and-drag to select just a subsection of the allocation timeline, you can see the objects that were allocated during that period, which can help identify per-request allocations.
- Be sure to force garbage collection with the 🗑 button to expose real leaks, as opposed to memory that simply hasn't been reclaimed yet.
In order to make any progress on this issue, we need to have some idea where the persistent allocations are coming from. In other words, I take the most recent comments above as volunteering to help track down the problem. Reports of seeing the same problem (by what definition of sameness?) have limited value unless you stick around and participate in the debugging. I don't mean to single anyone out, but I hope I can encourage/empower you to dig a little deeper.
benjamn
on 11 Feb 2019
@benjamn Thanks for your help! My initial post includes a reproduction repository and instructions on how to surface the issue.
Does that help?
amannn
on 11 Feb 2019
I'm not sure whether my process manager solution that kills proceses caused my heap snapshots to be inconclusive, but it will take me more time to provide meaningful data.
UwUnyaa
on 12 Feb 2019
@amannn Yes that repository was very helpful, though I believe we've made significant progress on the issues it highlighted. Here's the latest plot (with updated dependencies):

Starts a little higher, but the slope of the line is much gentler, and as far as I can tell there's nothing Apollo-specific accumulating over time, like there was before.
I should also mention: you can now use new InMemoryCache({ resultCaching: false }) to disable the caching of cache results (since [email protected]), which results in a slightly flatter line:

I don't think that difference points to any long-term memory leaks, but merely reflects the absence of some object recycling techniques used by the result caching system.
My suspicion is that the more recent commenters are seeing something more problematic than what these plots reflect, so I'm still interested in new reproductions. 🙏
benjamn
on 13 Feb 2019
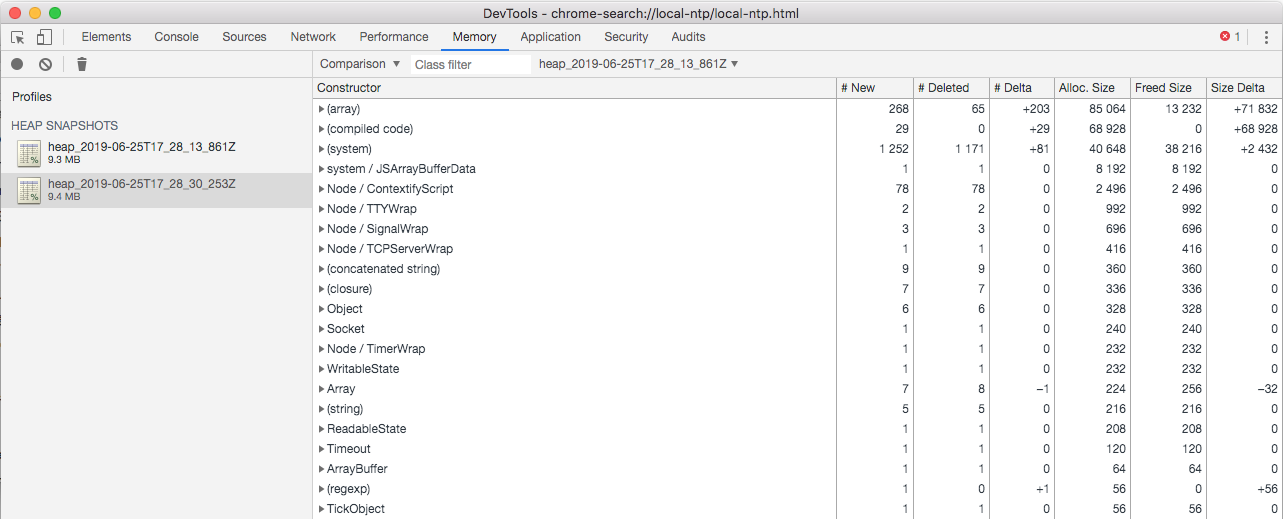
After checking out the development branch, compiling and configuring my server to make it possible to analyze how the memory leaks (disabled cluster mode, no full page cache to allow re-rendering the same page over and over) and testing it with queries sent from curl ran in a loop, I was able to see the RSS of the node.js process climb up at the rate of couple of mibibytes per minute. I wasn't able to record allocation stacks, as it would cause the server to segfault immediately. Here's a screenshot of a view at the heaviest objects in memory from the relevant part of the test (memory allocated during initialization and first renders before starting the loop is ignored, as it made internal structures with source code take up the majority of memory):

If a file with these statistics is needed, I might be able to provide it.
UwUnyaa
on 17 Feb 2019
Hi, guys! Is there any update on this?
 fozodavid
on 3 Apr 2019
fozodavid
on 3 Apr 2019
I created https://github.com/Quramy/reproduce-apollo-react-memleak to reproduce or investigate this issue.
I made 10,000 SSR requests using a simple GraphQL query and measured the size of the heap.
The heap grows by about 80 bytes / request, but on the other hands, I measured without <ApolloProvider> / apolloClient and the result indicated heap increasing.
It seems that react-apollo or apollo-client does not relate the leak. Or am I wrong with the use of react-dom-server. I'm not sure...
And I've attempted to detect objects which are remaining on the heap by comparison 2 heap snapshots but I couldn't ... :(
FYI:
I'm using:
- react-apollo: 2.5.8
- apollo-client: 2.6.3
- apollo-cache-inmemory: 1.6.2
 Quramy
on 25 Jun 2019
Quramy
on 25 Jun 2019
As it turns out, we may have run into the exact same problem. When can we expect a fix?
 MM3y3r
on 27 Jun 2019
MM3y3r
on 27 Jun 2019
Any updates? Thanks.
 Gdewilde
on 12 Jul 2019
Gdewilde
on 12 Jul 2019
Tried 3.0 pre release?
patroza
on 14 Jul 2019
Tried 3.0 pre release?
We've had issues every time we've tried updating apollo and its dependencies. It's so bad that we use react-apollo-hooks instead of the official solution.
UwUnyaa
on 14 Jul 2019
Hello! Sorry to bother, but, has there been any progress related to this issue?
 fermuch
on 20 Aug 2019
fermuch
on 20 Aug 2019
Hi, is there any update on this tread? I have a similar problem with getMarkupFromTree from @apollo/react-ssr.
 kirankalyan5
on 29 Jan 2020
kirankalyan5
on 29 Jan 2020
Hi, same problem here. Using getDataFromTree from @apollo/react-ssr. I think this issue is pretty serious. Thanks
 jatbone
on 5 Mar 2020
jatbone
on 5 Mar 2020
Related issues
 johhansantana
·
3Comments
johhansantana
·
3Comments
 ducarroz
·
3Comments
ducarroz
·
3Comments
 voodooattack
·
3Comments
voodooattack
·
3Comments
 thisbejim
·
3Comments
thisbejim
·
3Comments
 borisyordanov
·
3Comments
borisyordanov
·
3Comments
Most helpful comment
Hello! Sorry to bother, but, has there been any progress related to this issue?