Ray: High raylet memory usage during object broadcast
I am unable, on a manual local cluster, to sync a large shared memory numpy arrays after they gets to a certain size. I am unsure if this id due to my config, so I created the below script which recreates my issue.
In the code below, this can toggle between a non-issue and issue. Is that expected with the change in array size in this manner?
# THIS WORKS FINE, no problem, used very little memory on host
#feature_values = np.random.random((int(5e4),500)).astype(np.float32)
#feature_values = np.random.random((int(5e5),500)).astype(np.float32)
# This attempts to use well over 100gb in the RAYLET process
feature_values = np.random.random((int(5e6),500)).astype(np.float32)
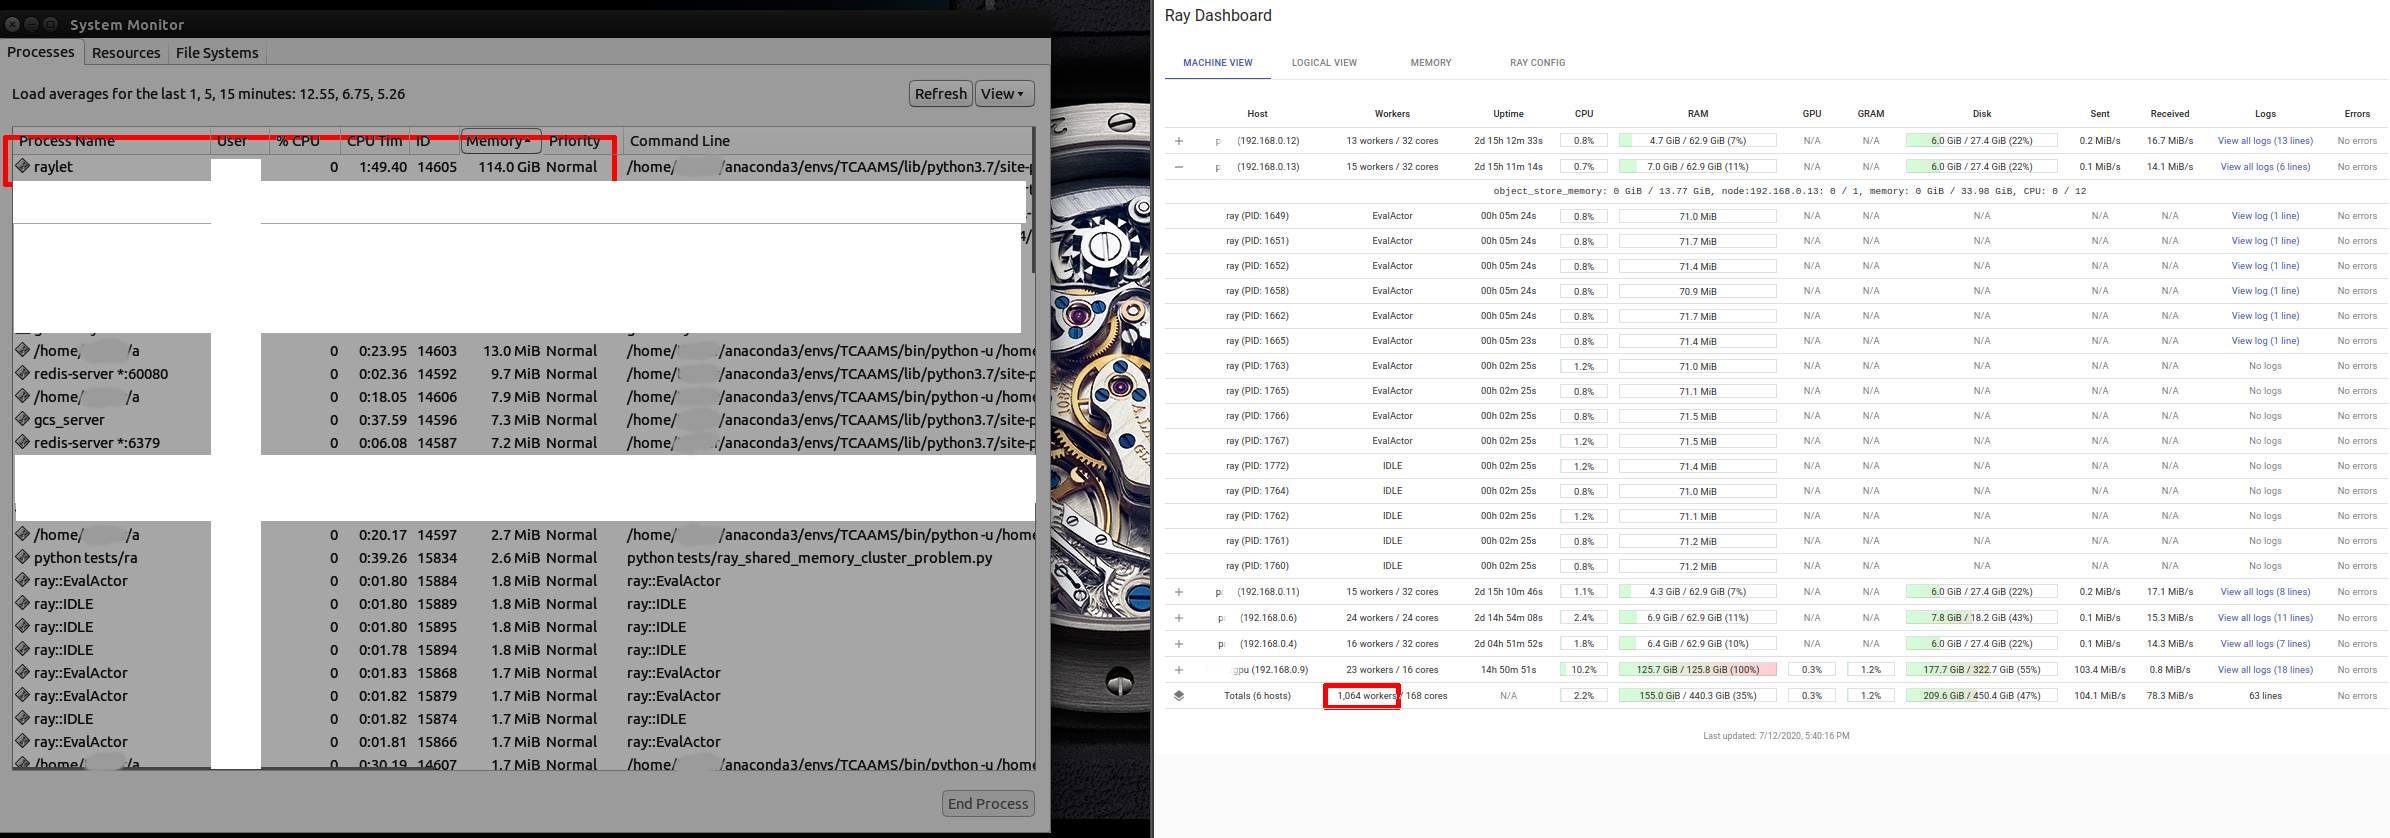
Essentially, once my shared memory numpy array gets past a certain size, the raylet process, while shipping to nodes, appears to grow to well over 100gb in memory, prob over 200, until a crash. If a node begins to help in shipping after it gets the object it too then creates a massive raylet process which faces the same issues.
(Note pic was taken during the run, not at end, the RAYLET ram usage went to 100% and began to fill swap entirely as well)
_Other issues I notice but are consistent and don't affect the memory issue. mentioned in case they point to other issues:_
- Number of workers in new version of ray, 0.8.6, seems to be some very large value for some reason, this is probably unrelated but wanted to mention
- I notice in dashboard some workers flash on and off, they seem to work fine, but the dashboard keeps adding and removing or never showing some workers.
Recreation script, with terminal output from crash:
https://gist.github.com/DMTSource/b50aeffde22b51bb82019d9b3e84f921
ray version: 0.8.6 (also tried on snapshot for 0.9.0.dev0 as requested, i've experience this issue across 0.8.4 and 0.8.5 if I recall...)
pd version: 1.0.1
np version: 1.18.1
python version 3.7.4
ubuntu 14.04
 DMTSource
All 24 comments
Just for a sanity check, can you try this again on the latest version of Ray (the nightly snapshots?)
 richardliaw
on 13 Jul 2020
richardliaw
on 13 Jul 2020
@richardliaw sure thing! I just ran the same process on the current snapshot for the wheel python 3.7, 0.9.0.dev0. But I am seeing similar behavior. I did not restart the host or worker machines however in case that can affect the test/ray install. I used the following command and then re-ran my above process(see recreation script) with the test script on the cluster:
pip install -U [link to 3.7 wheel]
Here is the output from this run:
https://gist.github.com/DMTSource/b50aeffde22b51bb82019d9b3e84f921#gistcomment-3373878
DMTSource
on 13 Jul 2020
thanks! another followup question; do you see this error occurring on a single node too?
richardliaw
on 13 Jul 2020
Sorry about that...I had tested that and deleted the info from the above report it seems before posting...
I have no problems when using a single machine to run this code. So no cluster setup, just an equivalent local init like:
ray.init(num_cpus=12, memory=32*1073741824, object_store_memory=20*1073741824)
The single system run uses very little memory, spiking to 30gb but that is all in the ray.put and data setup, after the ray.put and cleanup the memory use is very low and things finish quickly as expected.
In my actual work, I am able to use ray like this just fine on a single machine, and I am working on training 8 models at once vs using the cluster as desired(Im working with DEAP, not rlib or anything yet for training) and things are working great with shared memory on a single machine case.
Running it in this manner yields, in console:
$ python tests/ray_shared_memory_cluster_problem.py
ray.__version__: 0.9.0.dev0
pd.__version__: 1.0.1
np.__version__: 1.18.1
2020-07-12 19:17:31,218 INFO resource_spec.py:223 -- Starting Ray with 31.98 GiB memory available for workers and up to 20.0 GiB for objects. You can adjust these settings with ray.init(memory=, object_store_memory= ).
2020-07-12 19:17:31,697 INFO services.py:1193 -- View the Ray dashboard at localhost:8265
Ray put took: 27.7
n_workers: 12
actor init took: 0.0
batch took: 0.0
DMTSource
on 13 Jul 2020
Got it, thanks! cc @stephanie-wang
richardliaw
on 13 Jul 2020
You have the object
feature_values = np.random.random((int(5e6),500)).astype(np.float32)
which is about 5e6 x 500 entries (each 4 bytes), which gives 5e6 x 500 x 4 = 10GB for one object. Now, if you do something like
for _ in range(20):
    f.remote(feature_values)
Then under the hood, this will be equivalent to code that looks like
for _ in range(20):
    f.remote(ray.put(feature_values))
The call to ray.put just puts the object into the shared memory object store (which is part of the raylet process).
Now, if you are passing the object into 20 different tasks, then we could end up with 20 copies of that object simultaneously in the object store, which would give 10GB * 20 = 200GB.
Possible fix
If that is actually the issue, then one possible fix would be to make the ray.put call explicit, e.g., to do
feature_values_id = ray.put(feature_values)
for _ in range(20):
    f.remote(feature_values_id)
Then there should only be one copy in the object store.
By the way, in the dashboard, can you also click on the "memory" tab and see if that has any useful information?
 robertnishihara
on 13 Jul 2020
robertnishihara
on 13 Jul 2020
@robertnishihara re: explicit ray put, in the user provided gist, I think @DMTSource is already doing that:
    new_ind_batch = list(
        ind_creator_pool.map_unordered(
            lambda a, v: a.run_eval.remote(features_store_id), range(n_workers)
        )
I have also tried to accomplish a manual sync with a blocking loop. So before doing the actor pool work, I attempted to ensure each worker has the ability to access the shared object 1-by-1 to ensure no nodes were lacking the shared object.
Doing ray.get([actor.sync_func.remote(features_store_id) ) for actor in actors]) causes the same issue with exploding memory on host.
But if i try the blocking [ray.get(actor.sync_func.remote(features_store_id) ) for actor in actors], then it NEARLY(sometimes it'll work) gets around the problem. But once a new node has the shared item it then starts to ship(I guess) to other nodes(in dashboard I see the host and new node(s) split the network load for sending it seems). This results in the node(s) then starting up a raylet that usually grows until crash, like the host. But my nodes have half the ram(64 vs 128) of the host so this is problematic.
If I get lucky and the sync works in this way and I get to the pool's map call with all nodes synced, however there is still a massive raylet on the nodes and the program easily crashed as very little ram(a few gb) is left for actual work to be done via each actor.
I cleaned up the gist code to better show this effort in commented out code:
    ## This breaks the node once it becomes a shipper of shared mem objects, leaving behind a massive raylet on nodes
    #manual_sync = [ray.get(actor.run_eval.remote(features_store_id)) for actor in ind_creator_actors]
    ## kills the host same as current use of pool does as it attempts to ship all at once
    #manual_sync = ray.get([actor.run_eval.remote(features_store_id) for actor in ind_creator_actors])
    #gc.collect()
I will try the memory tab asap and report, it was blank before(on 0.8.6) but seems to work now(I have a single machine version doing work, on 0.9.0 dev) and I will try to get a look at it when the machines are available for more cluster-testing.
DMTSource
on 13 Jul 2020
cc @stephanie-wang
 rkooo567
on 17 Jul 2020
rkooo567
on 17 Jul 2020
Probably has something to do with the object transfer algorithm. I think broadcast of large objects has not been stable for some time now.
cc @zhuohan123 @suquark (who worked on a prototype for improving broadcast before), what do you think?
 stephanie-wang
on 18 Jul 2020
stephanie-wang
on 18 Jul 2020
I think my issue has to do with 2 things.
Updated recreation code:
https://gist.github.com/DMTSource/68f1b17fe076e33ef67a74ca7abce818
1) Load Balancing for the ActorPool(host can get many more workers than expected, nodes get less), which becomes really problematic with many machines. This is seemingly helped by manually syncing(passing the object in a blocking way, see gist), but the host is still overwhelmed easily with too many workers as more machines get added and the small inaccuracy in LB grows into a big problem. Broadcasting also may be an issue as so much ram needed host and nodes for shipping, and I am unsure how much of it cleans up after the sync(creating the need for the manual sync via a slow loop).
2) A strange, inconsistent issue where a machine will not report to the dashboard(or shows and disappears over and over), and whatever this bad state is, it causes the crazy memory leak the moment the actor pool's map_unordered is called. I've seen this issue of the missing-from-dashboard node for a few versions (0.8.4-.6 and now the 0.9.0dev0.) A restart usually fixes that, but then it quickly falls back into the bad state if I recall. _This machine still takes in some workers though and it sync manually(but very odd, elevated ram levels on nodes AND host), so it appears to be function and connecting to the cluster in some capacity but the LB or map calls really break down._
To address load balancing in general, I am attempting to use a suggestion from #946 (should this idea be in the docs for actor classes if valid still?), and ensure that when forming my worker pool, there is some sleep time to prevent bad distributions of load due to fast initializations. I start the cluster with 12 assigned out of 32 cpu per machine, for both the host and nodes.
# note inside the EvalActor class init I also use a small sleep like suggested in 946, but i noticed the actor creation loop seemed to be non blocking so I used the function below to guarantee a pause.
n_workers = int(ray.cluster_resources()['CPU']) # This prints to show the correct 36
def init_with_pause(n_items_per_batch):
        worker = EvalActor.remote(n_items_per_batch)
        sleep(0.1)
        return worker
actors = [init_with_pause(n_items_per_batch) for _ in range(n_workers)]
I removed the problematic machine for now and I am testing with 3(1 host + 2 nodes), which reduces issues with load balancing in general which is not ideal for testing the issue.
_So, now with the code below:_
When using a manual loop to sync the nodes(see gist url or suggestions above), I still end up with a small deviation from the desired load balance(12/32 per), so the host ends up with a few more workers than the nodes. This small issue may scale poorly for many nodes.
If I skip(comment out) the manual loop to sync, then the host gets MANY more workers, 20 when tested. But if I wait I can see the nodes do sync eventually while ram stays nominal on nodes and host(sort of, too many workers can easily hurt that, especially if the worker classes consume even more ram due to internal objects), and then the nodes launch the remaining number of workers to get to the tagert n_workers(36 with 3 the machines). If the host had any more workers though(will be especially true for 4+ machines) this would then cause a BIG memory issue on the host alone(i think this was my initial problem, so i need to manually sync but I NEED the number of workers per machine to hit their target or risk unpredictable behavior at scale).
It seems in either case the problem may actually be related to load balancing and perhaps ActorPool/map_unorderd. But also I am concerned about the possibly related, odd behavior of some nodes that go into the sort-of-broken state of not showing(or flashing) in the dashboard.
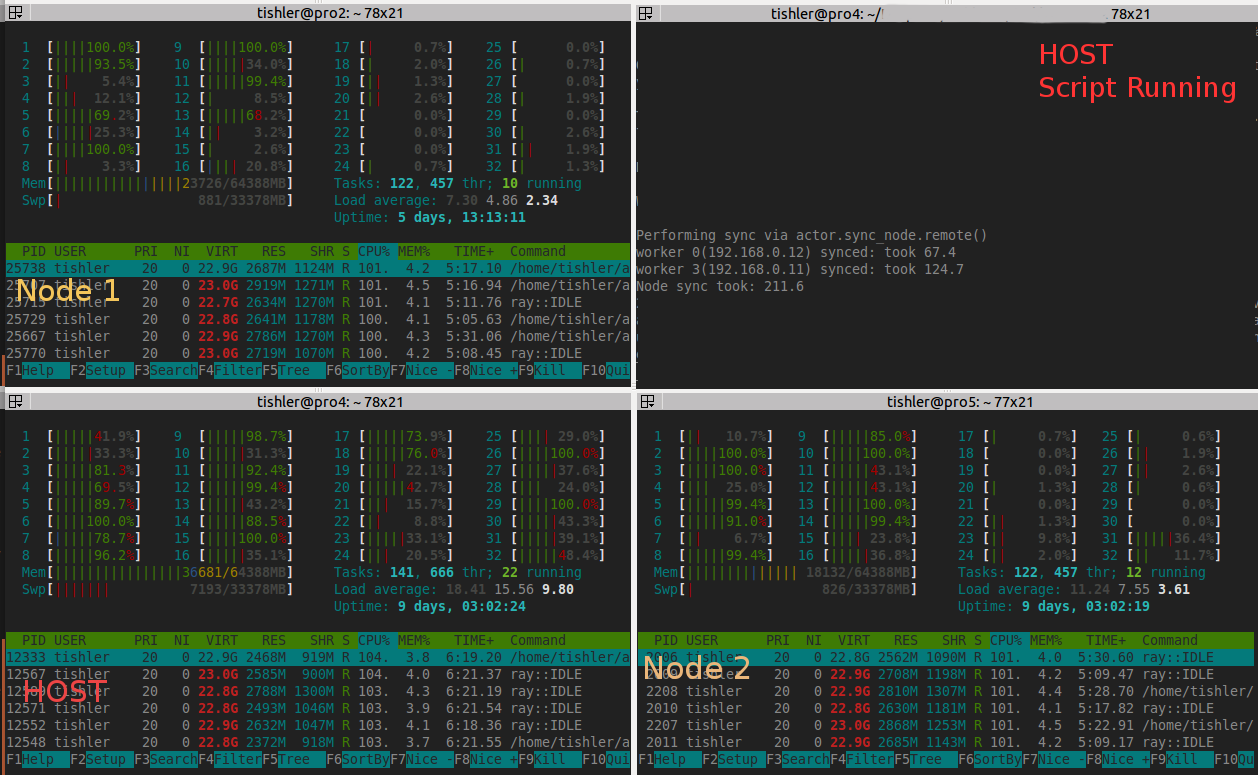
Here is an example from my production script(which now use the node sync from the gist before doing any work). I am unable to use more than 1 node + 2 machines due to the way memory is consumed by a large raylet combined with the bigger issue of extra workers on the host(should only be 12 but is 18, then the remaining 9 are split between the 2 nodes). Here is a pic of htop, dashboard, and the memory tab:
memory_tab_cluster_issue.txt

DMTSource
on 23 Jul 2020
I'm trying to take this one step at a time as I realize my summary above is a bit messy....Is there a way I can better ensure load balance in a manual cluster beyond the #946 sleep mentioned above? I have the current situation which may give clues to the issue(can skip to bold text at bottom):
Today I am trying to get a 4 machine cluster working. I am seeing no leaks! Even with 1 node not reporting to dashboard like mentioned previously, so that may not be relevant or helpful.
My host is assigned 12 num_cpu out of its 16 possible(was 14 num_cpu but had to drop it due to following), the nodes get 14 num_cpus. However, My host is usually running 17-20 of the workers created by the ActorPool, this is very problematic. _I realize this may still be related to broadcasting many large items at once, because I get the following warning(this is for my production code not the recreation example):_
2020-07-25 17:09:27,624 WARNING worker.py:1122 -- Warning: The actor RayDeapEval has size 447379250 when pickled. It will be stored in Redis, which could cause memory issues. This may mean that its definition uses a large array or other object.
This means: I have already performed a manual sync, of my feature array, with the cluster right after my put( I did a blocking loop and have already placed the large shared memory item on each node). However, when I then go to define the ActorPool and run map_unordered my host starts its work, but the nodes now need to receive their workers, which takes a minute or so due to the above large RayDeapEval remote actor class. Is THIS broadcast, or generally speaking any time consuming broadcast/worker launch on a manual cluster, bottlenecking and confusing the load balancer somehow and causing the 'bad' number of workers to be placed on the head vs the nodes which then causes memory issues or cpu saturation?
DMTSource
on 25 Jul 2020
Are you somehow including some state (probably via some python scope) inside the actor? Usually you want to avoid really large actors (and your actor seems really really large). I would imagine the fix is that there's some data that you should instead move via the object store.
richardliaw
on 25 Jul 2020
@richardliaw I reviewed the class and found that I was actually doing a bunch of work inside init, some of which was also indeed creating a large numpy array of bools. I will refactor the code to ensure I displace such work to a remote call after init, and work toward placing the troublesome array in the object store with the others to prevent this large actor issue.
However, I just noticed that when syncing to my nodes(I run a minimal class based on my gist above) there are still some machines with the wrong number of workers, this occurs well before the code relevant to the large deap actor. This deviation in loads is similar to the issue I was seeing when running the gists above. It appears I was mistaken in my previous post and the load balance issue persists. I will restart my servers and keep trying to find a pattern with the gist code from a few posts ago.
DMTSource
on 26 Jul 2020
Here is what I am seeing(screenshot below) and a more simple recreation script based on the above gists code.
I'm just trying to focus now on load balance, as my original memory issues are impossible to mess with at scale(over 4 servers) without control of how many workers, in this example NodeUpdater workers(ignoring IDLE, should they be sticking around vs being consumed?), are going to each machine.
- Target is 14 NodeUpdater workers per machine
- num_cpus=14 for all 3(1host + 2 nodes)..
- When I run the script, worker count is all over the place as shown in the pic below.
- Each time I run this script the servers take on a random number of NodeUpdater workers, one usually being close to or over 20.
'''
When I run this script. The number of workers on each machine seems to be all over the place. Sometimes 8, sometimes 20.
Many IDLE workers remain in most cases (see screenshot).

Starting manual cluster like:

host
ray start --head --redis-port=6379 --num-cpus=14 --num-gpus=0 --object-store-memory=21474836480
node(2x)
ray start --address='192.168.0.9:6379' --redis-password='5241590000000000' --num-cpus=14 --object-store-memory=21474836480

Recreation script:
'''

import time
import gc
from time import time, sleep
import numpy as np
import pandas as pd
import ray
from ray.util import ActorPool

#python 3.7.6
print("ray.__version__: %s" % ray.__version__) #0.9.0 dev0
print("pd.__version__: %s" % pd.__version__)   #1.0.1
print("np.__version__: %s" % np.__version__)   #1.18.1

ray.init(address='auto', redis_password='5241590000000000')


@ray.remote
class NodeUpdater():
    # some quick eval
    def __init__(self, n_steps_per_batch):
        self.n_steps_per_batch = n_steps_per_batch

        # trying to combat wrong number of workers per node: https://github.com/ray-project/ray/issues/946
        sleep(0.10)

    def sync_node(self, shared_feature_obj):
        sleep(0.10)
        return True

    def run_eval(self, shared_feature_obj):
        # perform work
        for _ in range(self.n_steps_per_batch):
            np.sum(shared_feature_obj)
        return True

if __name__ == "__main__":

    # create and put features
    feature_values = np.random.random((int(5e5),500)).astype(np.float32)
    features_store_id = ray.put(feature_values)

    n_workers = int(ray.cluster_resources()['CPU'])
    print("\nN_workers on cluster: %d" % n_workers)

    n_items_per_batch = 300 #do expensive batch loop inside worker

    '''# trying to slow down creation to see if it helps(it did not)
    def init_with_pause(n_items_per_batch):
        worker = NodeUpdater.remote(n_items_per_batch)
        sleep(0.25)
        return worker
    actors = [init_with_pause(n_items_per_batch) for _ in range(n_workers)]'''
    # same behavior as above
    actors = [NodeUpdater.remote(n_items_per_batch) for _ in range(n_workers)]

    ind_creator_pool = ActorPool(actors)

    start_time = time()
    new_ind_batch =  ind_creator_pool.map_unordered(
            lambda a, v: a.run_eval.remote(features_store_id), range(n_workers)
        )
    print(list(new_ind_batch))
    elapsed_time = time() - start_time
    print('map_unordered took: %0.1f' % elapsed_time)
Dashboard:

DMTSource
on 26 Jul 2020
Great! very helpful. To load balance, you should use custom resources (or assign each Actor more CPUs so that they won't overflow a certain machine).
I just realized we don't have documentation on Node resources; but what you can do to force node->actor placement is to use:
actor_cls = ray.remote(CLASS)
actor_cls = actor_cls.option(resources={"node:<node-ip>": 0.25})
[actor_cls.remote() for i in range(4)]

actor_cls = actor_cls.option(resources={"node:<node-ip2>": 0.25})
[actor_cls.remote() for i in range(4)]

actor_cls = actor_cls.option(resources={"node:<node-ip3>": 0.25})
[actor_cls.remote() for i in range(4)]
which will force actors to be placed on a certain node.
You can get all available node:ray.cluster_resources().
Does that help?
richardliaw
on 26 Jul 2020
I think you can also add ray.remote(num_cpus=1) to NodeUpdater?
rkooo567
on 26 Jul 2020
@rkooo567 suggestion worked...I must have misread the docs thinking it defaults to 1 in an equivalent way via the note here so I never bother to try that as it seemed redundant, but I'm seeing now this has to do with 'lifetime' resources as per the second part of the note. Now things are working just fine with the load balance!
@richardliaw Thank you for showing me Node resources in options, I can use that for a targeted shared item sync vs having to test each worker for the shared memory item which was wasting time.
Thank you both! I can now break my work up onto 2-4 server clusters and get to work without load balance issues!!!
I am now back to the beginning of the issue. For a massive shared memory item I have to sync the object in a blocking way and only on few servers can be put into a manual cluster at once.
- I tried passing the object directly to the workers via remote when using map_unordered. With 14 hosts over 8 machines this doesnt work of course for 112 workers at once.
- If I try to 'sync' the 8 nodes at once the same thing occurs, quickly filling the 128gb of host memory very quickly with a massive raylet.
- Syncing 1 node at a time for a 8 server cluster, my host slowly grew to 70+ gb, and a few nodes reached their limit of 65gb too before I had to stop the attempt.
- Working with smaller clusters, such as 2-3 maybe 4 servers, appears to work with my current ram limits. It appears there is indeed an issue with broadcasting and the raylet for this 10gb object(use 5e6 len features in code below) grows huge for a larger manual cluster.
Here is my script:
'''
Raylet grows uncontrollably on both host and workers if feature len is 5e6. It works for
small cluster of 2-4 machines, beyond that raylets seems to leak.

Starting manual cluster like:

host
ray start --head --redis-port=6379 --num-cpus=14 --num-gpus=0 --object-store-memory=21474836480
node(7x)
ray start --address='192.168.0.9:6379' --redis-password='5241590000000000' --num-cpus=14 --object-store-memory=21474836480

Recreation script:
'''

import gc
import numpy as np
import pandas as pd
import ray
from ray.util import ActorPool

#python 3.7.6
print("ray.__version__: %s" % ray.__version__) #0.9.0 dev0
print("pd.__version__: %s" % pd.__version__)   #1.0.1
print("np.__version__: %s" % np.__version__)   #1.18.1

ray.init(address='auto', redis_password='5241590000000000')

@ray.remote(num_cpus=1)
class NodeManualSync():
    def __init__(self):
        pass
    def sync_node(self, shared_feature_obj):
        return True

@ray.remote(num_cpus=1)
class Worker():
    # some quick eval
    def __init__(self, n_items_per_batch):
        self.n_items_per_batch = n_items_per_batch
        # trying to combat wrong number of workers per node: https://github.com/ray-project/ray/issues/946

    def run_eval(self, shared_feature_obj):
        # perform any batch operation with the obj, we passed(or are passing) it to the worker above so the damage is done
        for _ in range(self.n_items_per_batch):
            np.sum(shared_feature_obj)
        return True


if __name__ == "__main__":

    # create and put BIG features
    #feature_values = np.random.random((int(5e5),500)).astype(np.float32)
    feature_values = np.random.random((int(5e6),500)).astype(np.float32)
    features_store_id = ray.put(feature_values)

    n_workers = int(ray.cluster_resources()['CPU'])
    ips_of_nodes = [node['NodeManagerAddress'] for node in ray.nodes() if node['Alive']]

    print("\n%d workers on cluster of  1 host+%d nodes." % (n_workers, len(ips_of_nodes)-1))

    # pre sync the features to each node specifically(5e6 len features triggers the issues below)
    # Passing directly to every actor in pool causes huge raylet to form
    # Just doing all 7 nodes at once also takes over 128gb of memory, do it slowly:
    print('\nPerforming Manual Node Sync...')
    for ip in ips_of_nodes:
        actor_cls = NodeManualSync.options(resources={"node:%s"%ip: 0.25}).remote()
        ray.get(actor_cls.sync_node.remote(features_store_id))
        # We HAVE to clean up workers now since workers use @ray.remote(num_cpus=1)
        #    otherwise they consume cpu for lifetime even if idle and we max out cpu via map below.
        # Or can have them share via num_cpus=0.5, just for example. Not needed here.
        del actor_cls
        gc.collect()

    # create actors for doing heavy work
    n_items_per_batch = 10 #do expensive batch loop inside worker
    actors = [Worker.remote(n_items_per_batch) for _ in range(n_workers)]

    # create actor pool
    print('\nWorking via ActorPool...')
    actor_pool = ActorPool(actors)

    # do work
    results =  list(actor_pool.map_unordered(
            lambda a, v: a.run_eval.remote(features_store_id), range(n_workers)
        )
    )

    print(results)
@barakmich did you have time to look into this?
richardliaw
on 14 Aug 2020
I may have a reproduction using @DMTSource 's most recent code, I can relatively easily get the following C++ stack trace on my dev box:
F0821 21:18:05.024861 424272 424535 core_worker.cc:513]  Check failed: _s.ok() Bad status: IOError: Broken pipe
*** Check failure stack trace: ***
    @     0x7f03551957fd  google::LogMessage::Fail()
    @     0x7f0355196ec9  google::LogMessage::SendToLog()
    @     0x7f03551954e9  google::LogMessage::Flush()
    @     0x7f03551956f2  google::LogMessage::~LogMessage()
    @     0x7f035514a679  ray::RayLog::~RayLog()
    @     0x7f0354de8f17  _ZNSt17_Function_handlerIFvRKN3ray8ObjectIDEbEZNS0_10CoreWorkerC4ERKNS0_17CoreWorkerOptionsERKNS0_8WorkerIDEEUlS3_bE8_E9_M_invokeERKSt9_Any_dataS3_Ob
    @     0x7f0354e3c846  ray::ObjectRecoveryManager::PinOrReconstructObject()
    @     0x7f0354de126a  _ZZZN3ray10CoreWorkerC4ERKNS_17CoreWorkerOptionsERKNS_8WorkerIDEENKUlRKNS_8ObjectIDERKSt8functionIFvS9_RKSt6vectorINS_3rpc7AddressESaISD_EEEEE7_clES9_SL_ENKUlRKNS_6StatusERKSB_INSC_15ObjectTableDataESaISQ_EEE_clESP_SU_
    @     0x7f0354eb497a  _ZNSt17_Function_handlerIFvRKN3ray6StatusERKNS0_3rpc23GetObjectLocationsReplyEEZNS0_3gcs30ServiceBasedObjectInfoAccessor17AsyncGetLocationsERKNS0_8ObjectIDERKSt8functionIFvS1_RKSt6vectorINS4_15ObjectTableDataESaISG_EEEEEUlS3_S7_E_E9_M_invokeERKSt9_Any_dataS3_S7_
    @     0x7f0354e79d11  _ZNSt17_Function_handlerIFvRKN3ray6StatusERKNS0_3rpc23GetObjectLocationsReplyEEZNS4_12GcsRpcClient18GetObjectLocationsERKNS4_25GetObjectLocationsRequestERKSt8functionIS8_EEUlS3_S7_E_E9_M_invokeERKSt9_Any_dataS3_S7_
    @     0x7f0354e739d5  ray::rpc::ClientCallImpl<>::OnReplyReceived()
    @     0x7f0354da12b2  _ZN5boost4asio6detail18completion_handlerIZN3ray3rpc17ClientCallManager29PollEventsFromCompletionQueueEiEUlvE_E11do_completeEPvPNS1_19scheduler_operationERKNS_6system10error_codeEm
    @     0x7f03551d9b28  boost::asio::detail::scheduler::do_run_one()
    @     0x7f03551da691  boost::asio::detail::scheduler::run()
    @     0x7f03551dd894  boost::asio::io_context::run()
    @     0x7f0354d83bdf  ray::CoreWorker::RunIOService()
    @     0x7f0327cbcbf4  execute_native_thread_routine
    @     0x7f03585469a1  start_thread
    @     0x7f03589ef193  __GI___clone
zsh: abort (core dumped)  python oom_failure.py
This matches the previous stack trace in the initial gist (https://gist.github.com/DMTSource/b50aeffde22b51bb82019d9b3e84f921) -- pruned because logs are intertwined:
F0712 19:01:12.391517 19469 19484 core_worker.cc:490] Check failed: _s.ok() Bad status: IOError: Broken pipe
*** Check failure stack trace: ***
@ 0x7f23ba5577dd google::LogMessage::Fail()
@ 0x7f23ba55893c google::LogMessage::SendToLog()
@ 0x7f23ba5574b9 google::LogMessage::Flush()
@ 0x7f23ba5576d1 google::LogMessage::~LogMessage()
@ 0x7f23ba5413a9 ray::RayLog::~RayLog()
@ 0x7f23ba252f85 _ZNSt17_Function_handlerIFvRKN3ray8ObjectIDEbEZNS0_10CoreWorkerC1ERKNS0_17CoreWorkerOptionsERKNS0_8WorkerIDEEUlS3_bE10_E9_M_invokeERKSt9_Any_dataS3_b
@ 0x7f23ba2a9e92 ray::ObjectRecoveryManager::PinOrReconstructObject()
@ 0x7f23ba2538f5 ZNSt17_Function_handlerIFvN3ray6StatusERKSt6vectorINS0_3rpc15ObjectTableDataESaIS4_EEEZZNS0_10CoreWorkerC1ERKNS0_17CoreWorkerOptionsERKNS0_8WorkerIDEENKUlRKNS0_8ObjectIDERKSt8functionIFvSJ_RKS2_INS3_7AddressESaISL_EEEEE9_clESJ_ST_EUlRKS1_S8_E_E9_M_invokeERKSt9_Any_dataS1_S8
@ 0x7f23ba32a40b ZNSt17_Function_handlerIFvRKN3ray6StatusERKNS0_3rpc23GetObjectLocationsReplyEEZNS0_3gcs30ServiceBasedObjectInfoAccessor17AsyncGetLocationsERKNS0_8ObjectIDERKSt8functionIFvS1_RKSt6vectorINS4_15ObjectTableDataESaISG_EEEEEUlS3_S7_E_E9_M_invokeERKSt9_Any_dataS3_S7
@ 0x7f23ba2efedf ZNSt17_Function_handlerIFvRKN3ray6StatusERKNS0_3rpc23GetObjectLocationsReplyEEZNS4_12GcsRpcClient18GetObjectLocationsERKNS4_25GetObjectLocationsRequestERKSt8functionIS8_EEUlS3_S7_E_E9_M_invokeERKSt9_Any_dataS3_S7
@ 0x7f23ba2effe3 ray::rpc::ClientCallImpl<>::OnReplyReceived()
@ 0x7f23ba21d960 _ZN5boost4asio6detail18completion_handlerIZN3ray3rpc17ClientCallManager29PollEventsFromCompletionQueueEiEUlvE_E11do_completeEPvPNS1_19scheduler_operationERKNS_6system10error_codeEm
@ 0x7f23ba7946df boost::asio::detail::scheduler::do_run_one()
@ 0x7f23ba7952f1 boost::asio::detail::scheduler::run()
@ 0x7f23ba796242 boost::asio::io_context::run()
@ 0x7f23ba202f80 ray::CoreWorker::RunIOService()
@ 0x7f23bbeee421 execute_native_thread_routine_compat
@ 0x7f23d01f1184 start_thread
@ 0x7f23cff1e03d clone
Aborted (core dumped)
Is this looking about right? It's probably more than coincidence, and it gives a very direct place to dive in
Also has the feature that a local ray.init (as per the gist) works fine
 barakmich
on 21 Aug 2020
barakmich
on 21 Aug 2020
@barakmich I think that stacktrace is just an indication that the local raylet has crashed. The error message is unfortunately not informative, but I believe this comes up when the Python driver receives an error on its IPC connection to its local raylet. So it does seem like you are reproducing some crash, but you'll probably need to dig into the raylet logs more, not the driver.
stephanie-wang
on 22 Aug 2020
I'm facing a similar issue. I have 4 machines, and one of them is a machine with a GPU.
For example, we name these machines in A, B, C, D, and D is the GPU machine.
Before some modifications I do:
- on D, put some parameters to an actor on A
- actors on B and C will get the parameters from the actor on A
After some modifications I do: - on D, put some parameters to an actor on A
- one of actors on B or C will get the parameters from the actor on A
- then this actor will use
ray.putto put parameters in the object store memory on B or C - other actors will get the object id from the actor on its local machine and use
ray.getto get the real object
So the problem is in the second situation, the actors on D, which put the parameters, will use a lot of SHR memory (40+GB), and the raylet on D will eventually crash due to lack of shared memory, which is set to 150GB. The total memory available on D is 367GB.
I thought it was a good way to improve the first situation before applying these modifications. But I didn't know this issue would happen and destroy the training progress.
 Seraphli
on 25 Aug 2020
Seraphli
on 25 Aug 2020
@DMTSource if you're still running into this, it should be fixed in the nightly wheels. Let us know if the issue still happens!
 ericl
on 11 Nov 2020
ericl
on 11 Nov 2020
@ericl I tested with 4 machines using the wheel: ray-1.1.0.dev0. I am seeing absolutely no odd/extra ram use or issues like before on any machine due to the large plasma object broadcast. I will try at larger scales asap but the broadcasting is now going very smoothly. Thank you all and congrats on ray 1.0+ release!
DMTSource
on 18 Nov 2020
Related issues
 0luhancheng0
·
3Comments
0luhancheng0
·
3Comments
 dragon28
·
3Comments
ericl
·
3Comments
dragon28
·
3Comments
ericl
·
3Comments
 Khalilsqu
·
3Comments
robertnishihara
·
3Comments
Khalilsqu
·
3Comments
robertnishihara
·
3Comments