Ray: [RFC][tune] Improving User Experience
Problem
Although Tune is (somewhat) easy to setup and get started, it doesn't provide the best user experience (compared to tools like bazel, keras).
For one, the result logs are too verbose. There's so much text printed, especially for a distributed experiment when running 20+ jobs at once.
Second, for the same reason, it's very annoying and unpleasant to use Tune in a Jupyter notebook. This probably loses half the Data Sci crowd.
Third, there are way too many logs and notifications and info strings provided that don't really inform the user.
Finally, we should integrate with Tensorboard HParams #4528.
Questions
- What would be the ideal Tune user experience?
- What are things that Tune should not output?
- What knobs should we expose to make the Tune output more pleasant (i.e., custom metrics?)
- (Also, any general Tune feedback can be shared here).
Please share your thoughts. We will keep this RFC open for a while. I'd really appreciate your feedback!
 richardliaw
All 10 comments
If Ray code is running, and is interrupted by the user, the Notebook must be restarted to continue using Ray. To see a workable example, check out this code link by running the first cell, then the second cell, then interrupting the second cell (which hangs) and then trying to re-run the second cell; it throws an error which can only be fixed if the user restarts the Notebook. In the case of a lengthy project contained throughout many Notebook cells, this becomes a bad user experience.
 kiddyboots216
on 13 Jun 2019
kiddyboots216
on 13 Jun 2019
Hey @kiddyboots216 would you mind sharing me the code link to me? [email protected]
 angelotc
on 25 Aug 2019
angelotc
on 25 Aug 2019
@angelotc done
kiddyboots216
on 26 Aug 2019
@richardliaw @ericl
Great topic! Background - I've been using gym, tune and rllib full time for the past year with the Python API in a single local machine.
TL;DR:
Overall, I believe that ray has a great and scalable architecture overall so it shouldn't be painful to improve the UX. The UX to set up and run the experiment is great. The UX to inspect running experiment (tensorboard) is great, but can be improved with HParams, computation graph tab and custom user tabs. The UX to restore tuned agents is frankly a painful experience which requires low level work on user side even to do simple stuff.
An ideal workflow could be:
- Set up and run experiments: @kiddyboots216 point and verbosity of loggings are the only issues in my view. Just initializing a PPO agent takes a few tens of lines of loggings and pollutes the notebook if done many times (e.g. to initialize or restore different agents). IMO the default behavior should ERROR level loggings by default on rllib side. A progress bar on tune side would help. Experiment(s) progresses should override the previous progress instead of sequentially printing everything (at least in a jupyter notebook).
- Visualize the results in real time: Ideally in tensorboard (or tensorboardX for pytorch). The computation graph should be added in tensorboard (e.g. see here). Adding custom metrics is easy, but they all belong to the tab 'ray'. Even just adding custom tabs in tensorboard with ray requires low-level work which took me several hours to get right.
- Model selection: . At the moment, tune does not provide any tool to compare results using different hyperparameters afaik. In this regard, HParams would be an exceptionally good feature.
- Model restoration: i.e. oneliner to restore computation graph(s), config and weights by default. e.g in stable-baselines (openAI fork) it's just a matter of restoring a single pickle file as opposed to putting together files from non-trivial folders and files hierarchy in ray. The ExperimentAnalysis is a promising direction but really too green for now in my view. I had to implemented and use my own class to restore experiments/agents. I believe that it's design is not enough scalable so I hope that it will be revised, but I'd like to offer my perspective on this in a dedicated thread.
 FedericoFontana
on 2 Sep 2019
FedericoFontana
on 2 Sep 2019
Hey @FedericoFontana, this is really good feedback, and I'll try to get to all of this in the next month. Appreciate you spending time to put this together!
RE: ExperimentAnalysis, I'll probably implement something that keeps everything in memory. That should scale much nicer than the current version.
richardliaw
on 2 Sep 2019
cc @hershg
richardliaw
on 10 Sep 2019
I think when it comes to visualizing and comparing different experiments, Weights & Biases is one of the best choice. It can
- compare multiple runs
- save model graph
- save and query hyperparameter configuration of different trials
- real-time visualization
demo video
I suggest either we can build a wandb-like experiment management/comparison/visualization, or we can integrate deeply with wandb.
 richarddwang
on 17 Sep 2019
richarddwang
on 17 Sep 2019
@richardyy1188 Can you try the Weights and Bias Tune Logger? https://github.com/wandb/client/tree/master/wandb/ray
richardliaw
on 17 Sep 2019
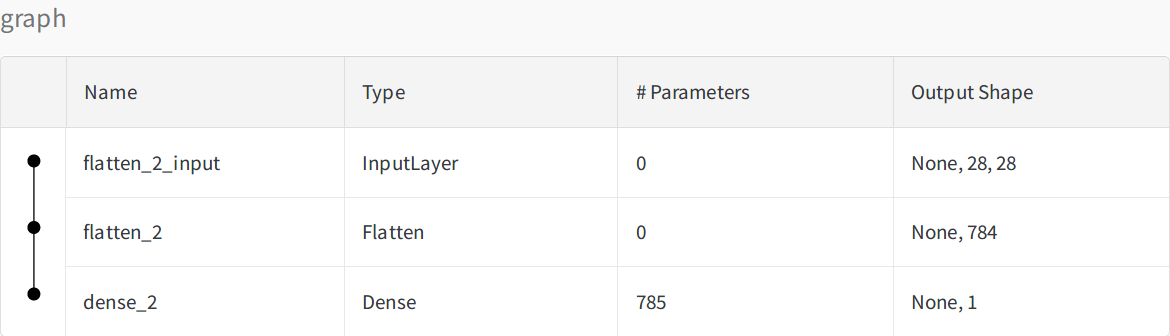
Yes I tried it. But it seems there's no way to use wandb.watch(my_model_instance) with tune. This call is to track gradient and save the model graph, to show sth. like this
The problem I encountered is watch should called after init, but if we put watch in logger like below, we can't catch the model instance it needs.
class ... (trainable):
   def _setup(self, config):
       m = Model().cuda()
       self.config['my_model'] = m

class wandblogger(tune.logger):
  def __init__(self):
      wandb.init(...)
      wandb.watch(config[my_model]) # pyarrow: ... can't pass cuda ... cpu memory,
And we can't just do init and watch in trainable or outside, cuz it seems they and logger are in different process.
richarddwang
on 22 Sep 2019
Got it; we should integrate more with them then.
richardliaw
on 24 Sep 2019
Related issues
 AndreCNF
·
3Comments
AndreCNF
·
3Comments
 timonbimon
·
3Comments
timonbimon
·
3Comments
 coreylowman
·
3Comments
coreylowman
·
3Comments
 thedrow
·
3Comments
thedrow
·
3Comments
 robertnishihara
·
3Comments
robertnishihara
·
3Comments
Most helpful comment
Got it; we should integrate more with them then.