Ray: [xray] perf regression when transferring a large number of small objects across dockers
System information
OS Platform and Distribution (e.g., Linux Ubuntu 16.04):
Ubuntu in docker
Linux f3559e14813a 4.9.87-linuxkit-aufs #1 SMP Wed Mar 14 15:12:16 UTC 2018 x86_64 x86_64 x86_64 GNU/LinuxRay installed from (source or binary): source
- Ray version: 0.5.0
- Python version: Python 2.7.12 :: Anaconda 4.2.0 (64-bit)
- Exact command to reproduce: See below for details
Describe the problem
I wrote a python script for performance test, which transfers 100K integers from on actor to another actor, each actor running in a different docker. Previously with legacy ray it takes about 1 minute, while with raylet enabled it takes 3 minutes.
On docker 2, do:
ray start --head --redis-port=6379 --resources='{"Resource2": 4}' --use-raylet
On docker1, do:
ray start --redis-address 172.17.0.3:6379 --resources='{"Resource1": 2}' --use-raylet
Then on docker1, run:
python perf.py
Source code / logs
[Perf.py source code]
 zhijunfu
All 26 comments
@robertnishihara @pcmoritz @istoica is it expected?
 eric-jj
on 18 Jul 2018
eric-jj
on 18 Jul 2018
Currently xray performance is a bit worse than legacy Ray performance. We still have a lot of performance optimizations to do.
How big is the slowdown in this example?
EDIT: Oh I see, 1 minute to 3 minutes. That's bigger than expected.
 robertnishihara
on 18 Jul 2018
robertnishihara
on 18 Jul 2018
In our testing, raylet cost 3x slower than non-raylet path.
We call an empty function which accept an int as input parameter for 100k times. The non-raylet path cost 1 min, but the raylet path cost 3mins.
eric-jj
on 18 Jul 2018
hmm, I'll look into this as well
 atumanov
on 19 Jul 2018
atumanov
on 19 Jul 2018
The bits running in docker is not latest ray, but was sync'ed around a while ago. I just tried latest ray, and I could reproduce the problem on my macbook using the same script, without using docker. And the perf regression looks more significant - the same script doesn't complete in 15 minutes this time.
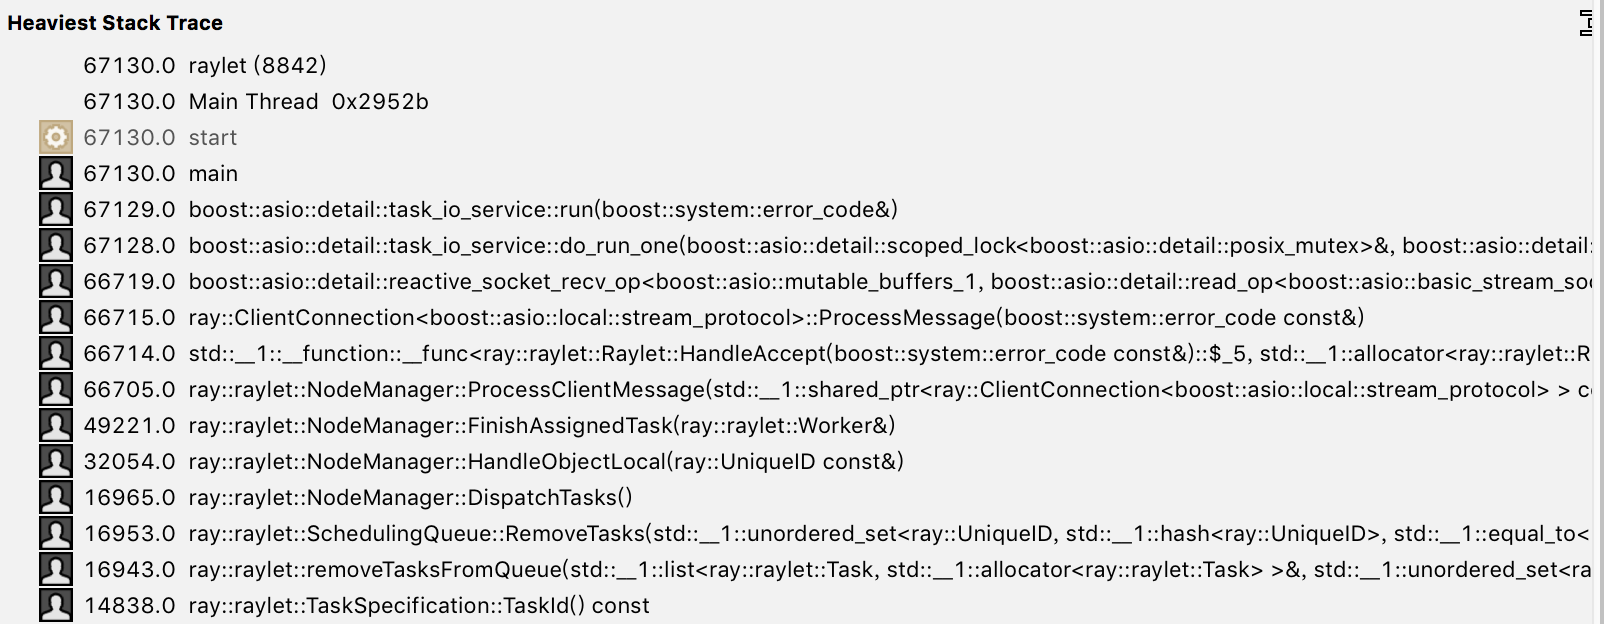
Did some tracing and I think I found the root cause - removeTaskFromQueue() takes too much time. I'm working on a fix. Will post updates.
zhijunfu
on 19 Jul 2018
Here's the hottest callstack.
zhijunfu
on 19 Jul 2018
Thanks, Zhijun.
These are the number of calls, right?
Can we also get the time spent in these calls? That would be more useful
for profiling.
Thanks!
Ion
On Wed, Jul 18, 2018 at 8:55 PM, Zhijun Fu notifications@github.com wrote:
Here's the hottest callstack.
[image: callstack]
https://user-images.githubusercontent.com/37800433/42920687-96ebbaf8-8b4a-11e8-9c7c-fa81b283d409.png—
You are receiving this because you were mentioned.
Reply to this email directly, view it on GitHub
https://github.com/ray-project/ray/issues/2403#issuecomment-406146898,
or mute the thread
https://github.com/notifications/unsubscribe-auth/ABGKQbM6aAPRgoEvXsPqpB3iwu-odF0Fks5uIANEgaJpZM4VQo6g
.
 istoica
on 19 Jul 2018
istoica
on 19 Jul 2018
@istoica
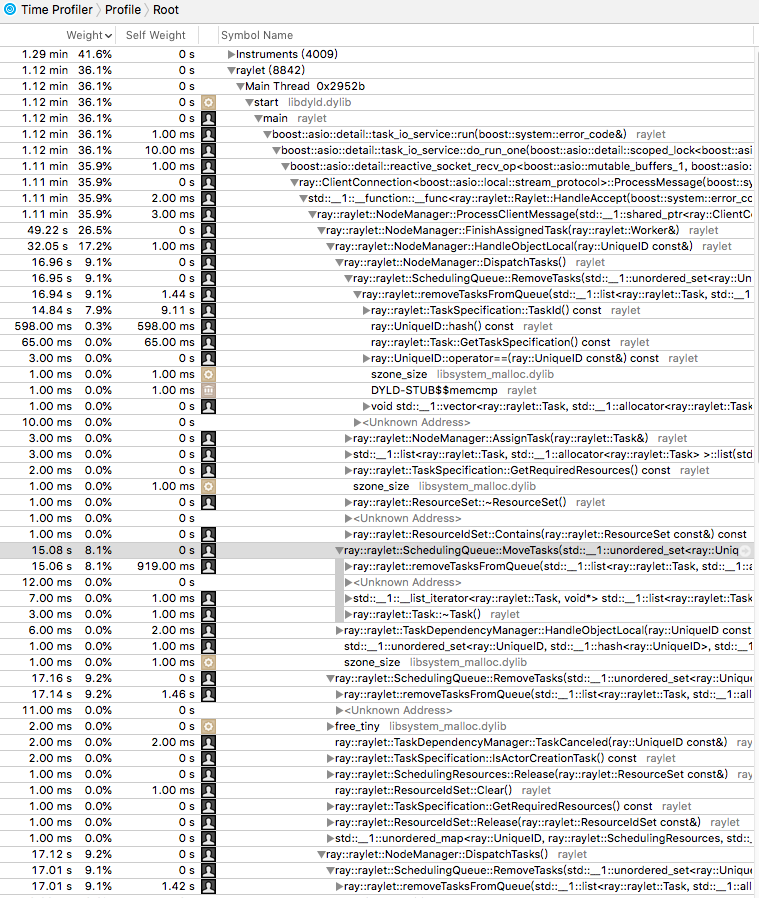
Sure Ion. Here's the calltack with time information.
zhijunfu
on 19 Jul 2018
@zhijunfu Thanks. Adding @atumanov as well.
istoica
on 19 Jul 2018
@zhijunfu I would hold off on any fix that touches the queues until after https://github.com/ray-project/ray/pull/2420 is merged.
The inefficiency of removeTasksFromQueue has been a known issue since the very beginning. Once direct transfers between queues are implemented, this issue will be resolved.
atumanov
on 19 Jul 2018
@atumanov sure, thanks for the context.
Just to update this thread:
I made a simple fix by using hash + list to represent a local queue, and running the same script now takes around 40s (instead of 15+ minutes), which is comparable to numbers on legacy ray. I'll hold off the fix until Alexey get his changes in.
zhijunfu
on 19 Jul 2018
@zhijunfu that's excellent! Thanks for the fix. There's no harm in opening a PR now I think, but yes you're right there are a few other current PRs that touch similar parts of the code.
robertnishihara
on 20 Jul 2018
@robertnishihara sure, I just created a PR for this one.
https://github.com/ray-project/ray/pull/2438
BTW, just to clarify the problem a little bit. There are two issues here:
- Single box performance issues. That's the one I met when running a python script to transfer 10K integers between actors, which previously took about 40s and now takes 15+ minutes with raylet. This can be resolved by this fix.
- The original issue that transferring 10K ints between two actors running in different dockers, which previously takes 1 minute and now takes 3 minutes with raylet. This one is a separate issue. Note that this problem only happens when two actors run in different dockers. Root cause is still understand investigation.
zhijunfu
on 20 Jul 2018
@robertnishihara @istoica @stephanie-wang
I got some updates for issue 2 above.
- Most time of raylet is spent on lineage related code, including allocate/free memory, manipulating lineage hashtable, and serializing/deserializing flat buffers.
- Memory allocation & free cost is very high, together they account for 50% CPU cycles in raylet.
I made some changes to reduce unnecessary allocation/free with lineage entries, that brought the time down from 180s to 130s. I can send a PR for the change - if there are no existing on-going related PRs. There are still big gaps compared to previous numbers (40s), and some additional effort is going to be needed to get it on-par.
zhijunfu
on 23 Jul 2018
Here's are the raylet hot callstacks captured in two dockers, Actor A runs in docker 1, and actor B runs in docker 2. The raw numbers are obtained with perf command, and converted to graph with another tool. You'll need to enlarge it a few times to see it clearly:)


zhijunfu
on 23 Jul 2018
@zhijunfu thanks, I'd be happy to review a PR for improving lineage allocation and deallocation!
For the serialization/deserialization overheads, I think we can improve it by rethinking some of the lineage stash algorithm. The workload you've been testing with causes actor A's node manager to send the entire stashed lineage of every task submitted to actor B to actor B's node manager. Even though the lineage gets periodically evicted, it's pretty clear that this will be worse than doing nothing at all, like in legacy Ray.
There is a lot of duplicate lineage that's getting sent with the current lineage stash algorithm. I think we can improve it by keeping track of which node managers have received which lineage so far. Then, when node manager A forwards a task for actor B to node manager B, it can send the message without any uncommitted lineage, since it knows that it already sent node manager B the same lineage with a previous message.
Also, from running the script you sent me, I noticed that in xray, actor A only finishes pushing messages to actor B shortly before actor B finishes reading the messages. This is in contrast to legacy ray, where actor A finishes pushing soon (6s) after starting. I believe this is due to a known issue that we've had with asio where, for a single event handler on a socket, we're only handling one message at a time. This means that if there are multiple messages in the socket, the next message will get delayed until its event handler is processed. We should fix this by processing as many messages as possible from any type of socket, possibly with some upper bound on how much time we can spend in a single event handler. I think this will probably help with the slowdown that you're seeing as well.
 stephanie-wang
on 23 Jul 2018
stephanie-wang
on 23 Jul 2018
@stephanie-wang Thanks a lot for the explanations, appreciate that!
As a first step, here's the PR for the improvement I mentioned earlier, basically to avoid unnecessary allocation/free for lineage entries. Kindly let me know in case of any comments:)
zhijunfu
on 24 Jul 2018
@zhijunfu Some results for perf.py, in which actor A calls actor B 100K times, and each call takes a single integer as argument. The result are on my macbook:
- Existing Ray: 1min
- 0.5 Raylet: 3min and 20sec
- Raylet with the scheduling queue optimizations (PR 2438): 2min
- Raylet with the scheduling optimization + reducing lineage cache to 1 (this was only for testing; we are working on a fix right now): 45sec
So things look reasonable promising.
istoica
on 2 Aug 2018
@istoica Thanks. This is great! Yes I saw PR for reducing lineage is already under review :-)
zhijunfu
on 3 Aug 2018
I've been looking into this issue for a bit and here is what I found so far:
- On master on my laptop, the script runs in about 35s.
- The sending actor finishes much earlier than the receiving actor, so the benchmark is bottlenecked on the receiving node for most of the job.
- Profiling the receiving node shows that it spends most of its time in
mallocfor redis commands. The main redis commands are for adding to theTaskLeaseTableand adding to theTaskTable. After taking out writes to the former (which we write to at least as many times as toTaskTable), there is no discernible difference in runtime. - The number of bytes available in the node manager-to-node manager socket blew up as more tasks are sent. This is because the receiving node manager is not reading out tasks fast enough due a known asio issue where a handler only processes 1 message a time from a socket, the same issue that I referenced in my previous comment. A symptom of this was that some of the
ForwardTaskmessages (which are written synchronously from one node manager to another) would take >100ms to complete. I modified the node manager to read out moreForwardTaskmessages per handler, but this did not affect the overall runtime. I do think we should incorporate this change into master though. Another thing we could do to reduce theForwardTasklatency is to write the message asynchronously, but we would have to buffer the messages ourselves (I haven't implemented this fully, but I think it's worth doing). - From the above points, i decided that the runtime is mostly going towards the loop between the receiving node manager and actor, which is basically: actor calls
GetTask, the node manager assigns the actor a task, the actor executes it, and repeat. there is very little that i can see on the node manager side to optimize at first glance, but there may be places on the Python side that we can speed up. - Since throughput seemed to be bottlenecked by the Python actor, I upped the number of actors to see what the throughput would look like then. With 4 pairs of sending and receiving actors, the job finishes in about 81s.
- The overall throughput of the job is significantly lower than the stable throughput for the receiving actor. For 4 pairs of actors, the overall throughput is 400k/81 = ~5k tasks/s. However, after the first couple rounds, each of the actors sends 10k tasks every 5s, which means a stable throughput of about 40k/5 = ~8k tasks/s. That means there's an unexplained delay of about 30s at the beginning of the job, when the sending actors are still submitting tasks. I haven't looked much into what's happening during this period yet, other than the note about not reading from the socket fast enough.
- After investigating the Python side a bit more, I tried commenting out
ray.putentirely so that each task on the receiving actor does not put any of its return values in the object store. Obviously this won't work as a general optimization, but just to illustrate what the overhead ofray.putis. For a single sending and receiving actor, this increased the stable throughput on the receiving actor from 10k/3s to 10k/1.5s.
So in summary, the main performance issues that I've found so far are:
- asio handlers need to process more than one event at a time, within some reasonable time limit.
ray.putadds significant overhead when there are many tiny tasks.
stephanie-wang
on 16 Aug 2018
Thanks, Stephanie. Great investigation work!
When you use 4 pairs of actors, how many integers you are you sending between each pair, still 100K?
Otherwise, can we check the throughout of ray.put() is less than 10K/sec. This seems quite low. Can we double check this number with a simple experiment? Just put 100K or 1M integers.
Thanks,
Ion
Sent from my iPhone
On Aug 16, 2018, at 5:33 AM, Stephanie Wang notifications@github.com wrote:
I've been looking into this issue for a bit and here is what I found so far:
On master on my laptop, the script runs in about 35s.
The sending actor finishes much earlier than the receiving actor, so the benchmark is bottlenecked on the receiving node for most of the job.
Profiling the receiving node shows that it spends most of its time in malloc for redis commands. The main redis commands are for adding to the TaskLeaseTable and adding to the TaskTable. After taking out writes to the former (which we write to at least as many times as to TaskTable), there is no discernible difference in runtime.
The number of bytes available in the node manager-to-node manager socket blew up as more tasks are sent. This is because the receiving node manager is not reading out tasks fast enough due a known asio issue where a handler only processes 1 message a time from a socket, the same issue that I referenced in my previous comment. A symptom of this was that some of the ForwardTask messages (which are written synchronously from one node manager to another) would take >100ms to complete. I modified the node manager to read out more ForwardTask messages per handler, but this did not affect the overall runtime. I do think we should incorporate this change into master though. Another thing we could do to reduce the ForwardTask latency is to write the message asynchronously, but we would have to buffer the messages ourselves (I haven't implemented this fully, but I think it's worth doing).
From the above points, i decided that the runtime is mostly going towards the loop between the receiving node manager and actor, which is basically: actor calls GetTask, the node manager assigns the actor a task, the actor executes it, and repeat. there is very little that i can see on the node manager side to optimize at first glance, but there may be places on the Python side that we can speed up.
Since throughput seemed to be bottlenecked by the Python actor, I upped the number of actors to see what the throughput would look like then. With 4 pairs of sending and receiving actors, the job finishes in about 81s.
The overall throughput of the job is significantly lower than the stable throughput for the receiving actor. For 4 pairs of actors, the overall throughput is 400k/81 = ~5k tasks/s. However, after the first couple rounds, each of the actors sends 10k tasks every 5s, which means a stable throughput of about 40k/5 = ~8k tasks/s. That means there's an unexplained delay of about 30s at the beginning of the job, when the sending actors are still submitting tasks. I haven't looked much into what's happening during this period yet, other than the note about not reading from the socket fast enough.
After investigating the Python side a bit more, I tried commenting out ray.put entirely so that each task on the receiving actor does not put any of its return values in the object store. Obviously this won't work as a general optimization, but just to illustrate what the overhead of ray.put is. For a single sending and receiving actor, this increased the stable throughput on the receiving actor from 10k/3s to 10k/1.5s.
So in summary, the main performance issues that I've found so far are:asio handlers need to process more than one event at a time, within some reasonable time limit.
ray.put adds significant overhead when there are many tiny tasks.
—
You are receiving this because you were mentioned.
Reply to this email directly, view it on GitHub, or mute the thread.
istoica
on 16 Aug 2018
Yes, each pair sends 100k.
Good point. On my laptop, without warming up the object store and without hugepages, ray.put of 100k integers takes 14.6s. This matches the overhead I was seeing when running the full actor benchmark.
@pcmoritz pointed out that Arrow serialization is very good for large numpy arrays, but won't be as efficient for objects like a single integer. Perhaps we should consider using something like the default pickle for small objects.
stephanie-wang
on 16 Aug 2018
What would be the overhead using pickle in this case?
Ion
Sent from my iPhone
On Aug 16, 2018, at 9:45 PM, Stephanie Wang notifications@github.com wrote:
Yes, each pair sends 100k.
Good point. On my laptop, without warming up the object store and without hugepages, ray.put of 100k integers takes 14.6s. This matches the overhead I was seeing when running the full actor benchmark.
@pcmoritz pointed out that Arrow serialization is very good for large numpy arrays, but won't be as efficient for objects like a single integer. Perhaps we should consider using something like the default pickle for small objects.
—
You are receiving this because you were mentioned.
Reply to this email directly, view it on GitHub, or mute the thread.
istoica
on 17 Aug 2018
@stephanie-wang the issue might be the arrow serialization, but it could also be the many IPCs that we do to the plasma store (at least 3 (create/seal/release)).
robertnishihara
on 17 Aug 2018
@robertnishihara good point. @stephanie-wang, can we test this by creating an empty object?
Another way to figure out the overhead is to serialize some data structure whose serialization is linear in its size, maybe an arrray? Serialize then this data structure at a few different sizes and then fit a +b*size. We need to find “a” which is the fixed overhead.
istoica
on 17 Aug 2018
Auto-closing stale issue.
 ericl
on 6 Mar 2020
ericl
on 6 Mar 2020
Related issues
 thedrow
·
3Comments
thedrow
·
3Comments
 zhaokang1228
·
3Comments
robertnishihara
·
3Comments
zhaokang1228
·
3Comments
robertnishihara
·
3Comments
 monocongo
·
3Comments
ericl
·
3Comments
monocongo
·
3Comments
ericl
·
3Comments
Most helpful comment
@zhijunfu Some results for perf.py, in which actor A calls actor B 100K times, and each call takes a single integer as argument. The result are on my macbook:
So things look reasonable promising.