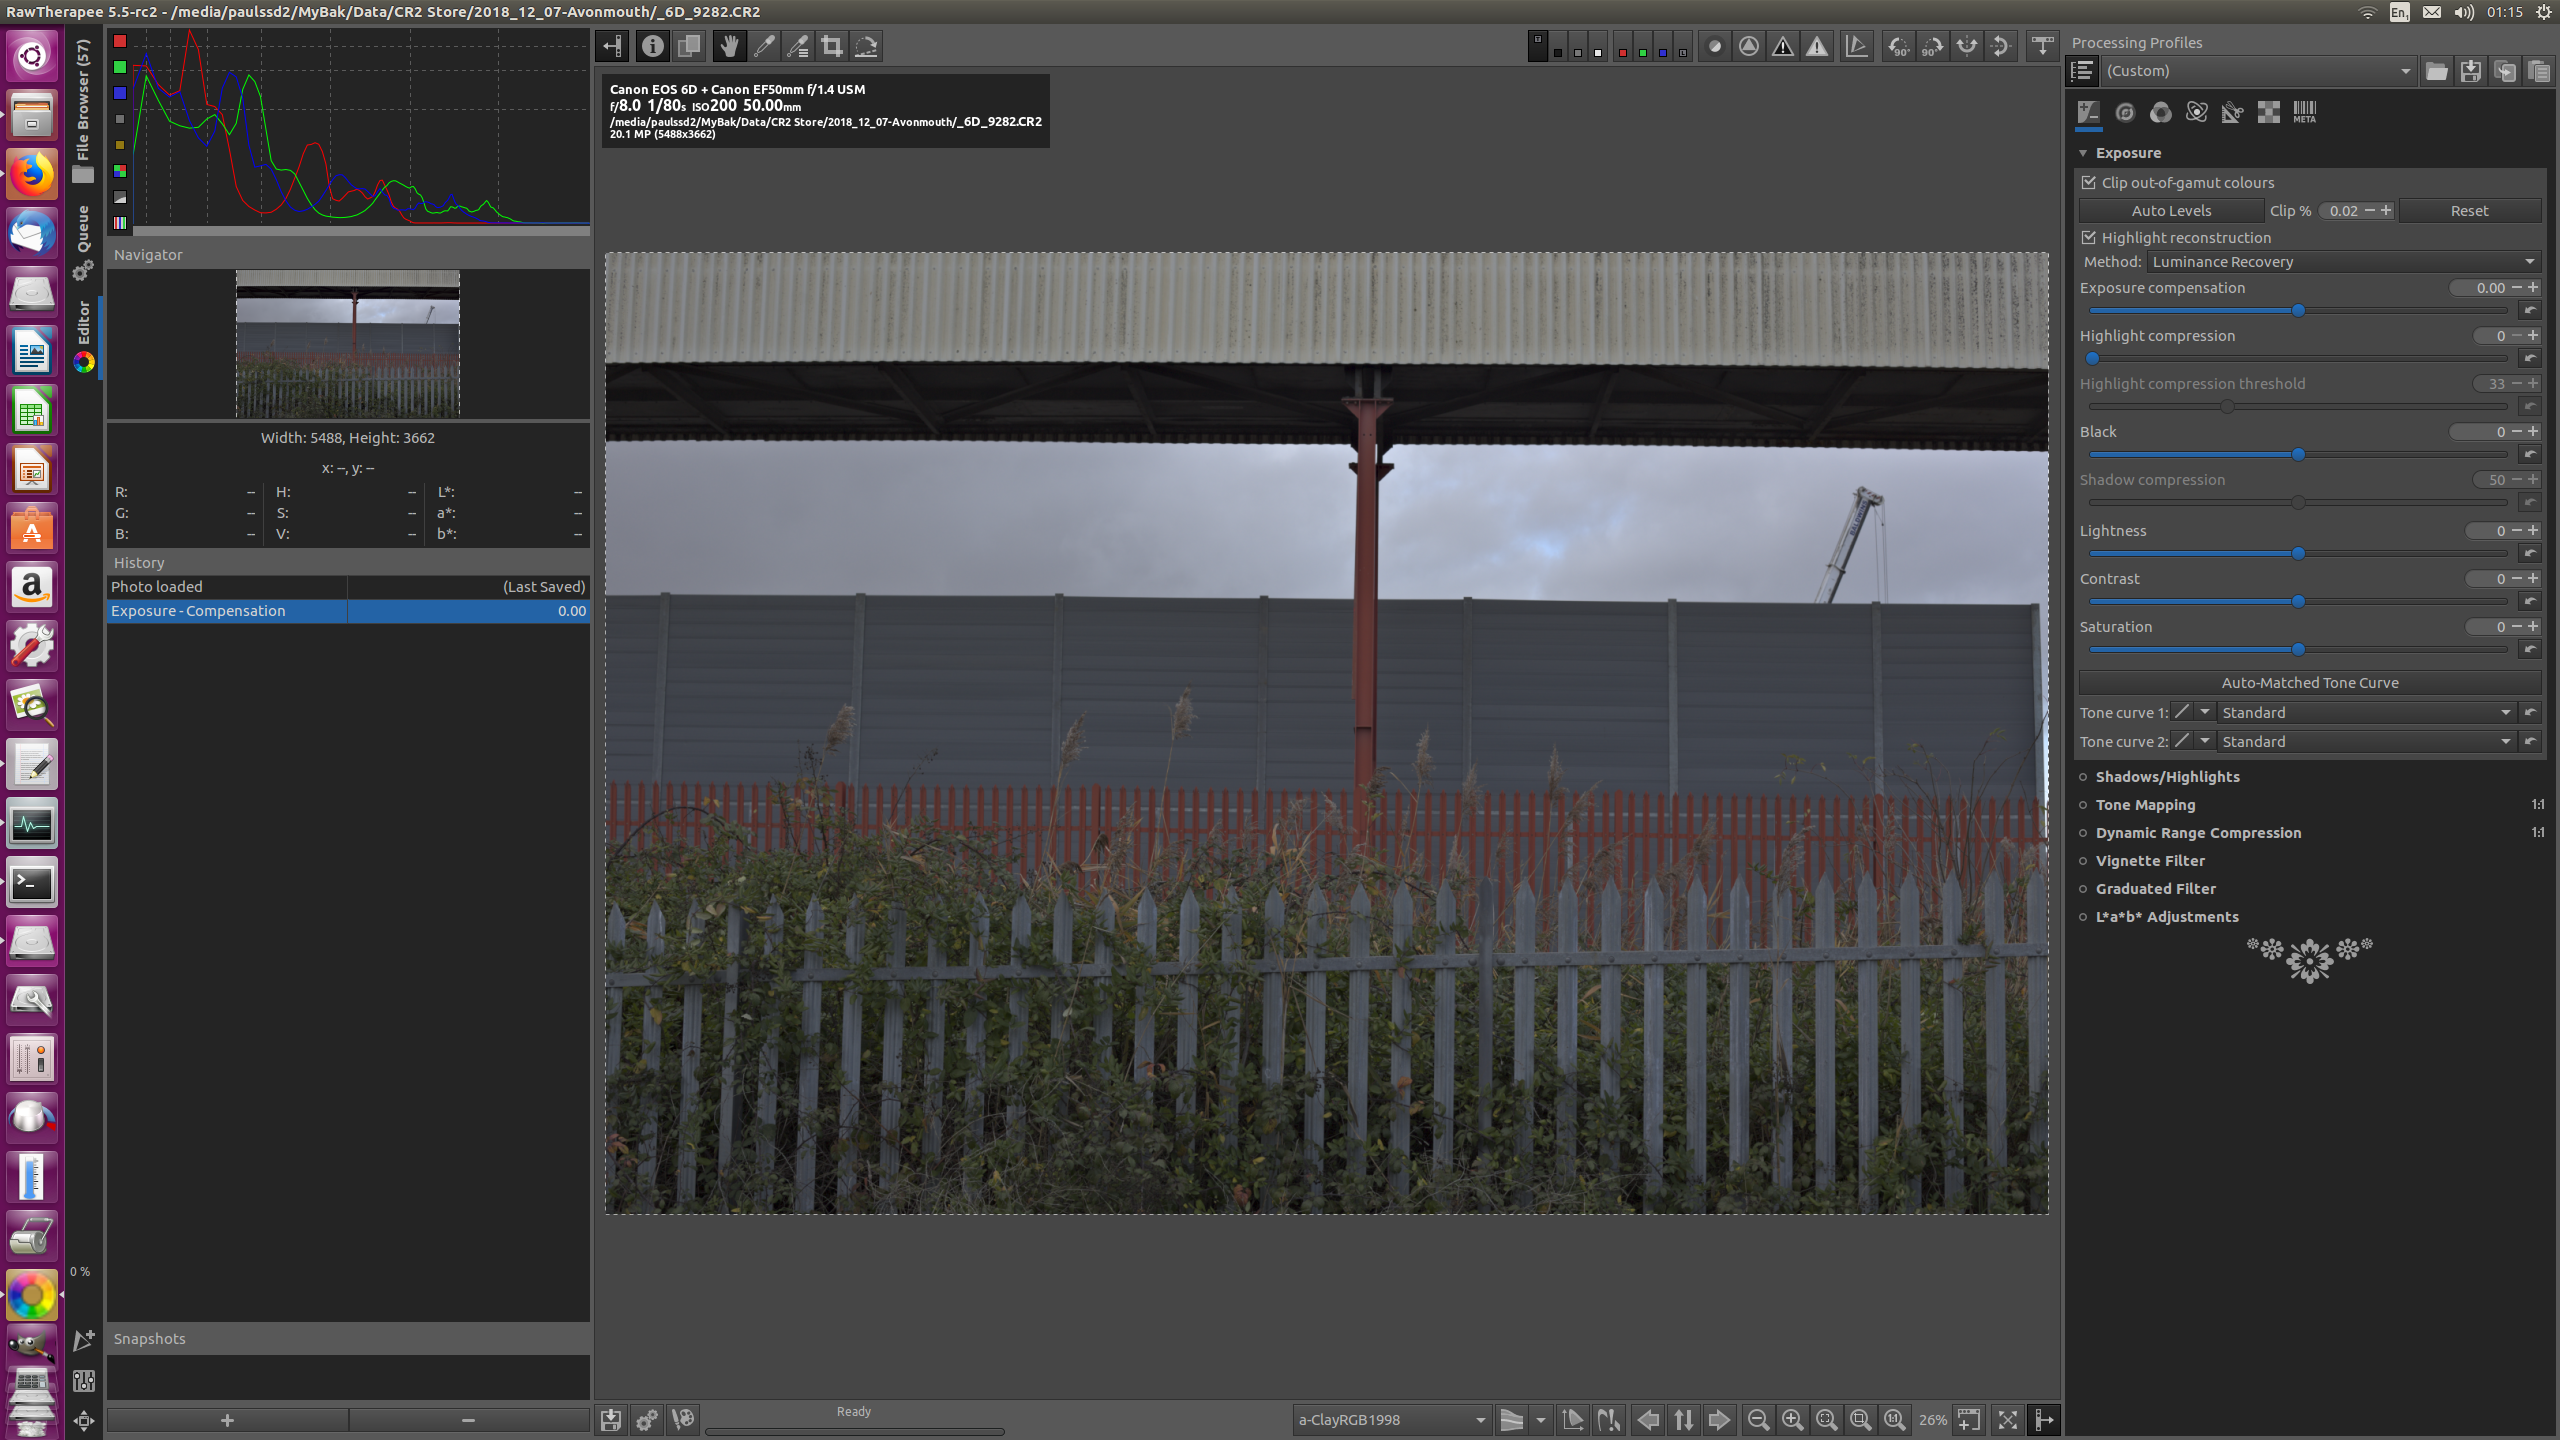
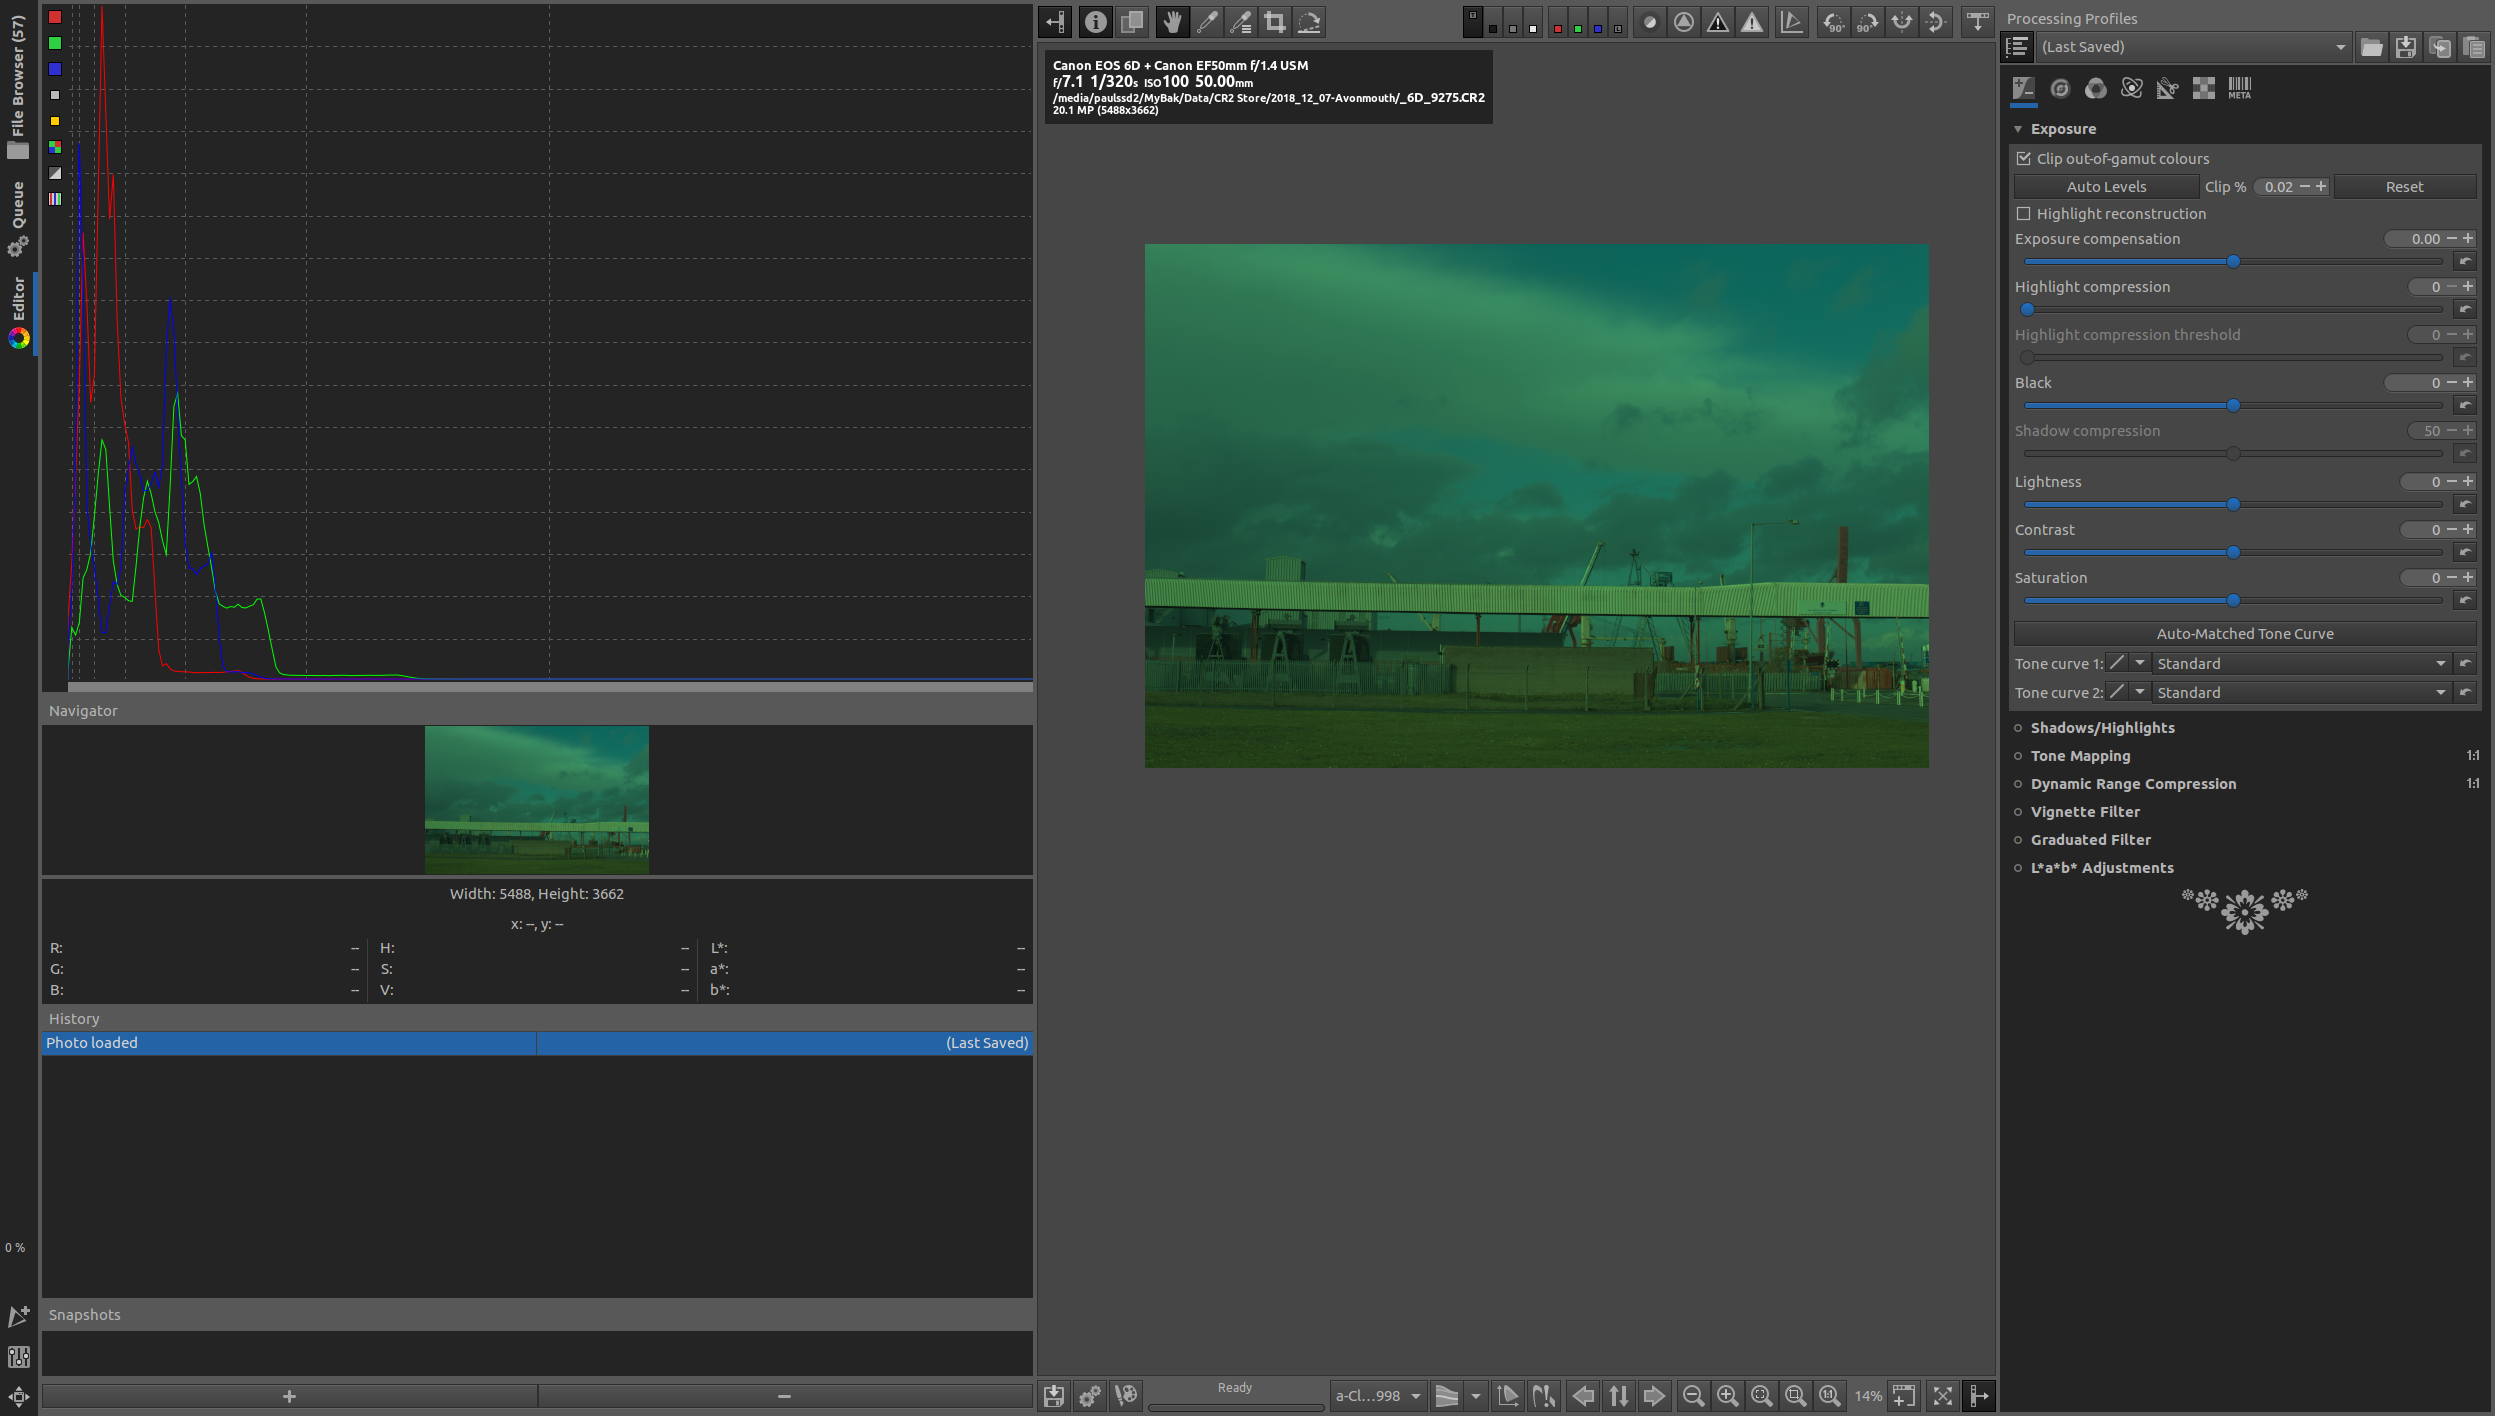
Rawtherapee: New histogram seems to tell a different story to old histogram
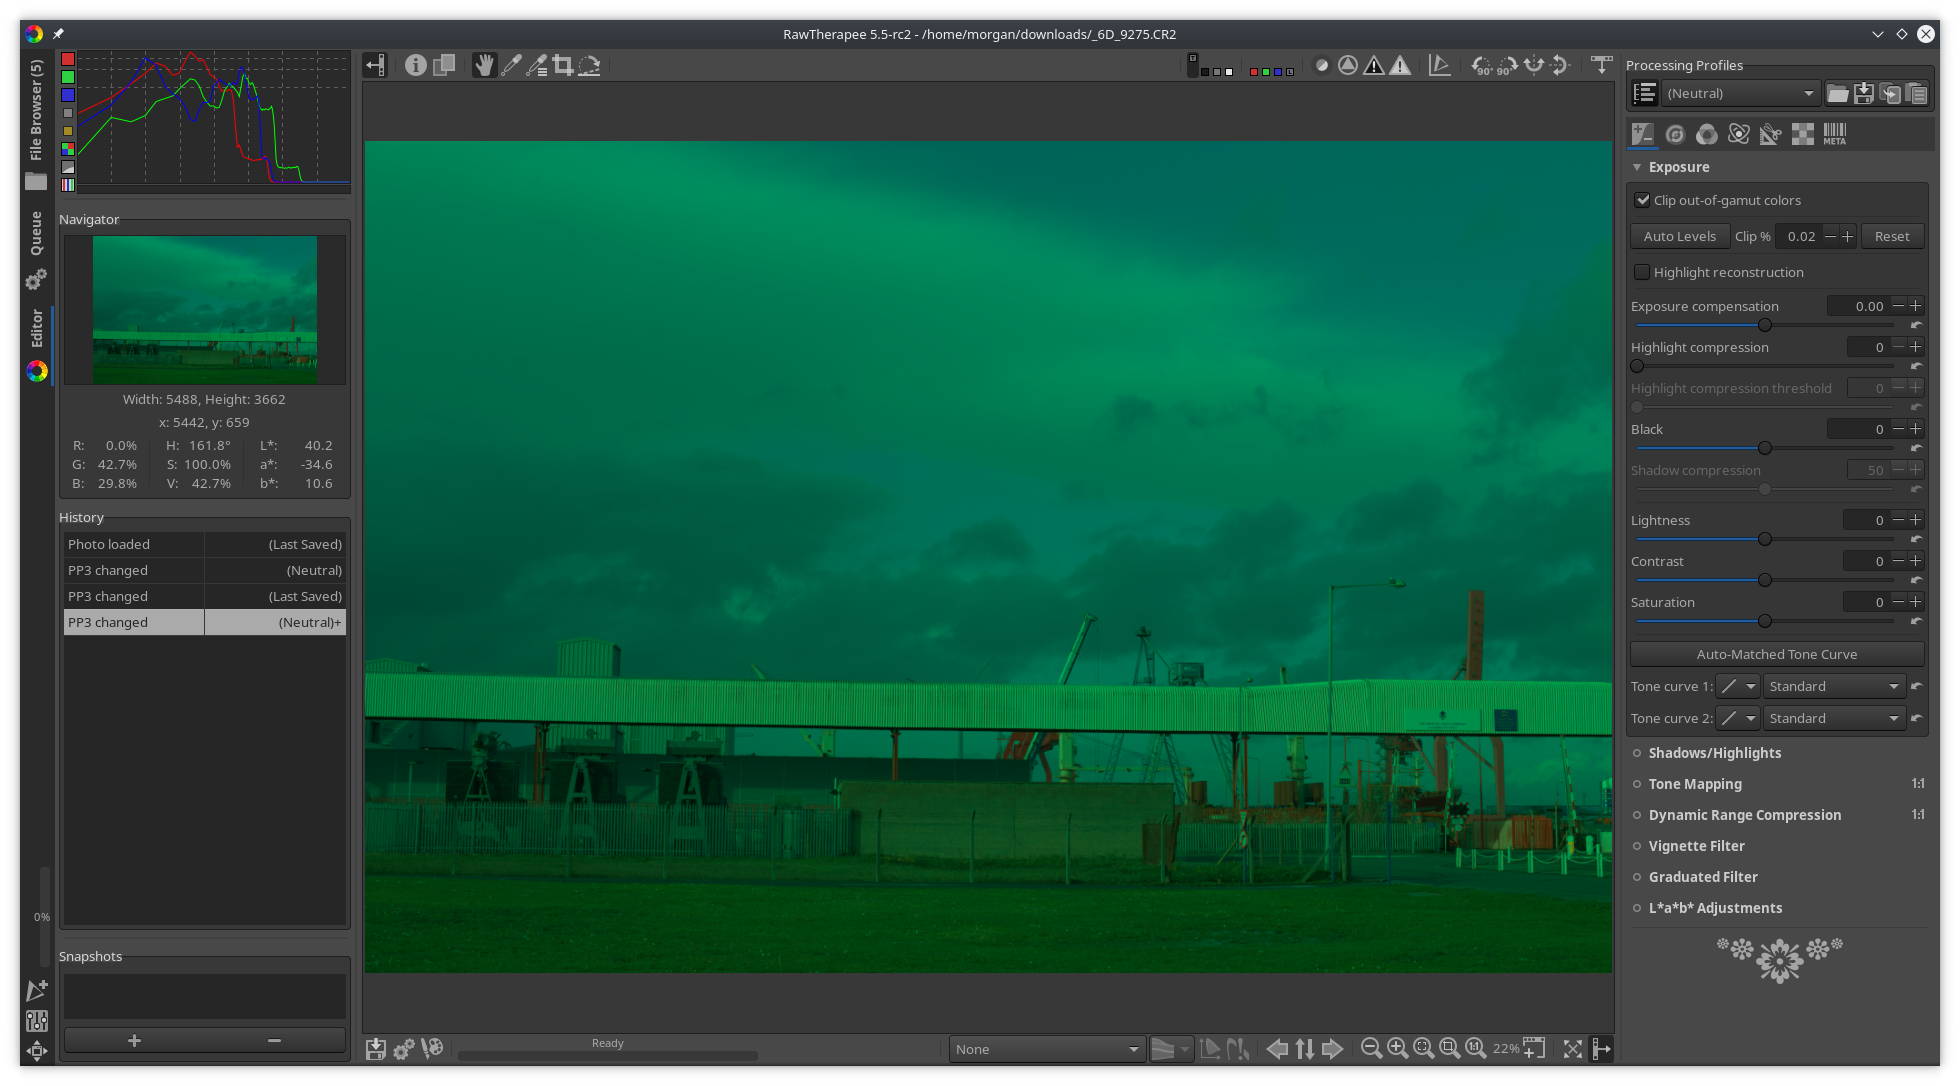
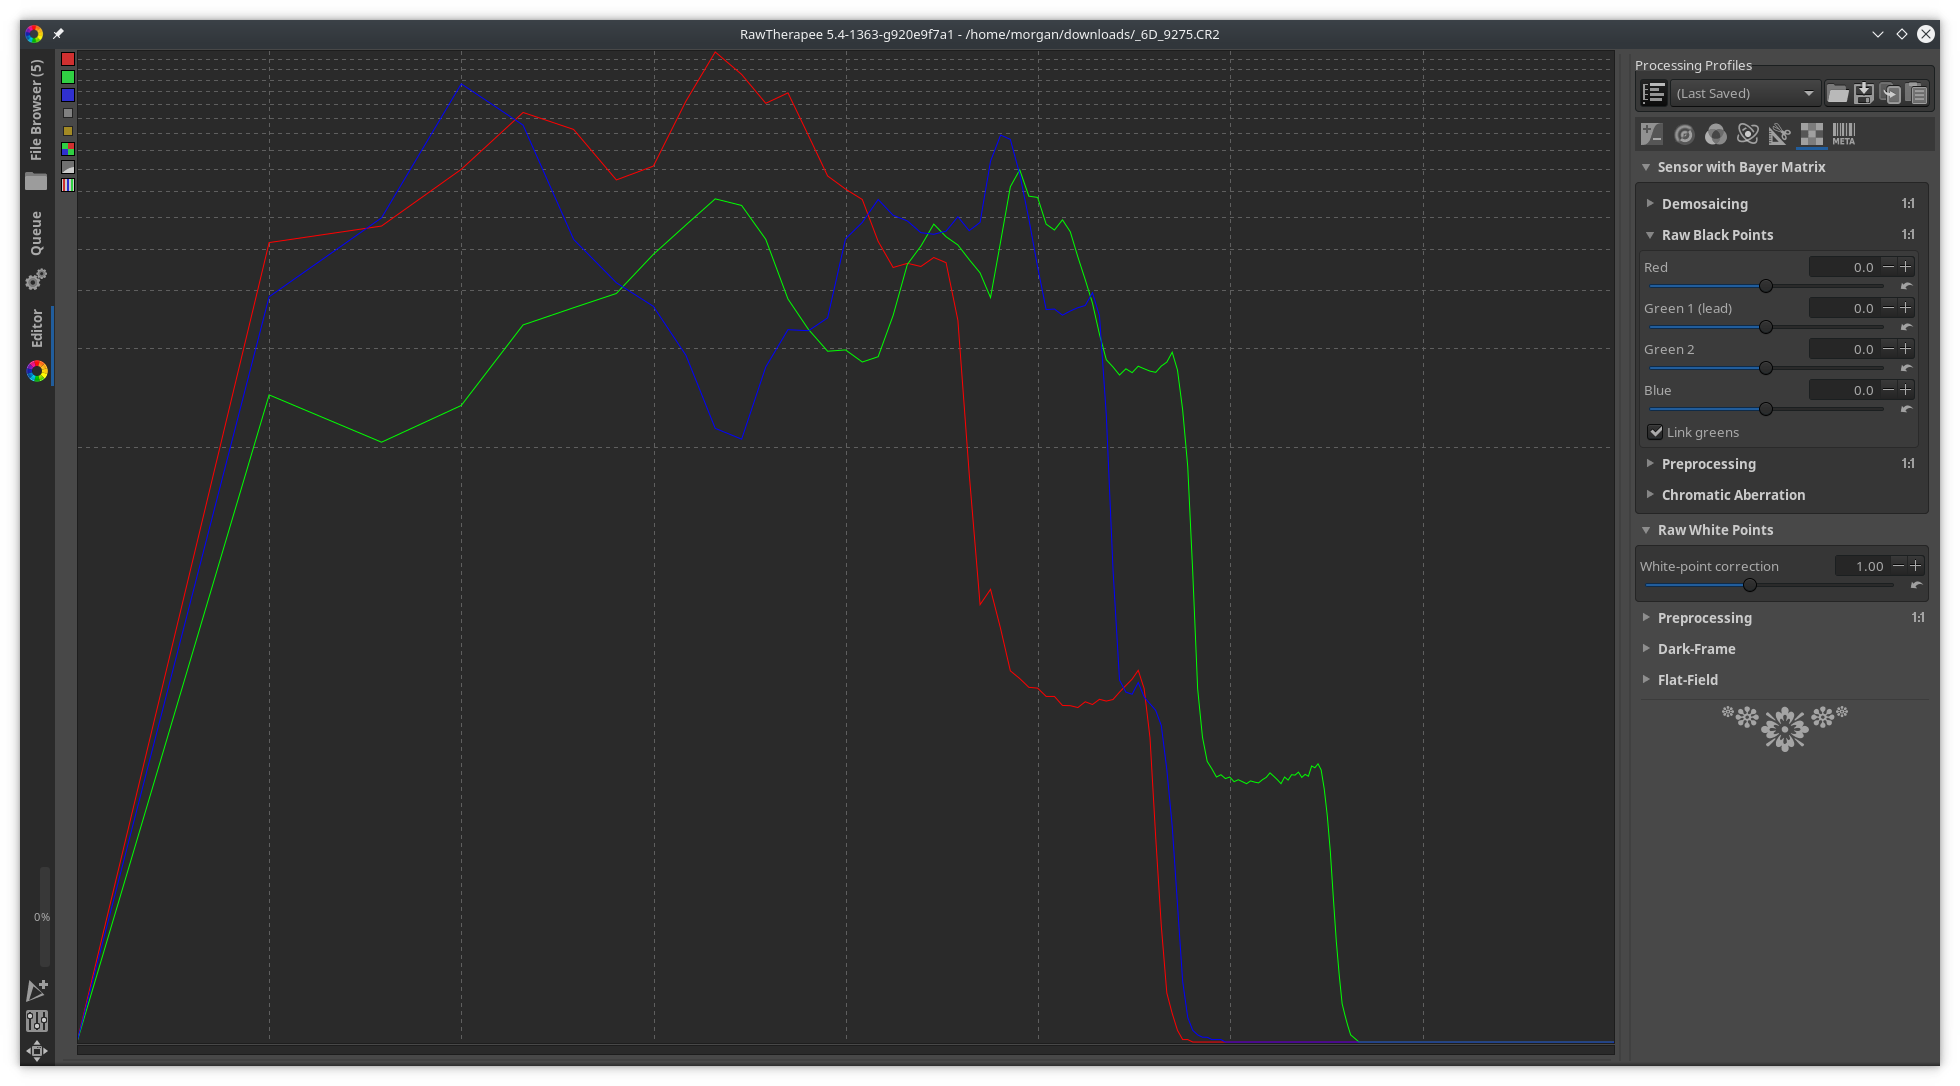
As the screenshots show, the new raw histogram suggests (at least to me) that there is appreciable shadow clipping, even though the shadow clipping indicator reveals little of this.
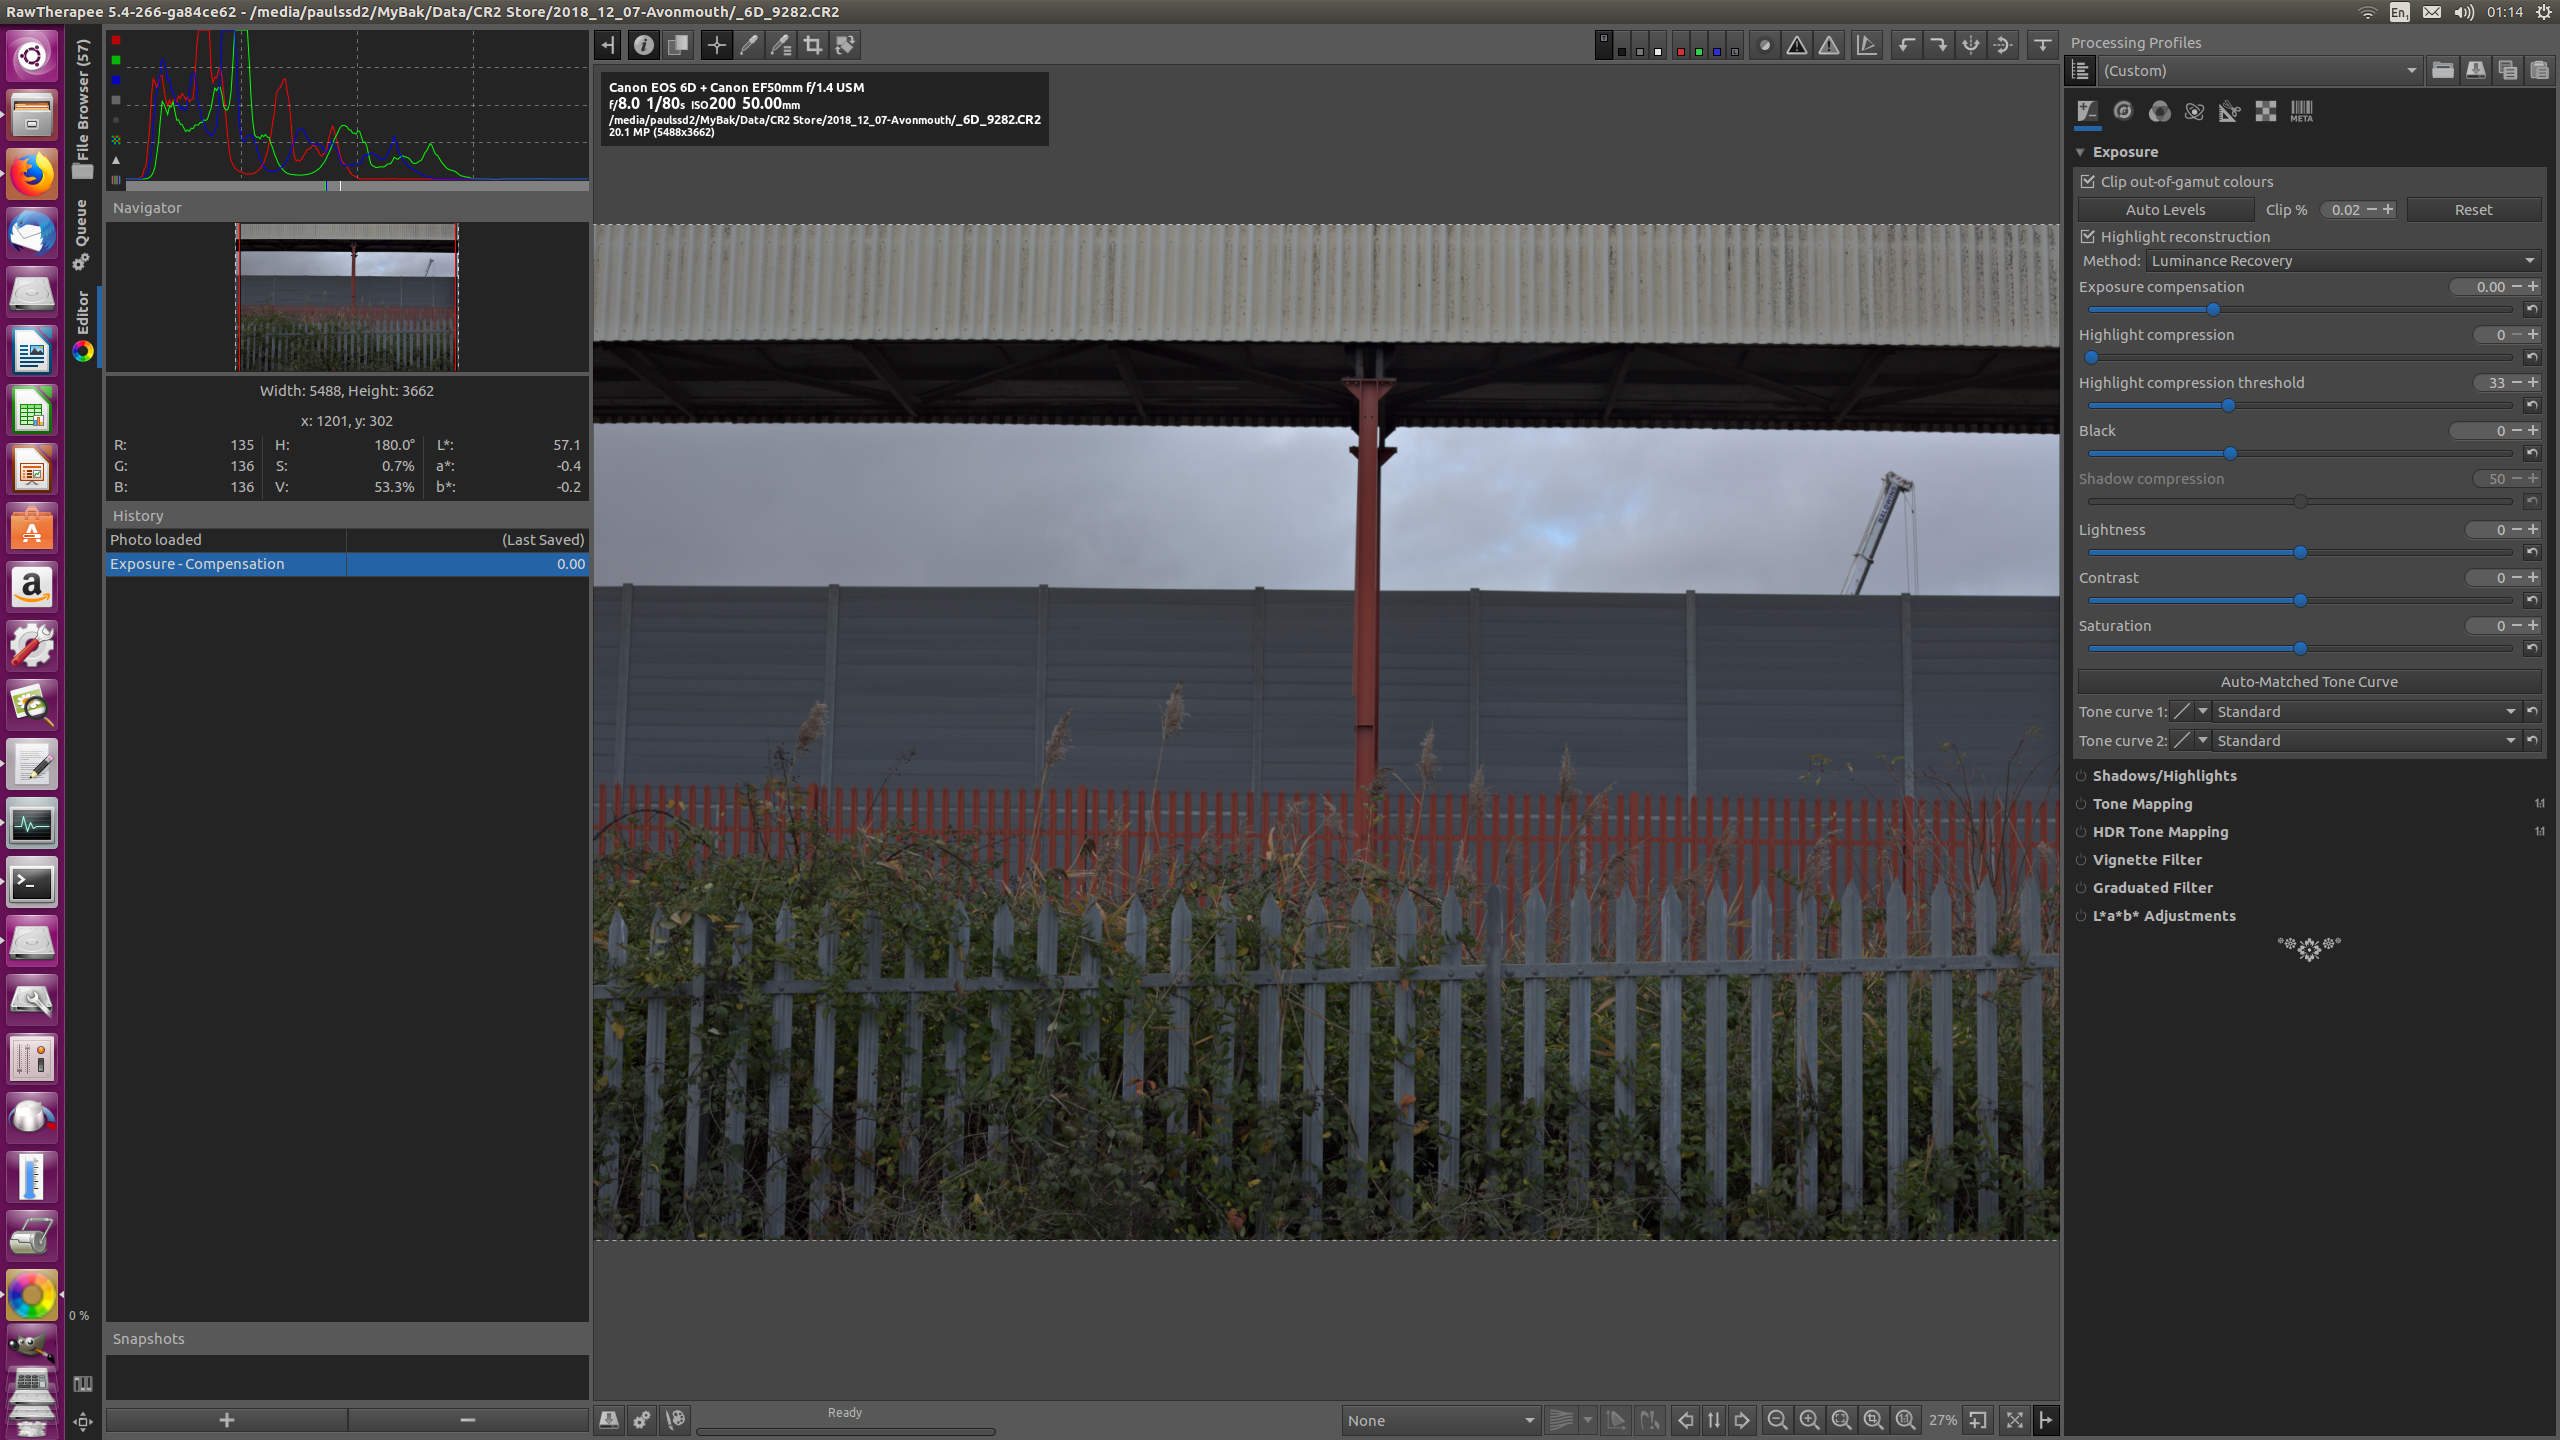
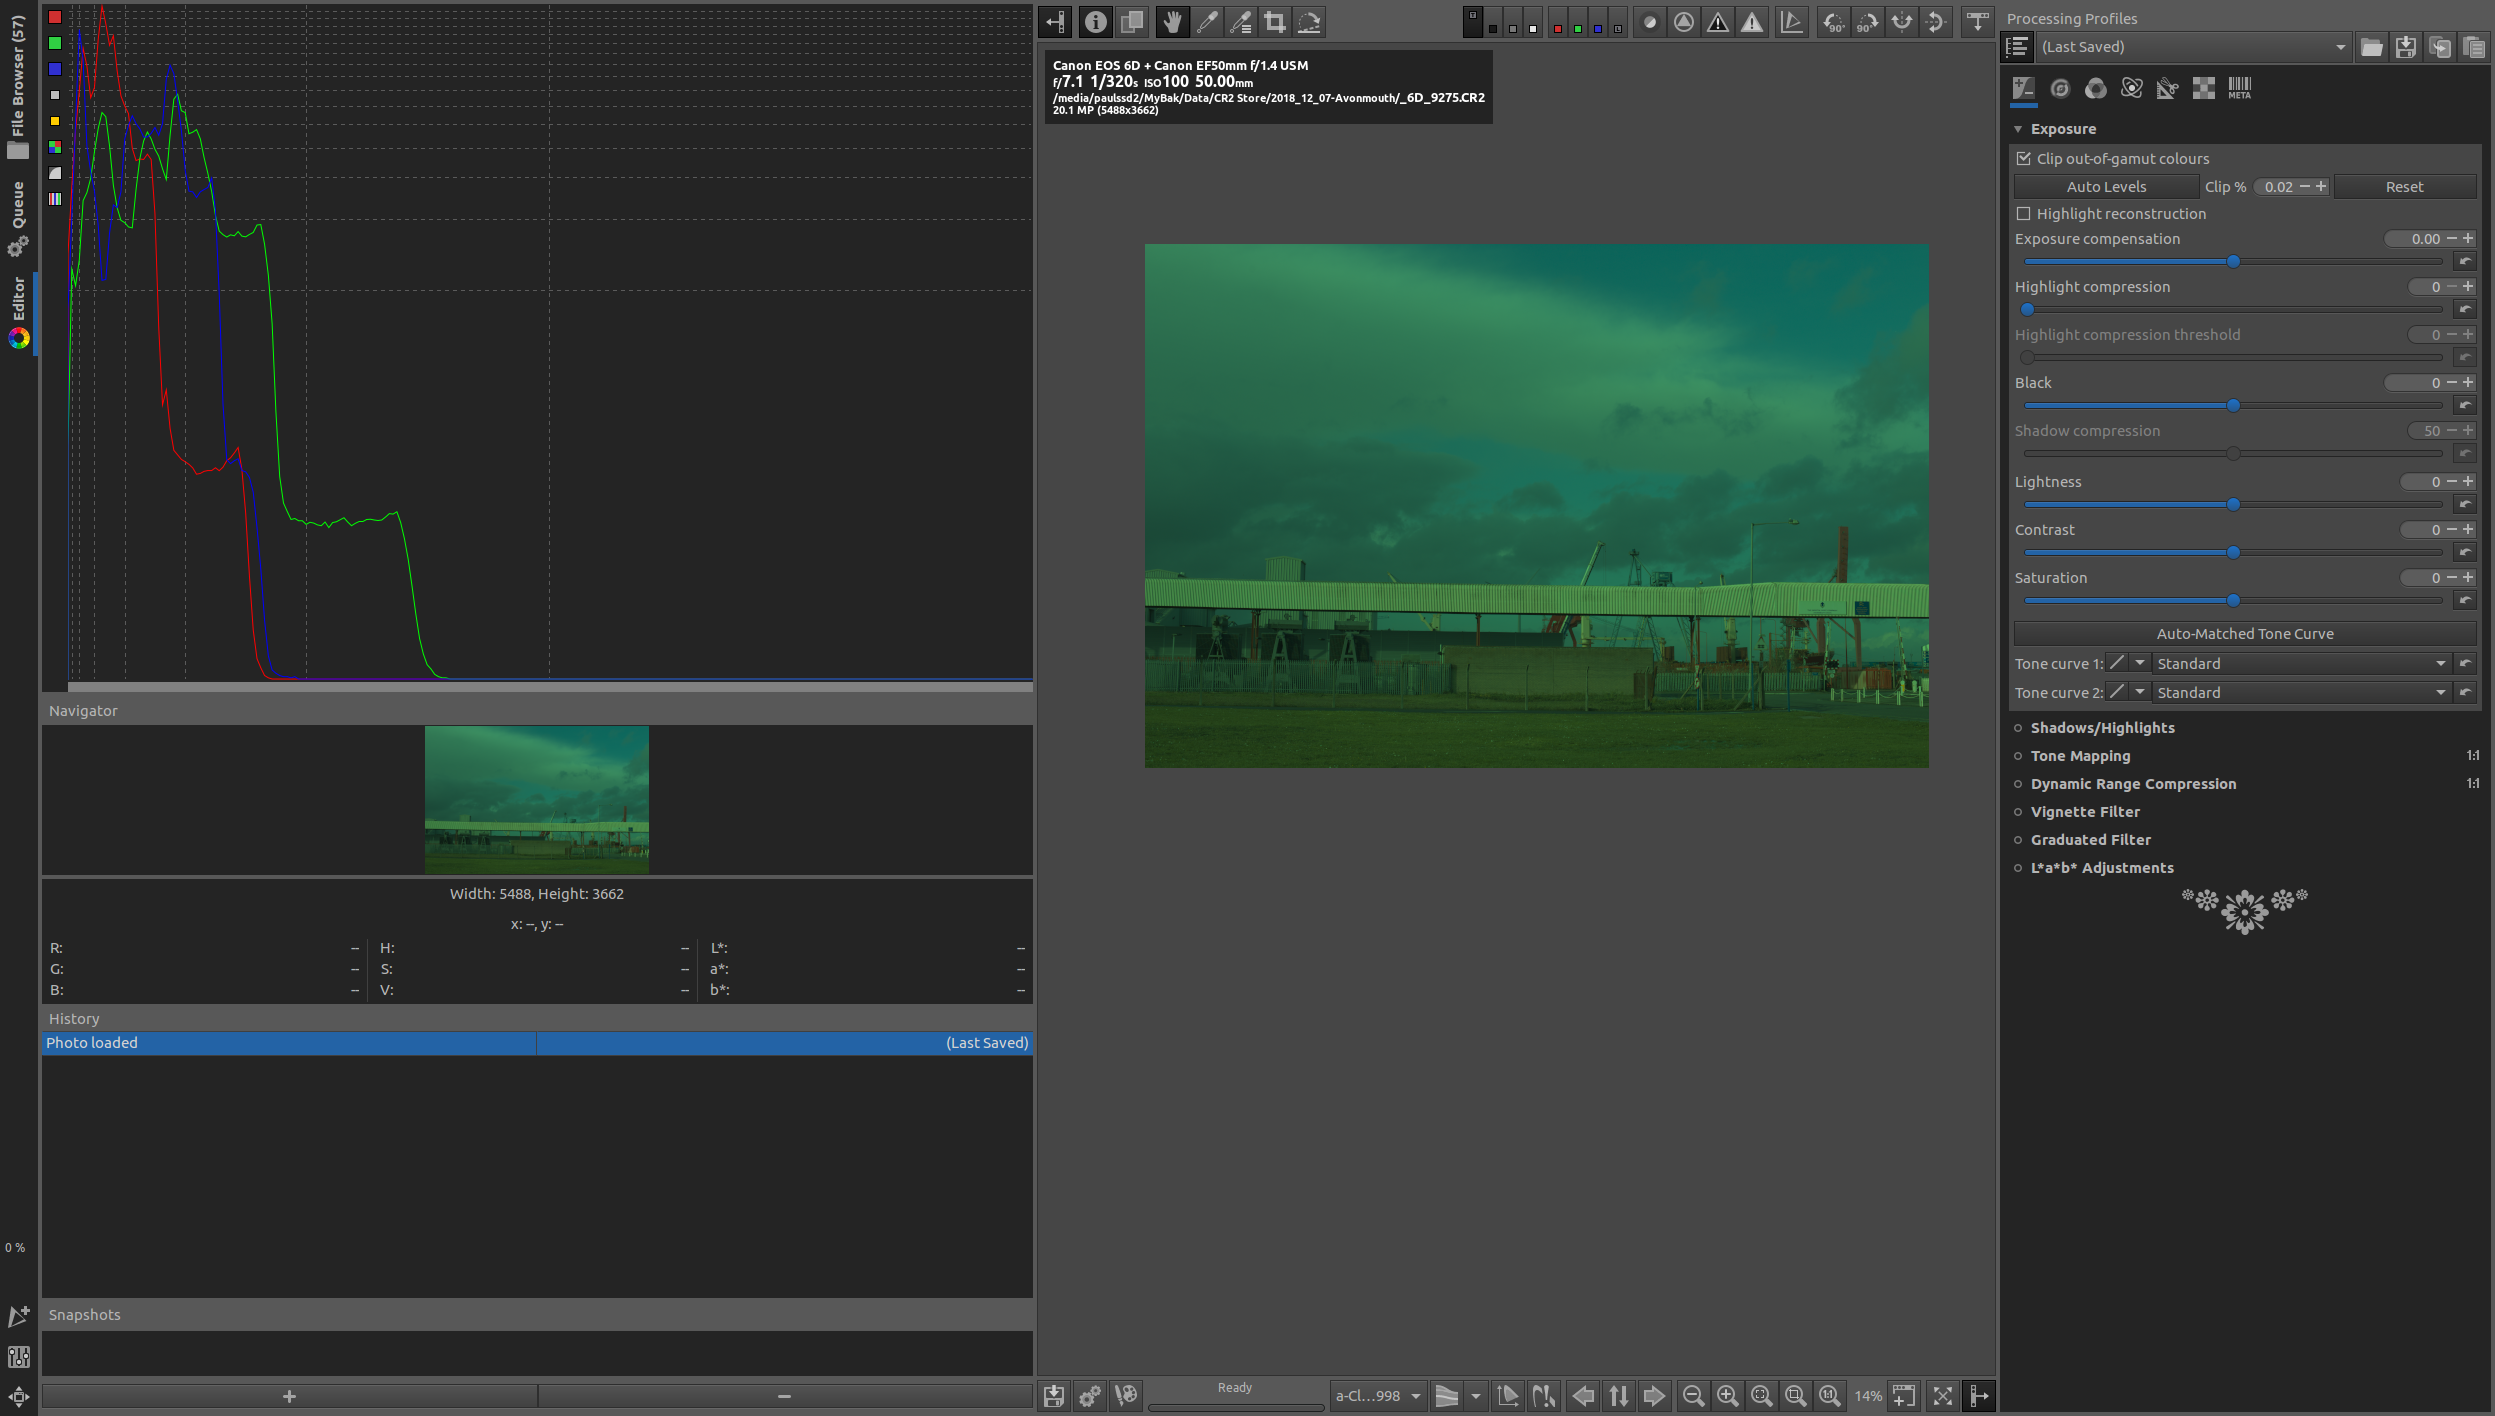
Whereas the old histogram indicates little or no shadow clipping, and seems more consistent with the fact that the clip indicator also shows little clipping.
Also the shape of the 2 histograms is somewhat different (I appreciate the old one goes "off the scale" vertically at two places)
 RawConvert
All 45 comments
You've Log-scaling of the histogram active. There are 3 modes, linear, log-linear, log-log. If log is active, it's possible to control the log-scaling by click & hold the left mouse button and move the mouse around.
RawPedia: http://rawpedia.rawtherapee.com/The_Image_Editor_Tab#Main_Histogram
To help you visualize the data, the histogram (as of RawTherapee 5.5) has three modes which scale the data in the x and y axes differently:
- Linear-linear mode. You find gridlines at halves, quarters, eighths and sixteenths, depending on the size of the histogram.
- Linear-log mode. The x-axis is linear, the y-axis and the horizontal gridlines are scaled logarithmically. The position of the gridlines still corresponds to the halves, quarters, etc.
- Log-log mode. Both the x- and y-axes are scaled logarithmically. The gridlines are not scaled logarithmically, but correspond to stops - with every gridline the value doubles, so there are lines for the values 1, 3, 7, 15, 31, 63, and 127 (pow(2.0,i) - 1)).
When there is a disproportionately bright area relative to the rest of the image, it will show up as a spike in the histogram. If you want to show this on a histogram with a linear y axis, the spike may push the lesser values down the y-axis, making them difficult to see. Switch to one of the log modes to scale the data and help you get a better overview of all values.
 TooWaBoo
on 12 Dec 2018
TooWaBoo
on 12 Dec 2018
For reference: https://github.com/Beep6581/RawTherapee/issues/4667
 heckflosse
on 12 Dec 2018
heckflosse
on 12 Dec 2018
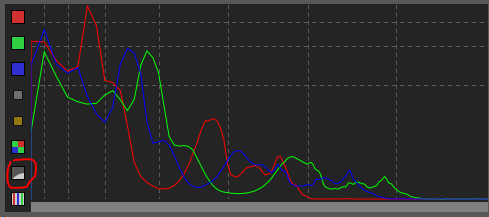
@TooWaBoo , I was aware of the modes and believe my screenshot is Linear. Note the icon state. Also I clicked the icon until the histogram was the most spread out of the 3, so that's why I say linear. So I still say it's not very consistent with the previous histogram, assuming that was linear too.
- I looked at rawpedia, it implies scaling can be turned off, but I can't see how to do this. Can it be turned off? And if so, why is that needed given there is still the linear mode? Does Rawpedia need updating?
- I tried dragging the histogram. This works a bit weirdly. Eg in one click-hold action, you drag to the right, it moves, you reverse direction, but the histogram keeps going in the same direction!
@Beep6581 , there are still some outstanding points here!
RawConvert
on 12 Dec 2018
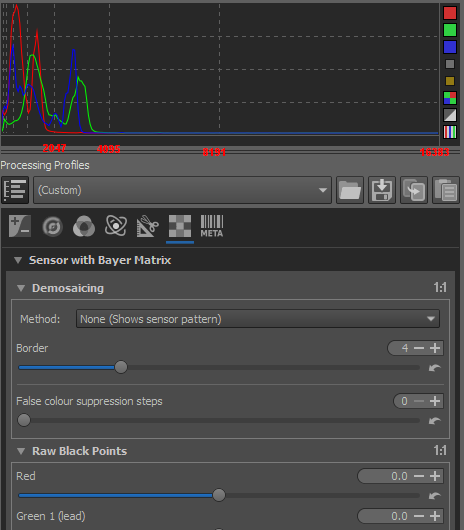
Just had another look. Ah. So I guess linear is the 45 degree icon, not the most spaced out histogram. That's the one that can't be dragged. Well I still don't like this! The linear one is all crushed up to the left, nothing like the old histogram. How do I get something like the old one? - this seems to make most sense to me.
RawConvert
on 12 Dec 2018
@RawConvert have a look at #4667 . The old raw histogram simply was wrong
heckflosse
on 12 Dec 2018
believe my screenshot is Linear. Note the icon state.
The icon state shows it's not linear but log-log.
 Beep6581
on 12 Dec 2018
Beep6581
on 12 Dec 2018
@heckflosse , thanks, so the old was wrong, but I am still confused.
Also @TooWaBoo & @Beep6581 -
- Rawpedia says "Linear-linear mode. You find gridlines at halves, quarters, eighths and sixteenths, depending on the size of the histogram" and the third pic there shows half and quarters. But it's not that simple. You only get evenly spaced vertical lines if you use the icon on my top picture - log-log you say @Beep6581 - AND drag fully to the right. Then you have 8 sections, 8 stops rawpedia says. But surely the sensor covers more than 8 stops?
- As above, can the scaling icon be turned off?
- The previous histogram may have been incorrect but at least it tailed off at both ends. I just don't know what the new ones are doing. I think it's bad that it seems to just end abruptly at the left side for the several photos I've tried which I don't think are under exposed. For a raw histogram, there's the black point for the sensor at say 30. And the maximum sensor value achievable at say 12,000. Why can't there be a simple histogram which shows 0 - max (eg 16384) with "camera stops" shown. Surely "max" is known from the camera database.
- I think this new histogram functionality is pretty confusing and complicated, and maybe over the top!
RawConvert
on 12 Dec 2018
@RawConvert
which I don't think are under exposed
Please provide an example using filebin.net
heckflosse
on 12 Dec 2018
@RawConvert
Example for a file with a white level of 16383
looks linear to me
heckflosse
on 12 Dec 2018
@heckflosse , re. the above pic, yes with the numbers inserted it's linear with respect to stops. But it's all to the left therefore, and so not very convenient. When you say a white level of 16383, I'm unsure, perhaps just terminology. I'm thinking the sensor output bit width means the max possible is 2 to the 14 minus 1 = 13383. Whereas the white point might typically be around 13,000 and these are the values in camconst. And it's this value which can be effectively modified by the "Raw White Points" adjuster in the raw tool.
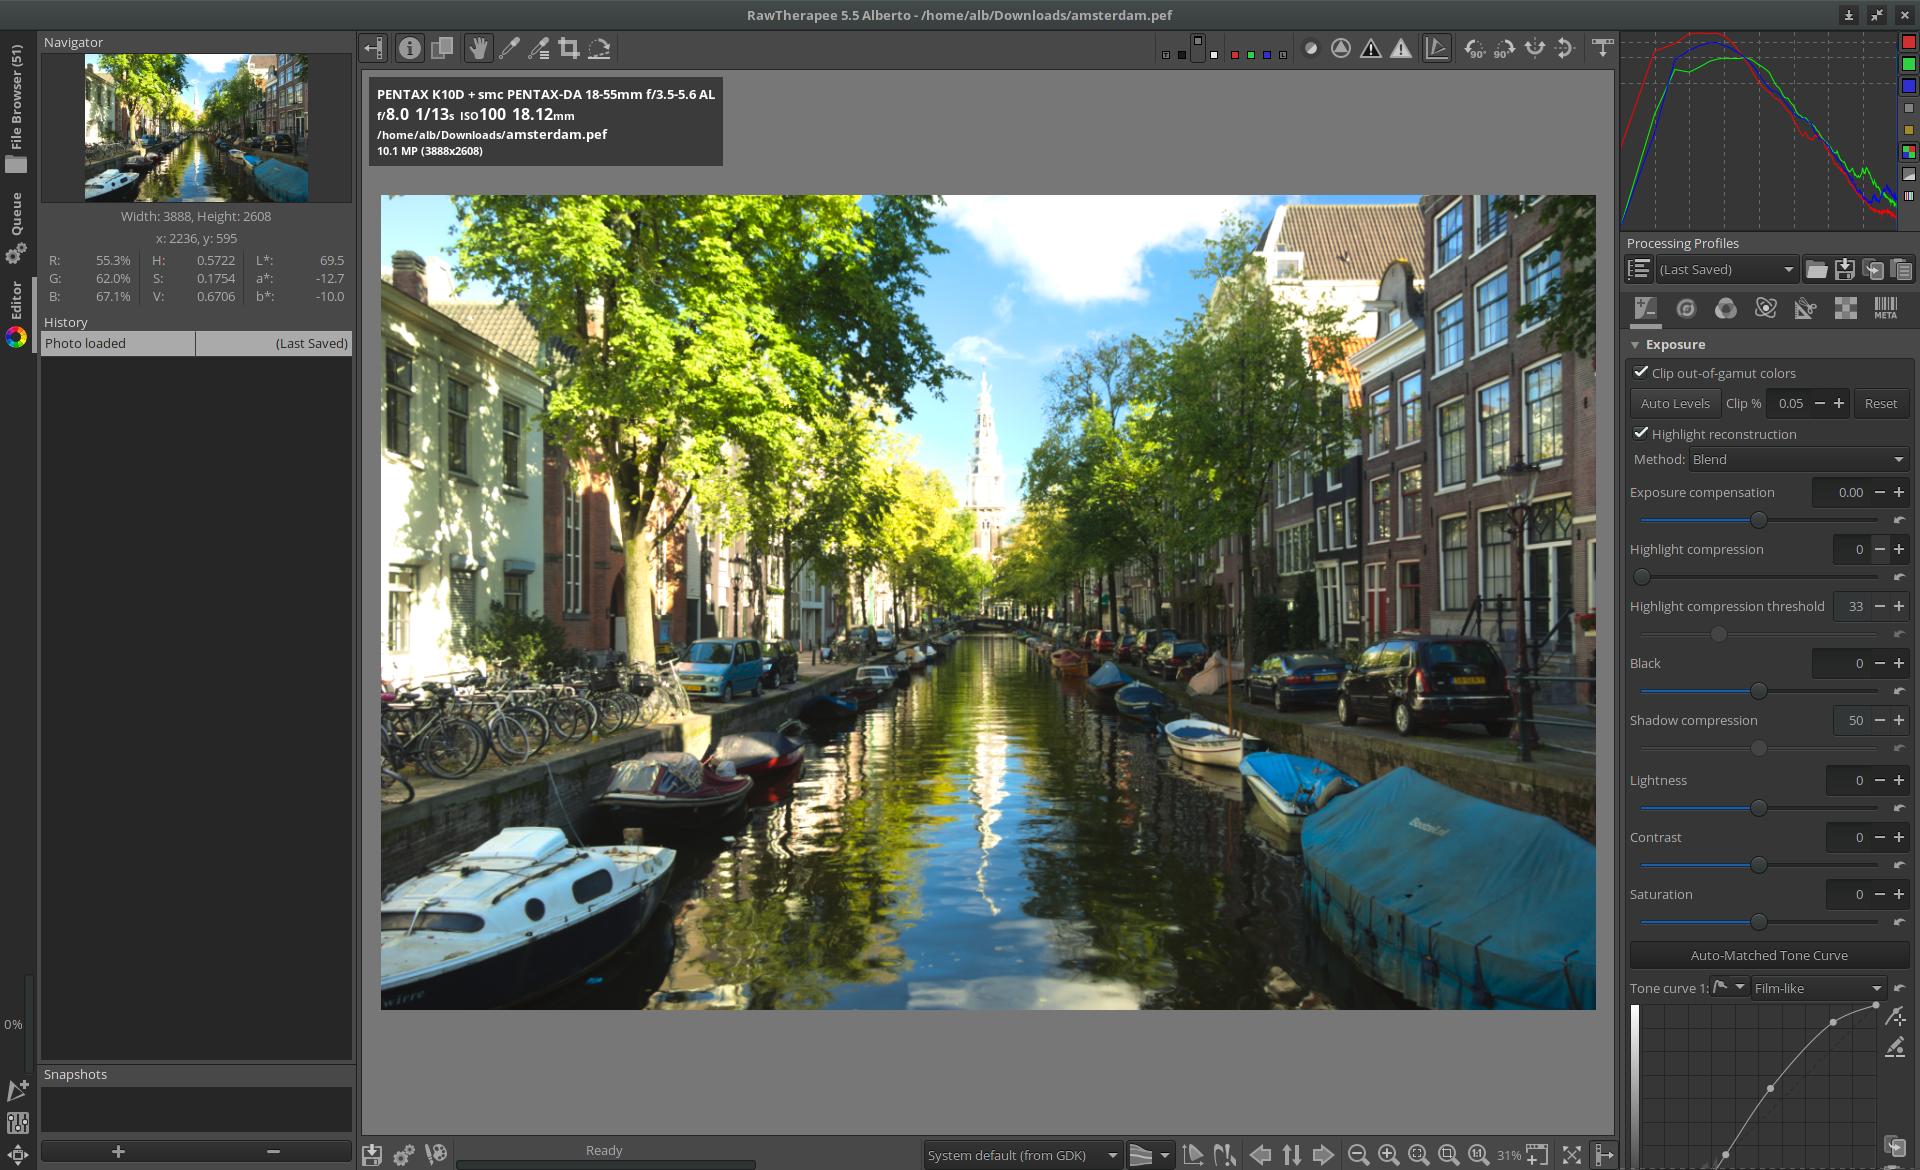
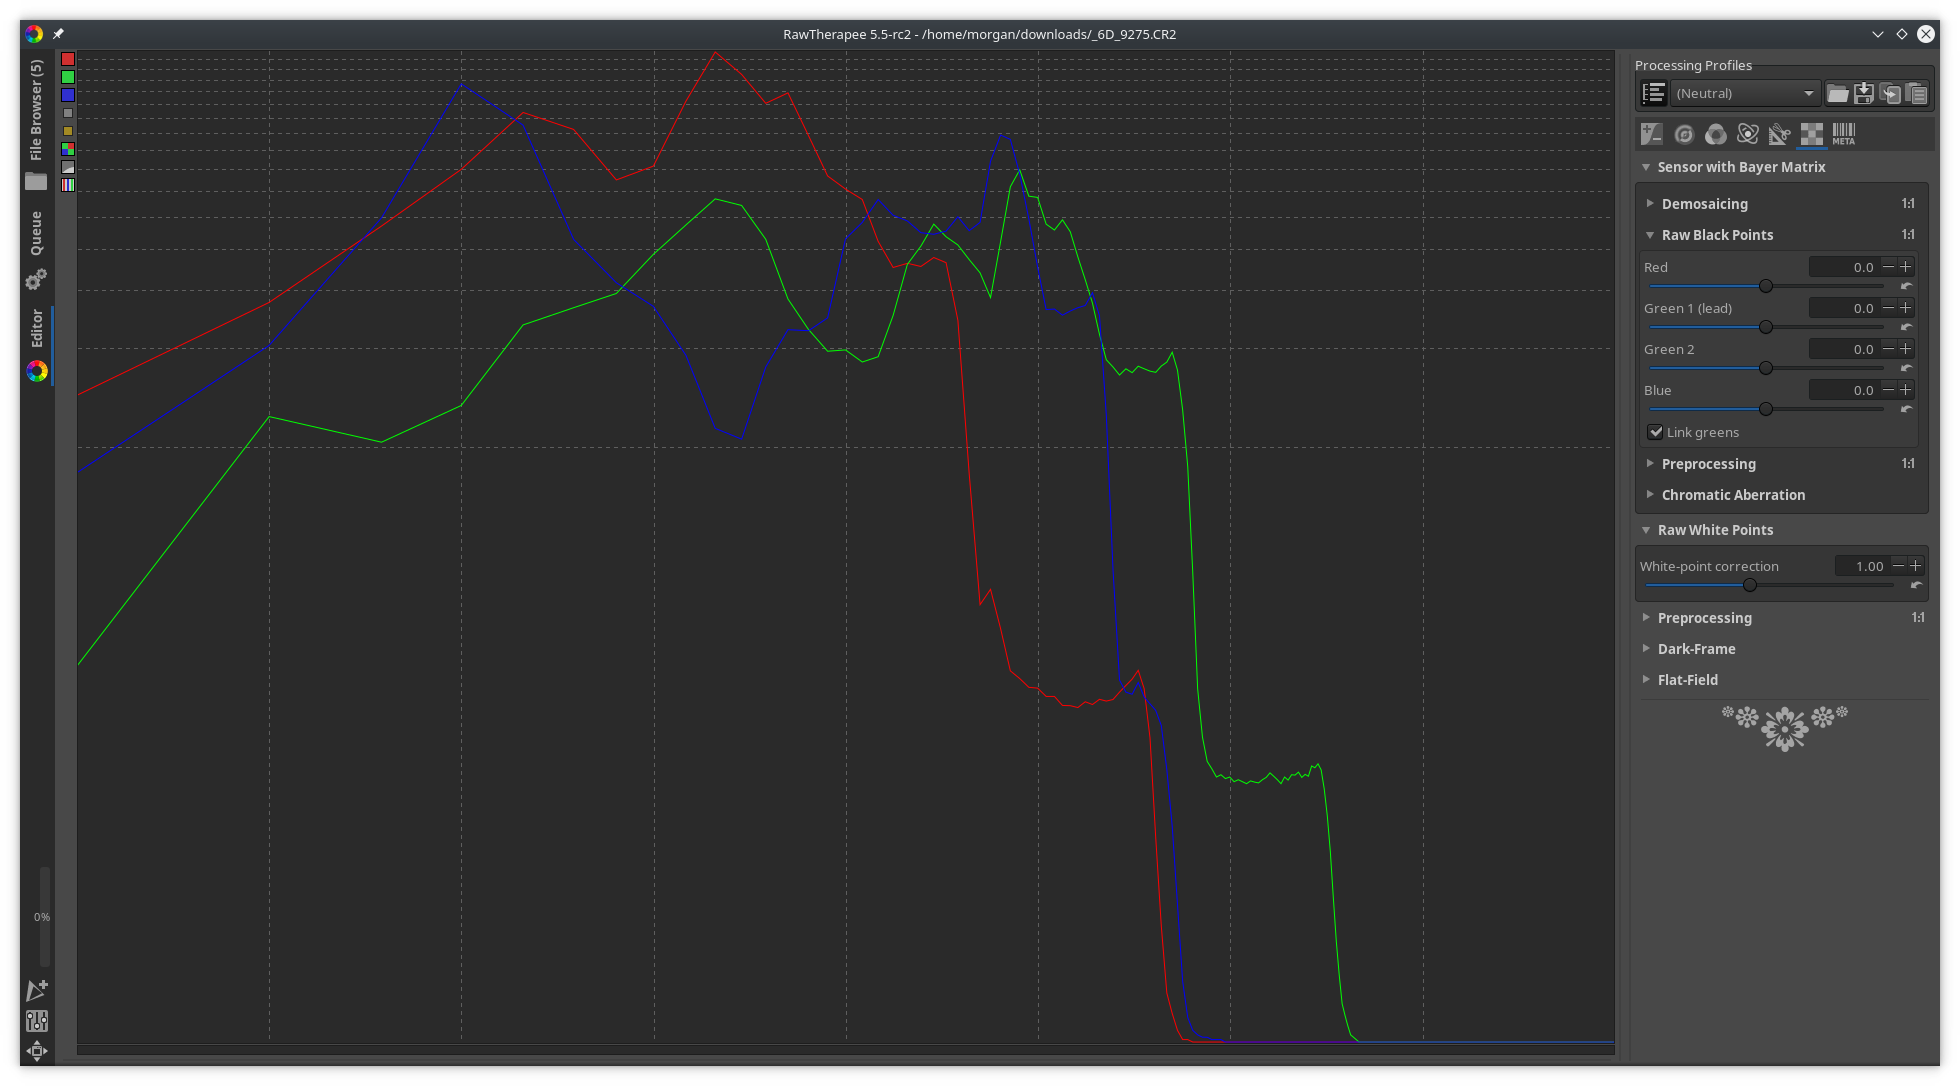
As requested here's a raw with little or no shadow clipping.
https://filebin.net/omgrlez4uctxtcj8
I say "little or no" because with a neutral profile and a sensitive clip setting (1 in preferences), I can't see any highlighting. Here are the three histograms -
a) Linear - as above, too squashed to the left and can't be dragged
b) Log-Log - dragged right to fill the space available, but at the left, seems to imply appreciable shadow clipping.
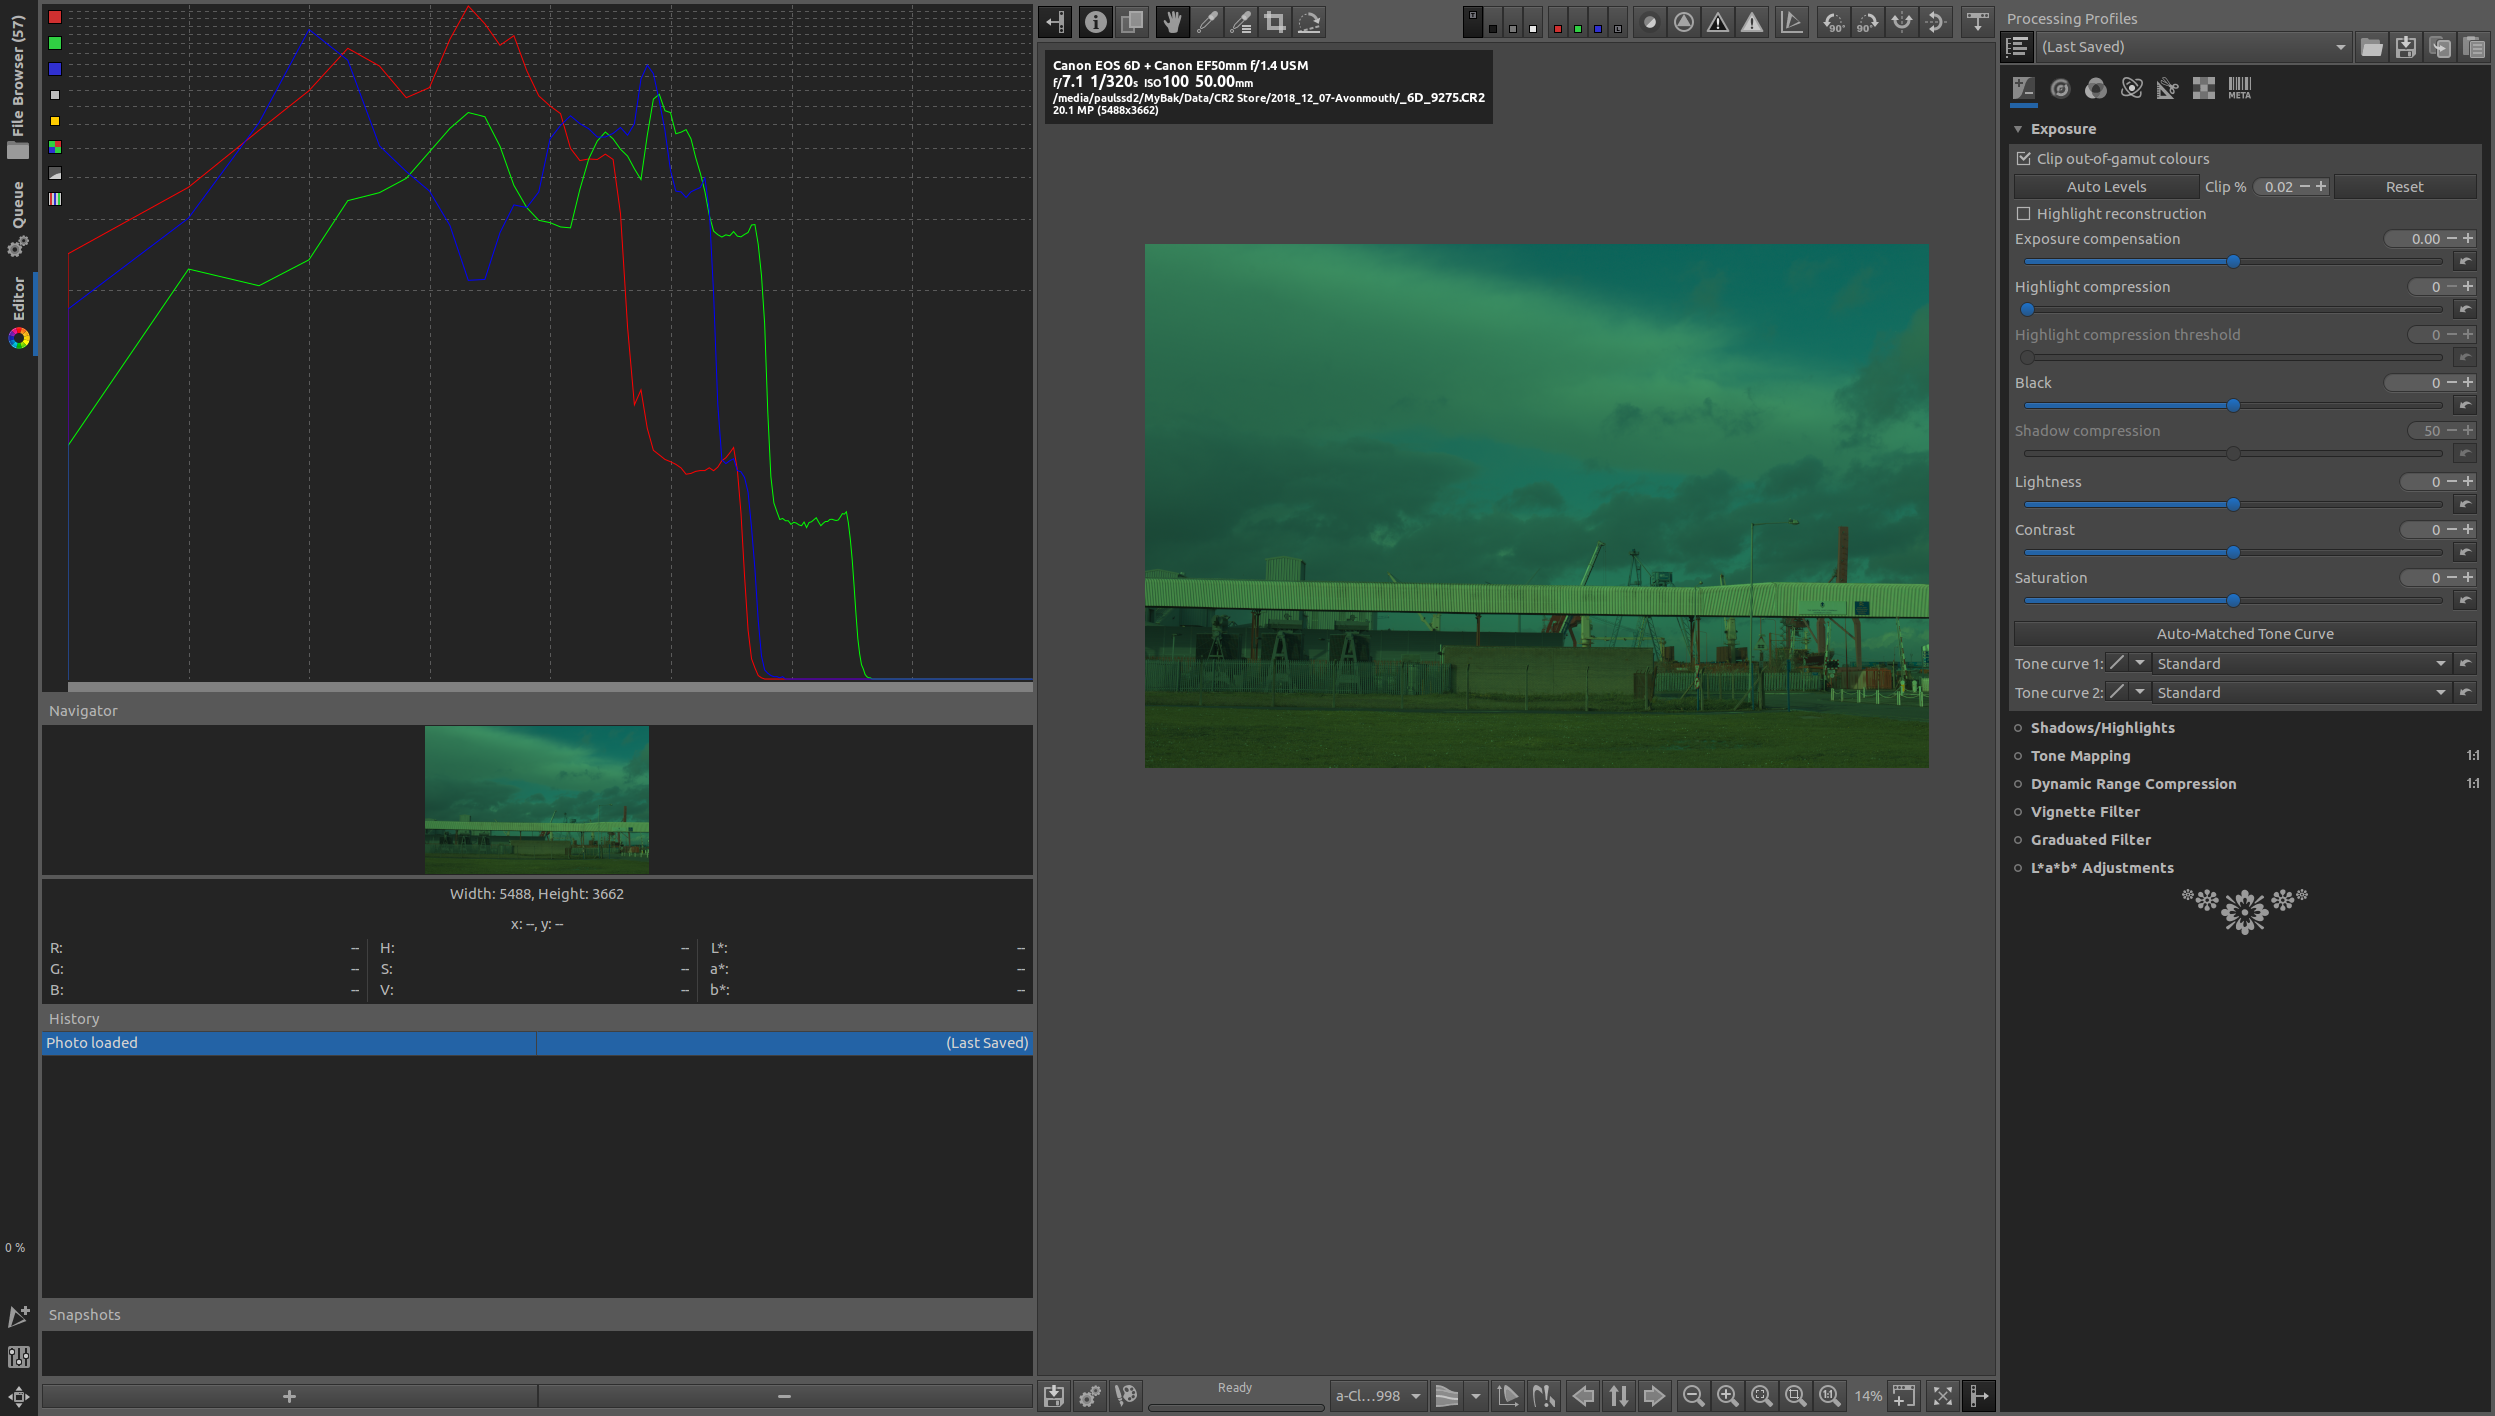
c) Log-Linear - Y-axis can be dragged but not X, so it's still to much to the left.
What would be good is a default setting which for a decently exposed image would fill say 3/4 of the histogram width, and it would more closely represent a "human view" of the data, and in particular, not exaggerate the deep shadows, which is what I suspect is happening.
RawConvert
on 12 Dec 2018
I think there's a rounding problem when compressing the histogram to 256 entries. Here's a patch to fix it:
diff --git a/rtengine/rawimagesource.cc b/rtengine/rawimagesource.cc
--- a/rtengine/rawimagesource.cc
+++ b/rtengine/rawimagesource.cc
@@ -4835,19 +4835,19 @@
     } // end of parallel region

     for(int i = 0; i < histoSize; i++) {
-        int idx = std::min(255.f, mult[0] * std::max(0.f, i - cblacksom[0]));
+        int idx = std::min(255.f, mult[0] * std::max(0.f, i - cblacksom[0]) + 0.5f);
         histRedRaw[idx] += hist[0][i];

         if (ri->get_colors() > 1) {
-            idx = std::min(255.f, mult[1] * std::max(0.f, i - cblacksom[1]));
+            idx = std::min(255.f, mult[1] * std::max(0.f, i - cblacksom[1]) + 0.5f);
             histGreenRaw[idx] += hist[1][i];

             if (fourColours) {
-                idx = std::min(255.f, mult[3] * std::max(0.f, i - cblacksom[3]));
+                idx = std::min(255.f, mult[3] * std::max(0.f, i - cblacksom[3]) + 0.5f);
                 histGreenRaw[idx] += hist[3][i];
             }

-            idx = std::min(255.f, mult[2] * std::max(0.f, i - cblacksom[2]));
+            idx = std::min(255.f, mult[2] * std::max(0.f, i - cblacksom[2]) + 0.5f);
             histBlueRaw[idx] += hist[2][i];
         }
     }
before:
after:
 agriggio
on 12 Dec 2018
agriggio
on 12 Dec 2018
Actually, it might be even better to use std::ceil in this case, to make sure that only "real" zeros go to zero...
agriggio
on 12 Dec 2018
Since this was my modification, I agree with the patch by @agriggio :-)
 Thanatomanic
on 12 Dec 2018
Thanatomanic
on 12 Dec 2018
For reference:
Beep6581
on 12 Dec 2018
heckflosse
on 12 Dec 2018
Yes sorry I did mean 16383, typo!
@Beep6581 , what do these mean in summary?! Red channel a little bit clipped?
RawConvert
on 12 Dec 2018
@agriggio , that's good news, thanks.
RawConvert
on 12 Dec 2018
Here's a better patch:
diff --git a/rtengine/rawimagesource.cc b/rtengine/rawimagesource.cc
--- a/rtengine/rawimagesource.cc
+++ b/rtengine/rawimagesource.cc
@@ -4834,20 +4834,27 @@
         } // end of critical region
     } // end of parallel region

+    const auto getidx =
+        [&](int c, int i) -> int
+        {
+            float f = mult[c] * std::max(0.f, i - cblacksom[c]);
+            return f > 0.f ? (f < 1.f ? 1 : std::min(int(f), 255)) : 0;
+        };
+
     for(int i = 0; i < histoSize; i++) {
-        int idx = std::min(255.f, mult[0] * std::max(0.f, i - cblacksom[0]));
+        int idx = getidx(0, i);
         histRedRaw[idx] += hist[0][i];

         if (ri->get_colors() > 1) {
-            idx = std::min(255.f, mult[1] * std::max(0.f, i - cblacksom[1]));
+            idx = getidx(1, i);
             histGreenRaw[idx] += hist[1][i];

             if (fourColours) {
-                idx = std::min(255.f, mult[3] * std::max(0.f, i - cblacksom[3]));
+                idx = getidx(3, i);
                 histGreenRaw[idx] += hist[3][i];
             }

-            idx = std::min(255.f, mult[2] * std::max(0.f, i - cblacksom[2]));
+            idx = getidx(2, i);
             histBlueRaw[idx] += hist[2][i];
         }
     }

agriggio
on 12 Dec 2018
@RawConvert there is a little clipping in the raw red channel.
Beep6581
on 12 Dec 2018
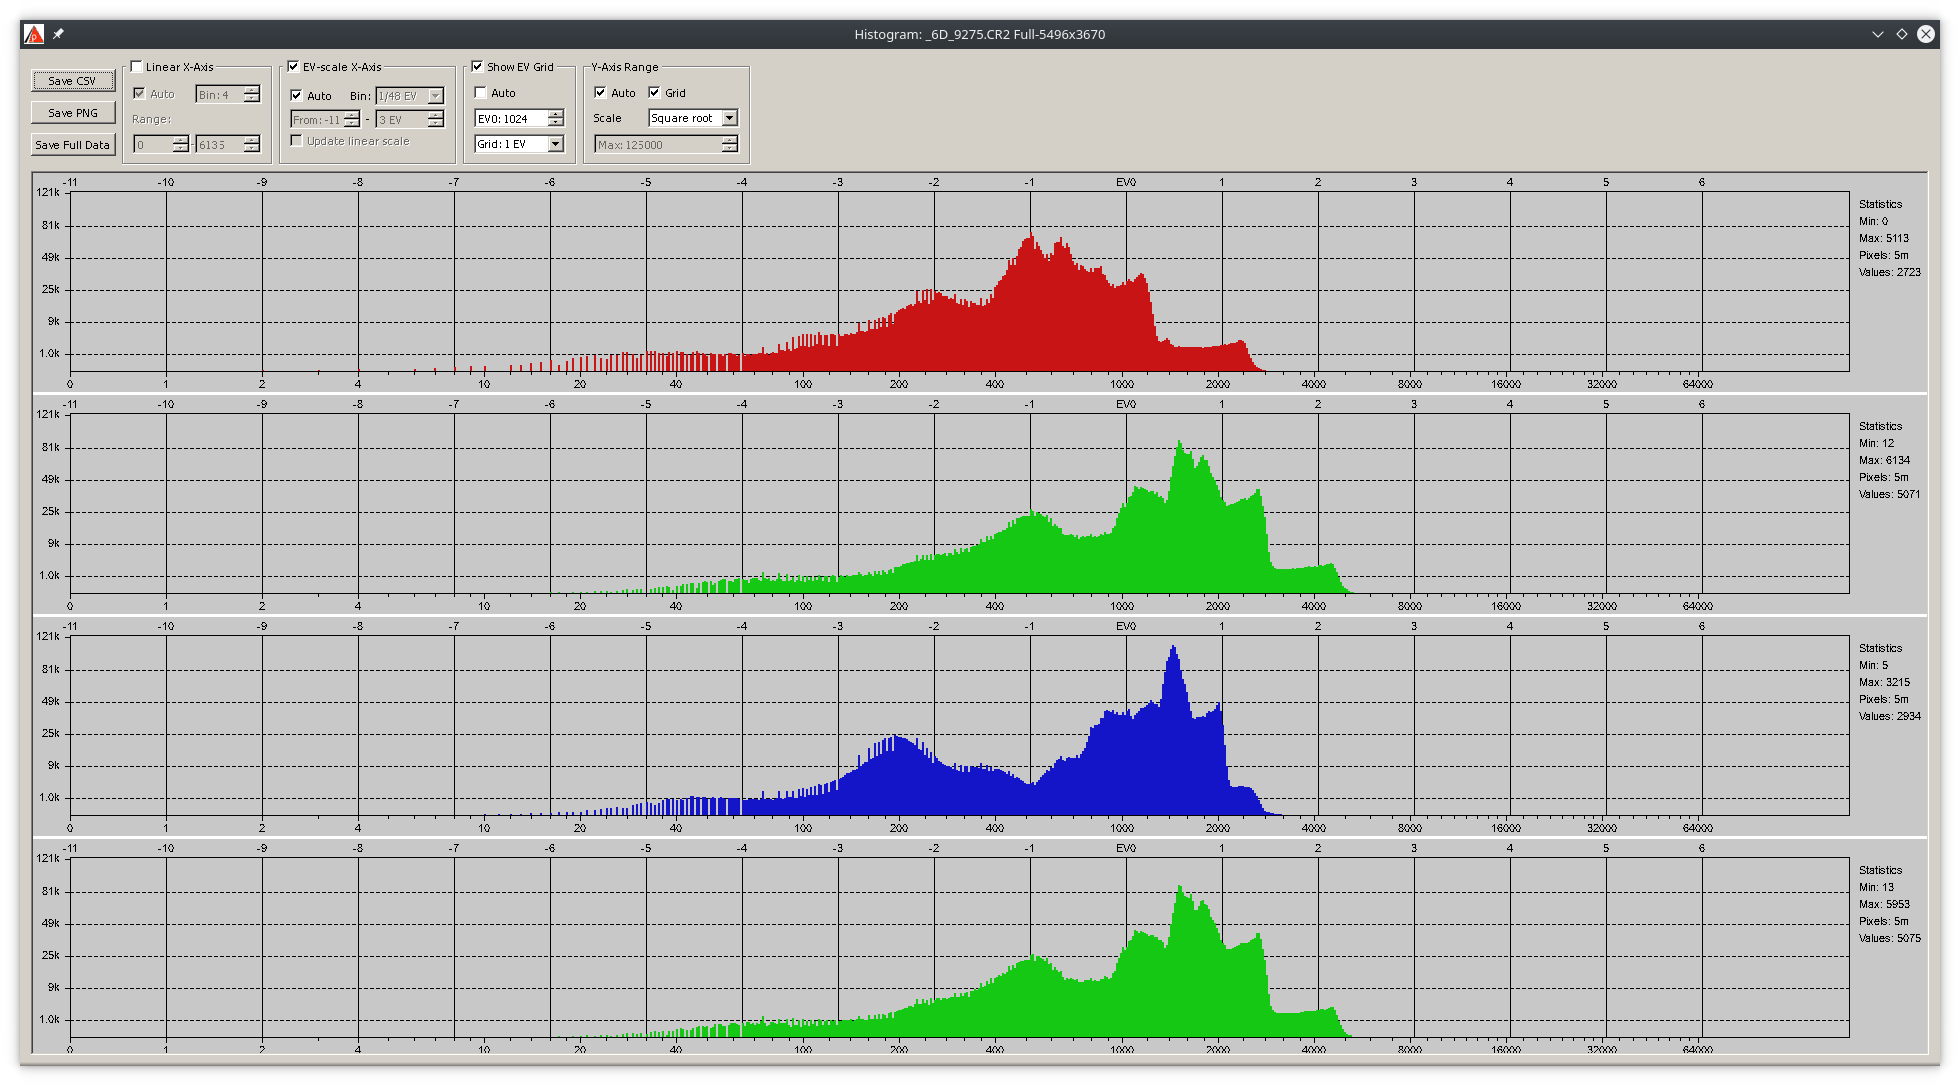
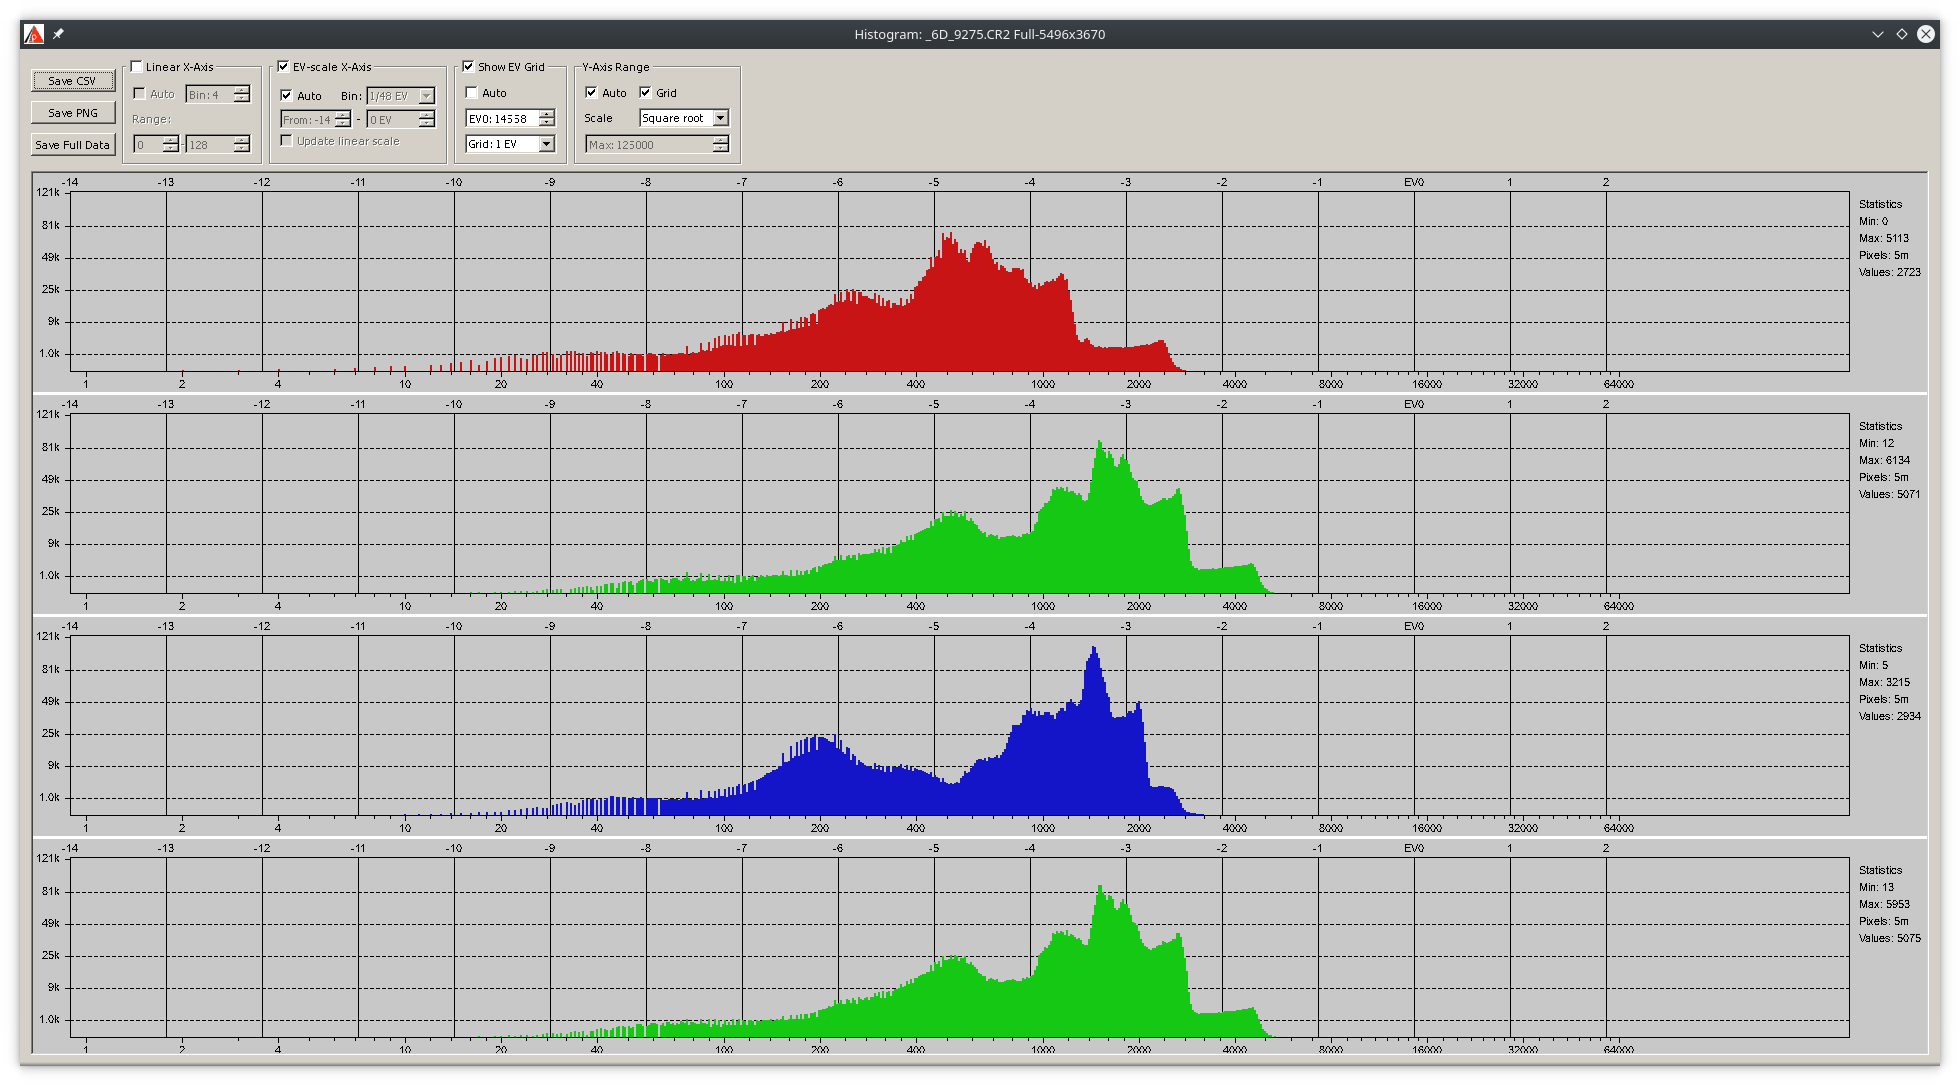
According to this, the only channel to go below -9EV is the red one:


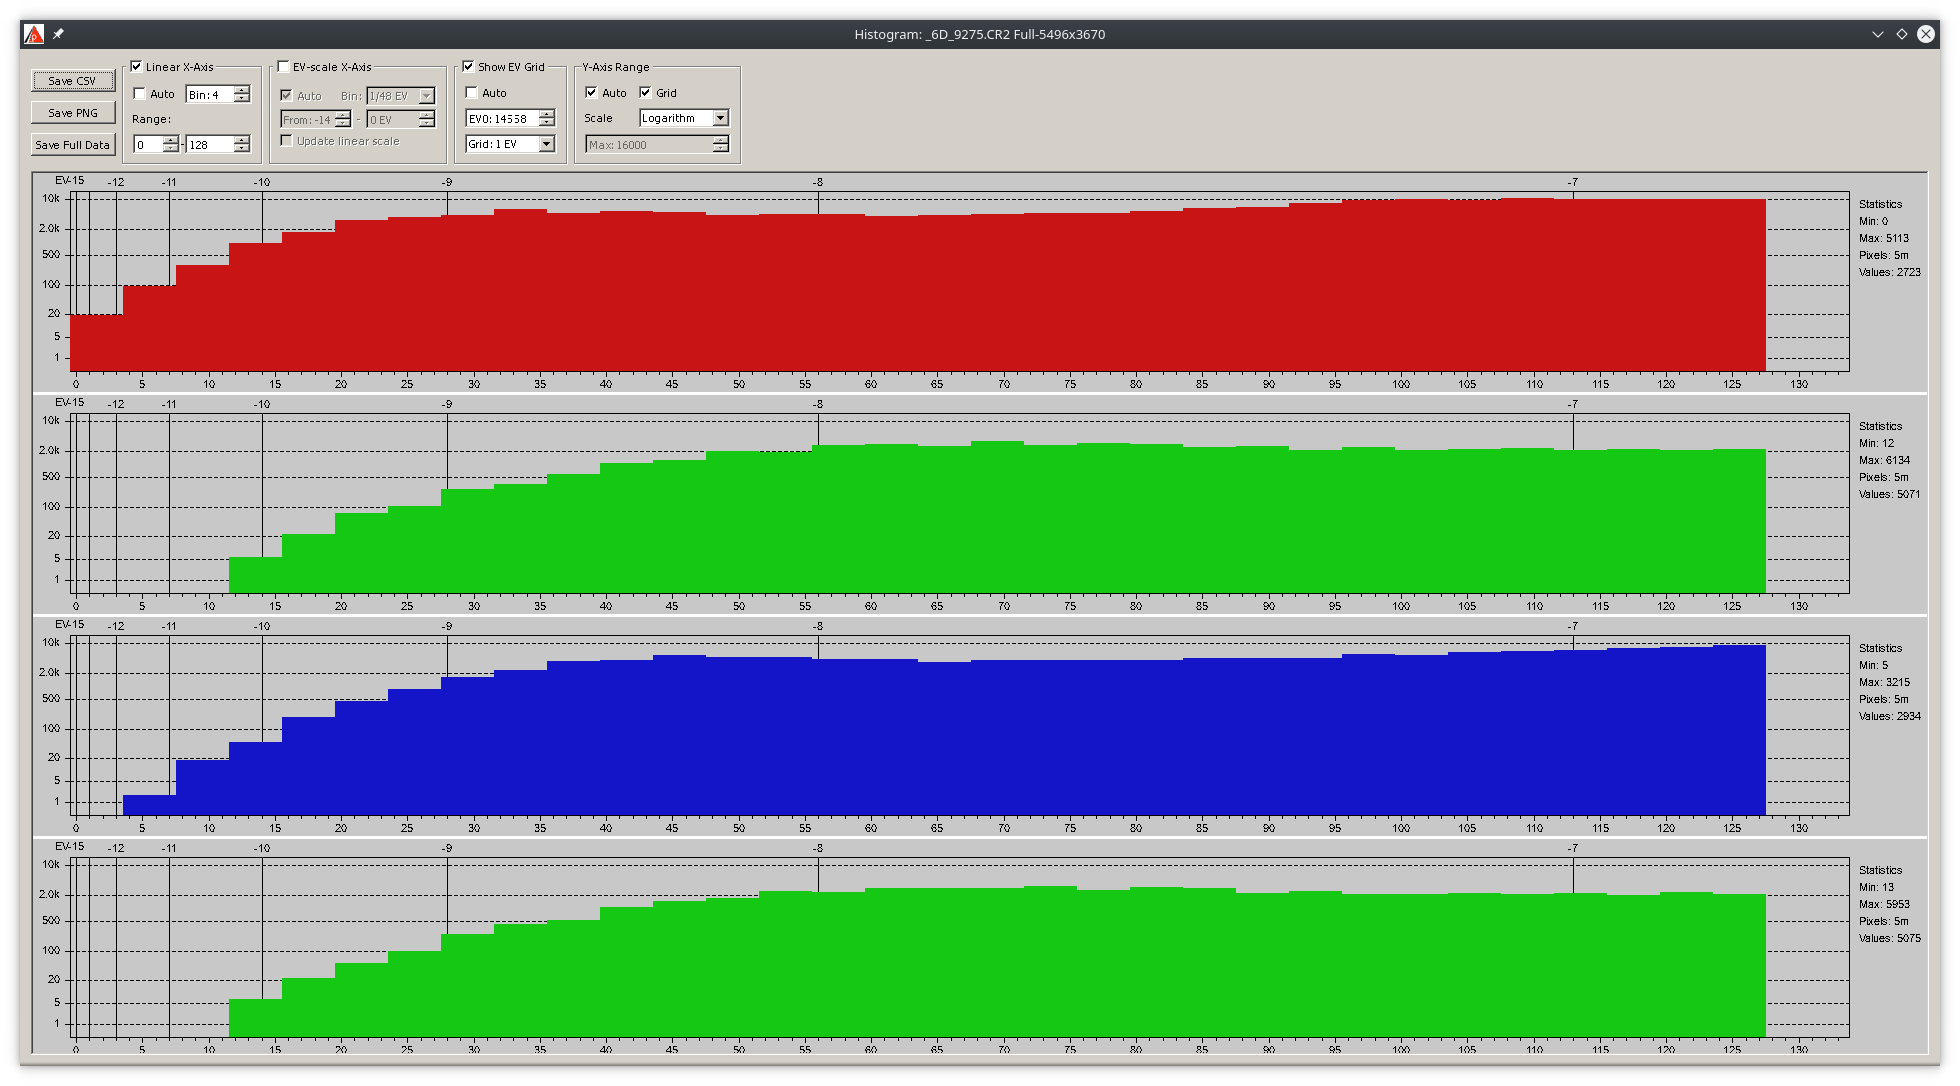
If I'm doing this right, -9EV to -11EV correspond to the leftmost column in RT's raw histogram. RT's raw histogram (with @agriggio 's patch applied) shows that there are some pixels in all three channels in the leftmost column:
Shouldn't the red channel start where it starts now (-11 to -9 = RT column 1), the blue channel start in the second column (-9 to -7 = RT column 2), and the green channel start in the third column (-7 to -5 = RT column 3)?
Does RT's raw histogram show data after black level subtraction and after white clipping in camconst?
Beep6581
on 12 Dec 2018
Does RT's raw histogram show data after black level subtraction and after white clipping in camconst?
Yes
agriggio
on 12 Dec 2018
@Beep6581
Does RT's raw histogram show data after black level subtraction and after white clipping in camconst?
I changed the calculation somewhere along to way to do that, yes.
Thanatomanic
on 12 Dec 2018
Ok, as did the reference histogram in the screenshots. So then I don't understand why RT's histogram shows R G and B all falling into column 1.
Beep6581
on 12 Dec 2018
RT's histogram shows R G and B all falling into column 1.
are the black levels the same?
agriggio
on 12 Dec 2018
@agriggio I _guess_, since they're measured from the crop mask aren't they? RD uses 2047, what does RT use and how to check?
Beep6581
on 12 Dec 2018
@Beep6581
what does RT use and how to check?
verbose=true
heckflosse
on 12 Dec 2018
Thanks @heckflosse
black levels: R:2047 G1:2047 B:2047 G2:2047 (provided by camconst.json)
white levels: R:15180 G1:15180 B:15180 G2:15180 (provided by camconst.json)
@Beep6581
According to this, the only channel to go below -9EV is the red one
Set RD EV0 to the white level.
heckflosse
on 12 Dec 2018
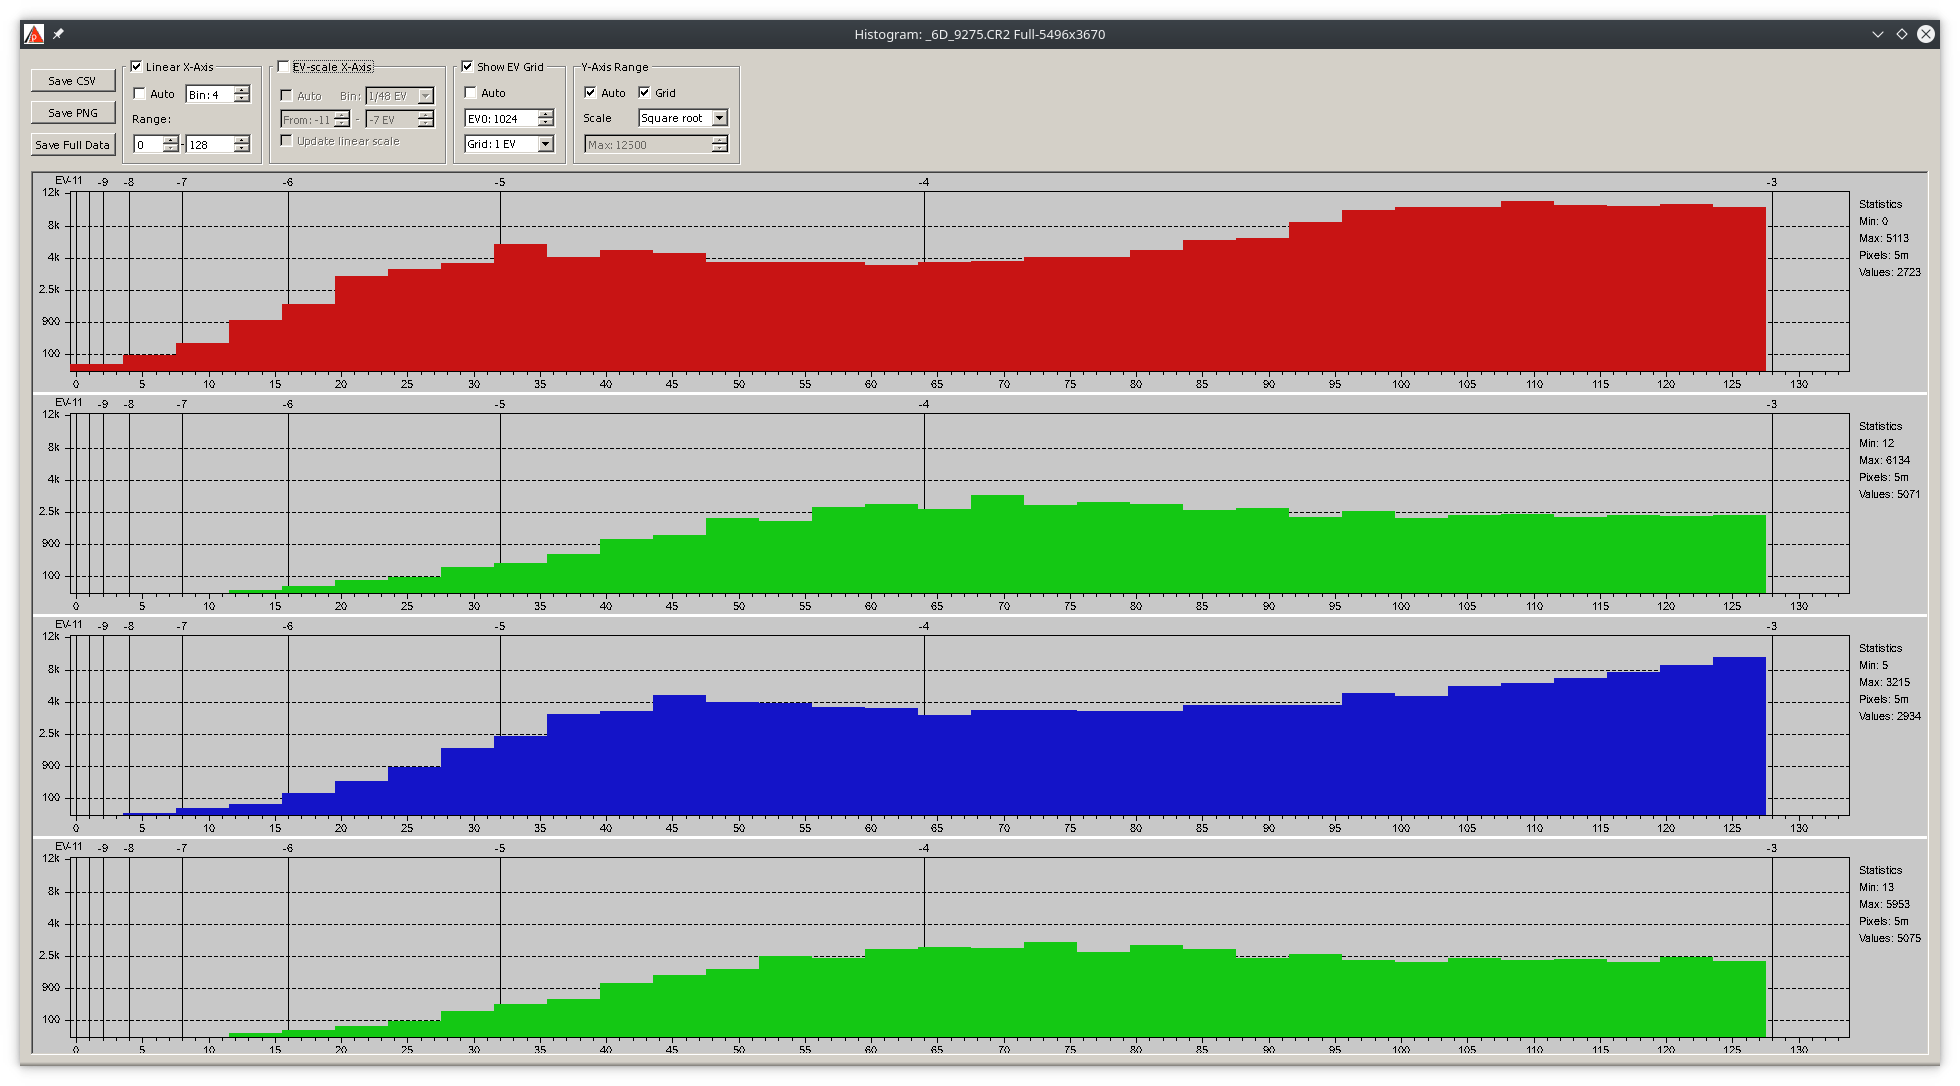
@heckflosse that only changes our point of reference, the difference persists. So with EV0 set to 14558 (from Exif), the only channel to go below -12EV is the red one. RT's log-log raw histogram has 2EV per column, so it seems to be telling me that all three channels cross the new -16EV gridline:
Beep6581
on 12 Dec 2018
Of course there's plenty of opportunities for me to have made a mistake :)
Beep6581
on 12 Dec 2018
...and it seems I made the most of one such opportunity :)
My assumption that each column corresponds to 2EV was based on having tested the non-raw histogram: a 2EV exposure compensation corresponds to 1 column jump. Since I can't test the raw histogram the way you can test the non-raw one, I assumed the raw histogram behaved the same, as RawPedia doesn't say otherwise.
Discussing this with @heckflosse in IRC, it's now clear that the raw histogram's columns correspond to a 1EV jump, where 0EV is on the right edge, -1EV on the first vertical grid line to the left of 0EV, and so on until the 7th grid line. Between the 7th grid line and the left edge are squashed up all the remaining stops.
I'll update the docs.
Beep6581
on 12 Dec 2018
@Beep6581 , @heckflosse , re. all the remaining stops in the leftmost division -
256 bins is mentioned above, so that's 32 per division. How are these 32 processed? Is it the leftmost bin that is the "bucket", with the other 31 being "accurate". Or are the remaining stops somehow spread over all the 32 bins? The leftmost division above is unique in that it is the only one where each channel is a straight line.
Can I ask another question not directly related to this pls. There has been a lot written in the forum about linear data and preserving value relationships for certain operations. Suppose the black point is 50 and we have two red pixels, one value 100, the other 150, in the raw file. Is the true relationship between these two a ratio of 150/100 i.e. 1.5; or is it 100/50 i.e. 2? I guess this is a physics issue about sensors and photons. However in view of the comment above that the black point is subtracted for histogram purposes, I was wondering. Do the pixel values used in RT calcs have the black point subtracted? I suspect they do because I can find dark pixels in raw files with a value of 5 according to the RGB values shown just below the histogram. Surely surely there can't be a problem here, but could you confirm RT is doing the right thing with the black point. If it was not, it would of course be the leftmost area where the "distortion" was greatest.
RawConvert
on 13 Dec 2018
@heckflosse Though the assemby is longer, this seems to be a little bit faster:
diff --git a/rtengine/rawimagesource.cc b/rtengine/rawimagesource.cc
index 3c7a34e73..e272d2eba 100644
--- a/rtengine/rawimagesource.cc
+++ b/rtengine/rawimagesource.cc
@@ -44,6 +44,9 @@
 #undef CLIPD
 #define CLIPD(a) ((a)>0.0f?((a)<1.0f?(a):1.0f):0.0f)

+#define BENCHMARK
+#include "StopWatch.h"
+
 namespace
 {

@@ -4716,7 +4719,7 @@ void RawImageSource::getAutoExpHistogram (LUTu & histogram, int& histcompr)
 // Histogram MUST be 256 in size; gamma is applied, blackpoint and gain also
 void RawImageSource::getRAWHistogram (LUTu & histRedRaw, LUTu & histGreenRaw, LUTu & histBlueRaw)
 {
-//    BENCHFUN
+    BENCHFUN
     histRedRaw.clear();
     histGreenRaw.clear();
     histBlueRaw.clear();
@@ -4834,10 +4837,10 @@ void RawImageSource::getRAWHistogram (LUTu & histRedRaw, LUTu & histGreenRaw, LU
     } // end of parallel region

     const auto getidx =
-        [&](int c, int i) -> int
+        [this, &mult](int c, int i) -> int
         {
-            float f = mult[c] * std::max(0.f, i - cblacksom[c]);
-            return f > 0.f ? (f < 1.f ? 1 : std::min(int(f), 255)) : 0;
+            const float f = mult[c] * std::max(0.f, i - cblacksom[c]);
+            return f > 0.f ? LIM(f, 1.f, 255.f) : 0.f;
         };

     for(int i = 0; i < histoSize; i++) {
I don't have the best environment to benchmark. Can you confirm?
Best,
Flössie
 Floessie
on 13 Dec 2018
Floessie
on 13 Dec 2018
@Floessie Yes. It's 0.9 ms before and 0.7 ms after
heckflosse
on 13 Dec 2018
@heckflosse I had something like 40ms vs. 35ms...
Floessie
on 13 Dec 2018
@Floessie I measured just the loop, not the whole function
heckflosse
on 13 Dec 2018
@RawConvert
256 bins is mentioned above, so that's 32 per division.
no, it's 2, 2, 4, 8, 16, 32, 64, 128
heckflosse
on 13 Dec 2018
@Floessie Here's how I measured:
diff --git a/rtengine/rawimagesource.cc b/rtengine/rawimagesource.cc
index 3c7a34e73..c71fde579 100644
--- a/rtengine/rawimagesource.cc
+++ b/rtengine/rawimagesource.cc
@@ -40,6 +40,7 @@
 #include <omp.h>
 #endif
 #include "opthelper.h"
+#include "StopWatch.h"
 #define clipretinex( val, minv, maxv )    (( val = (val < minv ? minv : val ) ) > maxv ? maxv : val )
 #undef CLIPD
 #define CLIPD(a) ((a)>0.0f?((a)<1.0f?(a):1.0f):0.0f)
@@ -4832,12 +4833,12 @@ void RawImageSource::getRAWHistogram (LUTu & histRedRaw, LUTu & histGreenRaw, LU
             }
         } // end of critical region
     } // end of parallel region
-
+StopWatch Stop1("test", true);
     const auto getidx =
-        [&](int c, int i) -> int
+        [this, &mult](int c, int i) -> int
         {
-            float f = mult[c] * std::max(0.f, i - cblacksom[c]);
-            return f > 0.f ? (f < 1.f ? 1 : std::min(int(f), 255)) : 0;
+            const float f = mult[c] * std::max(0.f, i - cblacksom[c]);
+            return f > 0.f ? LIM(f, 1.f, 255.f) : 0.f;
         };

     for(int i = 0; i < histoSize; i++) {
@@ -4857,7 +4858,7 @@ void RawImageSource::getRAWHistogram (LUTu & histRedRaw, LUTu & histGreenRaw, LU
             histBlueRaw[idx] += hist[2][i];
         }
     }
-
+Stop1.stop();
     if (ri->getSensorType() == ST_BAYER)    // since there are twice as many greens, correct for it
         for (int i = 0; i < 256; i++) {
             histGreenRaw[i] >>= 1;
@heckflosse Thanks. Then it's not worth it and only decoration.
Floessie
on 13 Dec 2018
no, it's 2, 2, 4, 8, 16, 32, 64, 128
Ah, thanks
RawConvert
on 13 Dec 2018
@RawConvert
Do the pixel values used in RT calcs have the black point subtracted?
Yes
heckflosse
on 13 Dec 2018
@Thanatomanic and all, as you've seen above, I think the histograms could be improved and perhaps simplified. So I've been working on spreadsheet to experiment with this. I am respectfully offering the output as food for thought in case you like it.
The objectives are a) to remove "dead" areas of x-axis if nothing is happening b) make clearer what is happening by expanding horizontally areas of the histogram on the basis that the more pixels there are, the more it should be expanded c) auto-fill the x-axis space.
Here are the results with the original in red (pretty much the same raw I posted above) and the processed version in blue. I hope you'll see it's "topologically" the same, more "usefully detailed", but with the zeroes on the right removed. Don't worry about the numbers on the axes, these are not important at this stage. A bit more work would be needed to show where the stops fall.
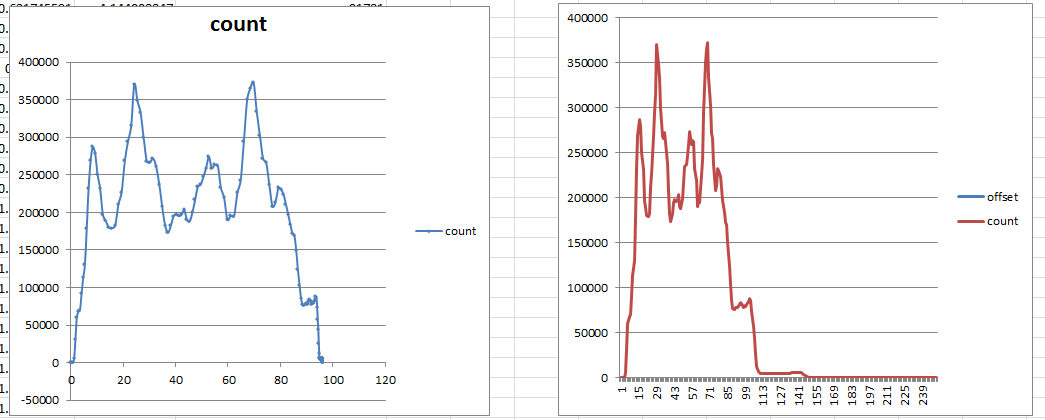
I'd say the algorithm is fairly simple - probably a piece of cake compared with much of what RT does. If you think this is worth looking at further let me know and I'll take the time to document the method.
RawConvert
on 13 Dec 2018
@RawConvert Thanks Andrew for the mockup. I like the idea to show only the relevant x-portion of the histogram. Did you intend to use the (fixed) 256 bins only for the 'useful' range, or simply truncate at a certain point? Because the former will give a more detailed histogram. It also requires some clever rewriting of the positioning of the gridlines.
I have also my doubts on the insight you can get from a truncated histogram. For this specific purpose, you might as well use the log-log scale and slide the histogram all the way to the right. That way most of the (almost) zero values get bundled up too. Or does that not satisfy you?
Thanatomanic
on 13 Dec 2018
Please stay on-topic. This issue is a bug report about the histogram being wrong - whatever was wrong is now fixed. Enhancements can go into a new issue.
Beep6581
on 13 Dec 2018
@Thanatomanic , the procedure doesn't lose any data and so doesn't truncate pixels at some point. On reflection I think working out where the grid lines go is straightforward. You mention doubts. Whilst it's not truncated, nevertheless the gridlines will not be half way, a quarter way... etc so some might find that undesirable. For example if a big portion of the middle of the histogram had very few pixles, then there would tend to be a few gridlines relatively close together. However for a typical photo, I think it will be ok. You mention sliding the log-log one to the right. At first I thought this could be good, however now I realise that the first and second divisions only represent 4 bins, I think too much prominence is being given to them. Let me know if you're still interested and I'll detail the method in a new issue.
RawConvert
on 14 Dec 2018
Related issues
heckflosse
·
3Comments
heckflosse
·
4Comments
heckflosse
·
4Comments
agriggio
·
4Comments
Beep6581
·
5Comments
Most helpful comment
...and it seems I made the most of one such opportunity :)
My assumption that each column corresponds to 2EV was based on having tested the non-raw histogram: a 2EV exposure compensation corresponds to 1 column jump. Since I can't test the raw histogram the way you can test the non-raw one, I assumed the raw histogram behaved the same, as RawPedia doesn't say otherwise.
Discussing this with @heckflosse in IRC, it's now clear that the raw histogram's columns correspond to a 1EV jump, where 0EV is on the right edge, -1EV on the first vertical grid line to the left of 0EV, and so on until the 7th grid line. Between the 7th grid line and the left edge are squashed up all the remaining stops.
I'll update the docs.