Rabbitmq: Memory leak on 3.7.11-management-alpine?
Hello, I was running rabbitmq-3.7.8-management-alpine yesterday I've updated to rabbitmq-3.7.11-managment-alpine and memory usage growth until the watermark as shown in prometheus:
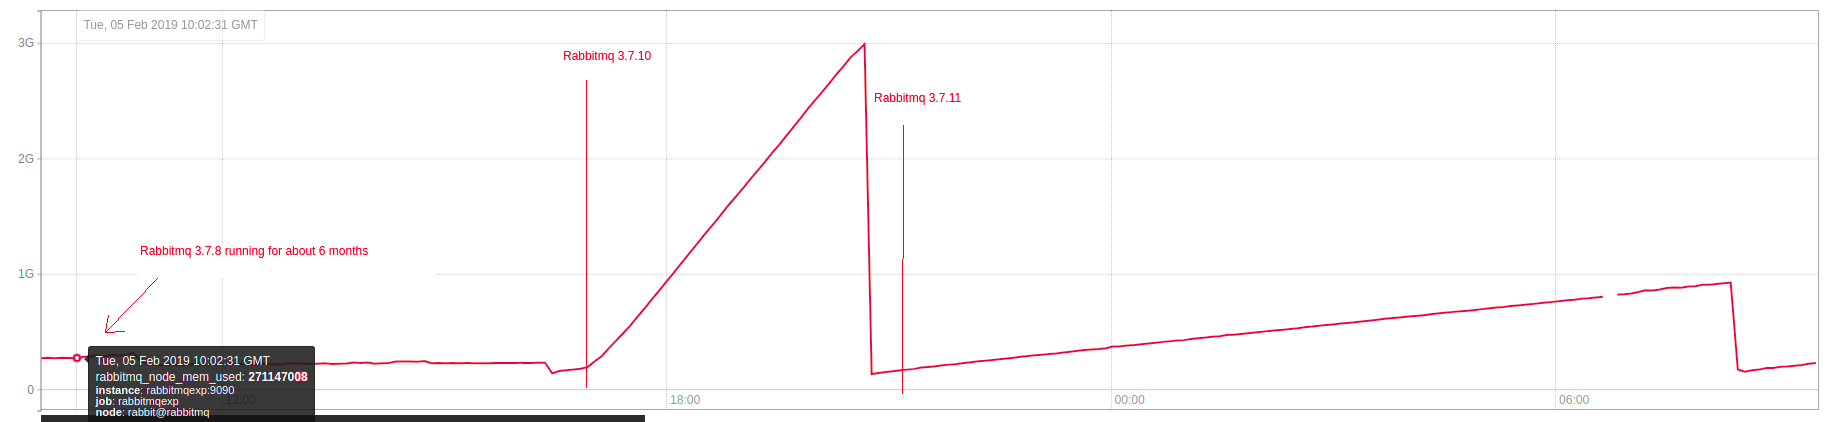
The drop of memory usage was due to my manual restart.
I've checked number of connections, queues, messages and they are the same across the three versions, I've also left the configuration untouched.
I'm running this configuration in more than 100 servers and in all of them the beheviour is the same.
Did something changed between 3.7.8 and 3.7.10/11 that I need to adjust my configuration for or is it some bug?
 ManofWax
All 7 comments
You could try asking over at https://github.com/rabbitmq/rabbitmq-server/issues since these repos are for issues with the Docker image and not with the software itself, as we aren't maintainers of RabbitMQ
 wglambert
on 6 Feb 2019
wglambert
on 6 Feb 2019
@gerhard @michaelklishin any idea whether there's something about how we start RabbitMQ / build Erlang / install the management plugin that might cause something like this, or is the suggestion to file an appropriate issue further up the chain the best we can offer from this perspective?
 tianon
on 7 Feb 2019
tianon
on 7 Feb 2019
I am not aware of any changes in 3.7.11 that could be causing this, but I am intrigued.
The first page to read is https://www.rabbitmq.com/memory-use.html. Sharing a memory breakdown using rabbitmqctl is essential in making progress with this.
If you are already using Prometheus, I am assuming that you have Grafana nearby, which would make it easy to set up BEAM Memory Allocators Dashboard. While this is not necessary, it provides a deeper insight into Erlang VM's memory management and helps narrow-down memory-related issues quicker. This Grafana dashboard requires prometheus_rabbitmq_exporter, as described in https://www.rabbitmq.com/prometheus.html.
Lastly, the rabbitmq-users mailling list is full of insightful memory-related threads.
Hope this helps, Gerhard.
 gerhard
on 7 Feb 2019
gerhard
on 7 Feb 2019
@wgerlach team RabbitMQ does not use GitHub issues for questions and any questions asked there will be redirected to the mailing list.
Memory breakdown and rabbitmq-top should be the OP's starting points. We'd ask for both first thing on rabbitmq-users. Don't guess, collect data instead.
 michaelklishin
on 8 Feb 2019
michaelklishin
on 8 Feb 2019
There weren't any relevant changes in RabbitMQ since 3.7.8: 3.7.9, 3.7.10, 3.7.11, so there's a decent chance the biggest contributor can be the Erlang version upgrade that happened in this image since September.
@gerhard's memory allocator dashboard suggestion is therefore a very good idea.
michaelklishin
on 8 Feb 2019
@ManofWax did you make progress with this?
gerhard
on 27 Feb 2019
Thanks everyone for the help, I haven't got time to investigate further but tt seems disabling ldap plugin solved the issue. As soon as I've time I will test again rabbitmq 3.7.9 and 3.7.11 with ldap plugin enabled and I'll report back in case the problem persisted providing date from memory allocator dashboard.
I think this issue can be closed for now
ManofWax
on 28 Feb 2019
Related issues
michaelklishin
·
4Comments
 ash9002
·
5Comments
ash9002
·
5Comments
 michaelkrog
·
5Comments
michaelkrog
·
5Comments
 zhousujian
·
5Comments
zhousujian
·
5Comments
 CVTJNII
·
4Comments
CVTJNII
·
4Comments
Most helpful comment
I am not aware of any changes in 3.7.11 that could be causing this, but I am intrigued.
The first page to read is https://www.rabbitmq.com/memory-use.html. Sharing a memory breakdown using
rabbitmqctlis essential in making progress with this.If you are already using Prometheus, I am assuming that you have Grafana nearby, which would make it easy to set up BEAM Memory Allocators Dashboard. While this is not necessary, it provides a deeper insight into Erlang VM's memory management and helps narrow-down memory-related issues quicker. This Grafana dashboard requires prometheus_rabbitmq_exporter, as described in https://www.rabbitmq.com/prometheus.html.
Lastly, the rabbitmq-users mailling list is full of insightful memory-related threads.
Hope this helps, Gerhard.