Quasar: Debug Quasar Electron App with VS Code
Hi, I'm searching for tips on how to config my VS Code to debug the node part of a Quasar Electron app.
I'm lost in all the vscode documentation together with quasar documentation and electron documentation :/
I have posted the question here but still got no answers.
I would happilly write some docs about it once I get it to work (just show me where), that's why I'm posting it here.
Any help? Thanks!
 Menighin
All 20 comments
@Menighin This may be all the documentation you need. It explains it quite thoroughly.
https://marketplace.visualstudio.com/items?itemName=msjsdiag.debugger-for-chrome
 hawkeye64
on 24 Jun 2019
hawkeye64
on 24 Jun 2019
I've looked for a way to pass information to devServer in regards to automatically starting chome in debug mode, but the ability to do it is just not there. I may go raise an issue with them. The other choice we have is to turn devServer.open to false and then provide a hook to do it ourselves at end of quasar compilation.
hawkeye64
on 25 Jun 2019
@hawkeye64 hook here https://github.com/quasarframework/quasar/pull/4458
 lucasfernog
on 25 Jun 2019
lucasfernog
on 25 Jun 2019
@lucasfernog yes, thanks! I noticed the PR this morning. Will definitely be helpful.
hawkeye64
on 25 Jun 2019
Hi guys, sorry for the late response.
@hawkeye64 I'm really sorry but I did went through this documentation and could not manage to configure it.
With a raw electron app it works fine. I just configure as the examples and it just works. With Quasar this does not work. I have tried:
- Make vs code run the
quasar devcommand and debug it. I couldnt make it (keep getting errors of command not found and stuff like that). - Make vs code launch electron in a folder where I have built my project using
quasar build. This does get the app to launch, but I can't get any breakpoints. - Attach vscode to a running electron app. Couldn't make it because I don't quite understand which port or stuff like that I should attach it :/
Notice that I'm looking forward to debug the main process of an electron app. The render process I'm fine with opening the dev tools and working with it.
Could you please provide an example of a config that should work then I can work my way through it? Really lost here :S
Menighin
on 4 Jul 2019
@hawkeye64 with the new 1.0 release, do you have all you need to do this?
lucasfernog
on 4 Jul 2019
@lucasfernog
I have not had time to pursue this further. I am guessing the information available is for debugging the main process and not the renderer process.
hawkeye64
on 5 Jul 2019
Hi all !
Any news about that ?
I'm really interested in a way to attach a client debugger to quasar/electron app (personally using Webstorm).
It should be doable as I understand (using 5858 default port) but in my case, when I attach a client debugger to that port, quasar cli displays "debugger attached" but sadly none of my break points are hit.
Do you guys have any info about this ?
Thanks a lot for your work !
 GhyslainBruno
on 6 Nov 2019
GhyslainBruno
on 6 Nov 2019
I second that. Is it possible to attach to render process when developing electron apps using quasar? If not, that'd be a huge showstopper. What more is needed than adding the '--remote-debugging-port=9222' parameter?
 jdus
on 14 Nov 2019
jdus
on 14 Nov 2019
I really don't know, I thought it would've been an easy task, but I suppose it's not actually.
I really don't get why the debugger attached doesn't work :-/
GhyslainBruno
on 22 Nov 2019
Just to share this info in here:
I found that when I attach a NodeJS debugger (using Webstorm or the ChromeDevTools for example) I can see the _electron-main.js_ file (in .quasar) is "accessible" (green dot in ChromeDevTools)
So, I guess, that attaching the debugger that way (just using the 5858 default port to launch a NodeJS client debugger) is actually debugging the electron main process.
Which, I assume, we don't really want.
I might be wrong, but I think that what we are trying to achieve is debugging the render electron process in vscode/webstorm etc.
Is that correct to you guys ?
Anyway, I'm really losing any hope right now about debugging my quasar electron apps using an IDE (I asked several times this very same question on quasar discord, without any response :-/).
Thanks for your time/help guys.
GhyslainBruno
on 27 Nov 2019
Yes !
I actually managed to get it work !
So, the article that helped me a lot is this one - article of Jetbrains explaining how to debug main and render electron processes.
Firstly, I didn't know how to actually pass the _--remote-debugging-port=9222_ option to quasar, so quasar could send it to the electron executable.
I then read this page again, where it explains that you can pass extra parameters to electron executable this way :
quasar dev -m electron -- --extra_parameter
So I gave it a try.
Finally, all you have to do to get your debug working properly in Webstorm is (assuming this should be quite the same for VS Code) :
- launch your quasar/electron app in development mode, with the remote-debugging-port extra parameter :
quasar dev -m electron -- --remote-debugging-port=9222
_Any port number can be used_
Attach a NodeJS/Chrome debugger :

⚠️ Choose a page to debug in the dialog that opens, otherwise it won't work ⚠️ :

And, voilà !
You can now debug a quasar / electron app using directly webstorm !
Here are some screenshots of how it works on Webstorm.
Anyway, thanks for the open issue, I let someone who knows VS Code better than me explain the workflow for this IDE to actually answer the subject of this issue...
Thanks for your help guys !
GhyslainBruno
on 28 Nov 2019
That's awesome @GhyslainBruno. Our project has been pushed back to December, but I'm looking even more forward now.
jdus
on 28 Nov 2019
@GhyslainBruno hi!
I was trying this again after a long time.
What I'm actually trying to do is to debug the main process with VS Code.
Your findings were helpful but I'm still stuck.
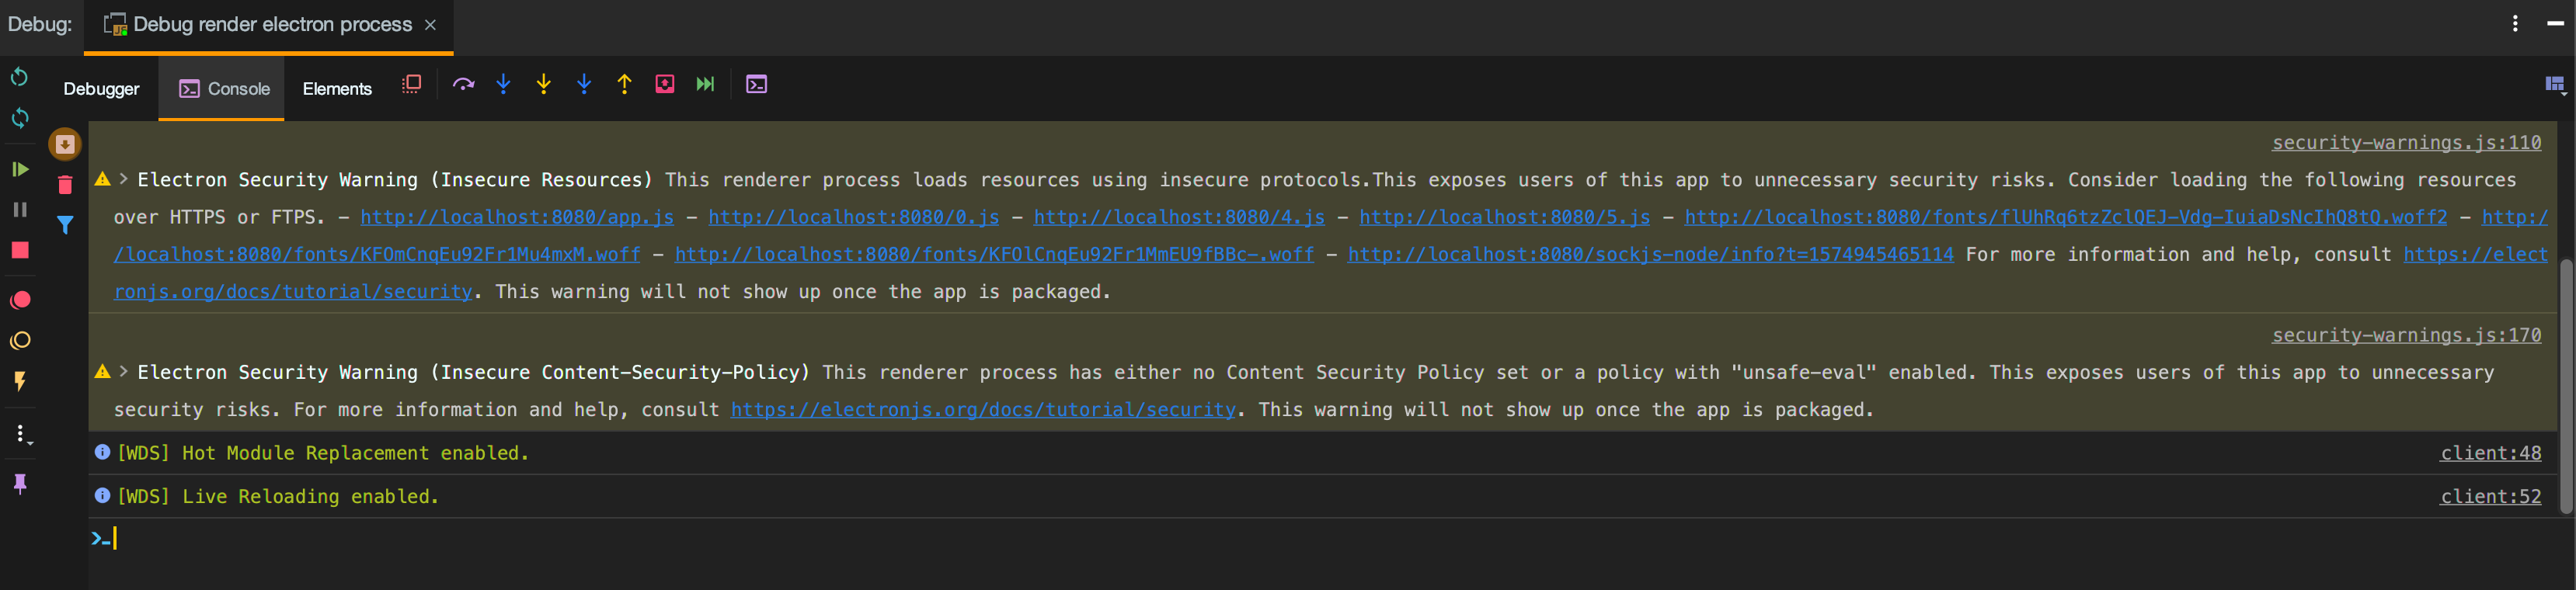
When I run the quasar dev -m electron I can see it has --inspect on the default 5858. But when I attach a debugger from VSCode to it, I get all my breakpoints grey:

With your finding about passing parameters to Electron I was able to pass --inspect-brk and indeed I get a breakpoint when I attach the debugger. But that's all of it. Any other breakpoint is not hit, just like the image above.
The launch settings is just the defaults:
        {
            "type": "node",
            "request": "attach",
            "name": "Attach",
            "port": 5858,
            "skipFiles": [
                "<node_internals>/**"
            ]
        },
Any ideas guys?
Menighin
on 28 Dec 2019
@GhyslainBruno hi!
I was trying this again after a long time.
What I'm actually trying to do is to debug the main process with VS Code.
Your findings were helpful but I'm still stuck.
When I run thequasar dev -m electronI can see it has--inspecton the default5858. But when I attach a debugger from VSCode to it, I get all my breakpoints grey:
With your finding about passing parameters to Electron I was able to pass
--inspect-brkand indeed I get a breakpoint when I attach the debugger. But that's all of it. Any other breakpoint is not hit, just like the image above.The launch settings is just the defaults:
        {
            "type": "node",
            "request": "attach",
            "name": "Attach",
            "port": 5858,
            "skipFiles": [
                "<node_internals>/**"
            ]
        },
Any ideas guys?
same, any update?
 jeoy
on 14 Apr 2020
jeoy
on 14 Apr 2020
This is how to debug Quasar Electron App Main Process with VS Code or WebStorm.
Quasar doesn't run electron-main.js from the source code. It creates a webpacked js file in .quasar/electron folder with no correlation to src file. That's why you can't set a breakpoint in your src file.
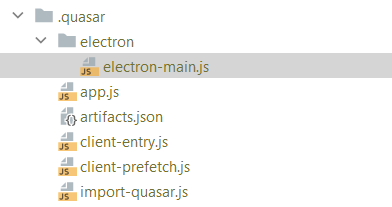
The file is .quasar/electron folder is nothing but a webpack of your electron project. Therefore, you need to extend webpack configuration and add source maps to let you attach the debugger. Here is the config needed:
cfg.devtool = ctx.dev ? "#cheap-module-eval-source-map" : "#source-map"
Here is a more complete example (only above line is needed):
    electron: {
      bundler: "builder", // 'builder' or 'packager'
      nodeIntegration: false,
      extendWebpack(cfg) {
        // do something with Electron main process Webpack cfg
        // chainWebpack also available besides this extendWebpack
        cfg.resolve.modules.push(path.resolve(__dirname, "../../node_modules")) // lerna modules
        cfg.devtool = ctx.dev ? "#cheap-module-eval-source-map" : "#source-map"

        // this is externals for electron webpack main chain
        cfg.externals = [
          nodeExternals({
            modulesDir: "../../node_modules",
          }),
        ] // in order to ignore all modules in node_modules folder
      },
   }
Run this in command line to specify ports:
quasar dev --debug -m electron -t mat -- --remote-debugging-port=9222 --inspect=5858
9222 is for chrome UI
5858 is for node main process (it is default if you haven't set it)
Attach your debuggers to the opened ports and it should be good to go. You can use --inspect-brk=5858 to keep the app stop at first JavaScript line of the main process and then attach your debugger.
I made this work with WebStorm, and I am sure same works with VS Code. I hope it helps.
(Why not asking these questions on Stackoverflow?)
 mohghaderi
on 12 Oct 2020
mohghaderi
on 12 Oct 2020
@mohghaderi Stackoverflow would have been a better place instead of issues.
Closing this issue as the above appears to be a working solution.
hawkeye64
on 13 Oct 2020
Just a disclaimer, I have tried stack overflow: https://stackoverflow.com/questions/59507915/cant-attach-debugger-to-quasar-main-process
Feel free to also answer that. As soon as I have the time to try this I may accept the answer on SO.
Thanks!
Menighin
on 14 Oct 2020
@mohghaderi
        cfg.externals = [
          nodeExternals({
            modulesDir: "../../node_modules",
          }),
Where does nodeExternals come from?
hawkeye64
on 14 Oct 2020
@hawkeye64 Please follow up here: https://stackoverflow.com/questions/59507915/cant-attach-debugger-to-quasar-main-process/64380181#64380181
mohghaderi
on 15 Oct 2020
Related issues
 green-mike
·
3Comments
green-mike
·
3Comments
 tombarfoot
·
3Comments
tombarfoot
·
3Comments
 adwidianjaya
·
3Comments
adwidianjaya
·
3Comments
 wc-matteo
·
3Comments
wc-matteo
·
3Comments
 hctpbl
·
3Comments
hctpbl
·
3Comments
Most helpful comment
Yes !
I actually managed to get it work !
So, the article that helped me a lot is this one - article of Jetbrains explaining how to debug main and render electron processes.
Firstly, I didn't know how to actually pass the _--remote-debugging-port=9222_ option to quasar, so quasar could send it to the electron executable.
I then read this page again, where it explains that you can pass extra parameters to electron executable this way :
So I gave it a try.
Finally, all you have to do to get your debug working properly in Webstorm is (assuming this should be quite the same for VS Code) :
_Any port number can be used_
Attach a NodeJS/Chrome debugger :

⚠️ Choose a page to debug in the dialog that opens, otherwise it won't work ⚠️ :

And, voilà !
You can now debug a quasar / electron app using directly webstorm !
Here are some screenshots of how it works on Webstorm.
Anyway, thanks for the open issue, I let someone who knows VS Code better than me explain the workflow for this IDE to actually answer the subject of this issue...
Thanks for your help guys !