Pydicom: Is it possible to add graphic layer with multiple annotations?
Hi all,
I'm trying to add a graphic layer to a given dicom. I want to add multiple bounding boxes that could then be displayed over the image. Each one of the bounding boxes has a score, so I want to add text beside each.
Something like that:
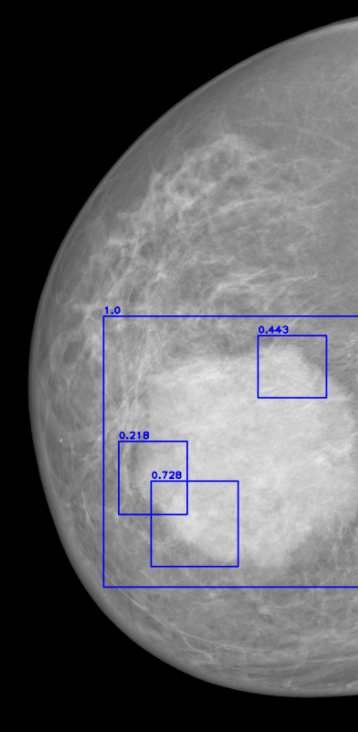
If I understood well, so for one bbox I can do the following:
ds_processed = dicom.dcmread(dcm_path)
ds_processed.add_new(0x700010, 'FL', bbox[0:2])
ds_processed.add_new(0x700011, 'FL', bbox[2:4])
But I still didn't understand how to add multiple bboxes (without overriding the previous), and how to add text.
Thanks!
Gavriel
 GavrielHabib123
All 7 comments
From what I can tell, the Graphic Annotation module allows you to add multiple bounding boxes as part of a (0070,0001) Graphic Annotation Sequence, so you'd do:
ds = Dataset()
# Add other elements...
seq = ds.GraphicAnnotationSequence = [Dataset(), Dataset(), ...]
img_seq = seq[0].ReferencedImageSequence = [Dataset(), ...]
# Add other elements...
# Graphics on the first referenced image
obj_seq = img_seq[0].TextObjectSequence = [Dataset(), ...]
obj_seq[0].BoundingBoxAnnotationUnits = 'PIXEL'
obj_seq[0].BoundingBoxTopLeftHandCorner = [51, 52]
obj_seq[0].BoundingBoxBottomRightHandCorner = [101, 201]
obj_seq[0].BoundingBoxHorizontalJustification = 'LEFT'
obj_seq[0].UnformattedTextValue = '123456' # Maybe?
# And so on...
obj_seq[1].BoundingBoxAnnotationUnits = 'PIXEL'
# Graphics for the second referenced image, etc...
Adding other required elements and some fine tuning is probably required, but I believe that'd be the general idea. You might have to use Graphic Object Sequence instead of/in addition to the Text Object Sequence.
 scaramallion
on 28 Aug 2019
scaramallion
on 28 Aug 2019
Thank you for your kind explanation. I'll try it.
GavrielHabib123
on 28 Aug 2019
The value of a sequence element in pydicom is a list of zero or more Dataset objects, (each item in a sequence element is representated as its own Dataset). So if you wanted to have a sequence containing four items (for example, where each item represented a single graphics object) you'd need a list containing four Dataset objects.
To get an idea of the typical structure of a DICOM dataset (which resembles a tree), try the following.
from pydicom.dataset import Dataset

ds = Dataset()
ds.PatientName = 'Some name'  # Non-sequence element

# BeamSequence with two items
ds.BeamSequence = [Dataset(), Dataset()]
beam_0 = ds.BeamSequence[0]
beam_1 = ds.BeamSequence[1]
beam_0.BeamName = 'Beam 0'  # Non-sequence, but within a sequence
beam_1.BeamName = 'Beam 1'  # Non-sequence, but within a sequence

print(ds)
Is there a way to automatically display the dicom's image with its graphic annotation sequence using pydicom? Just to make sure I have done it well.
For sanity check, I wrote a code that parses the dicom and draw the annotations over the image, but I guess there is a plug-and-play way to do it (?).
            # sanity check
            img = ds_processed.pixel_array
            seq = list(ds_processed[0x0070, 0x0001])
            font = cv2.FONT_HERSHEY_SIMPLEX

            for bbox_idx in range(len(seq)):
                cv2.rectangle(img, tuple(seq[bbox_idx].BoundingBoxTopLeftHandCorner),
                              tuple(seq[bbox_idx].BoundingBoxBottomRightHandCorner), (255, 0, 0), 5)
                cv2.putText(img, seq[bbox_idx].UnformattedTextValue,
                            tuple(seq[bbox_idx].BoundingBoxTopLeftHandCorner), font, 4, (255, 255, 255), 5)

            plt.imshow(img)
            plt.show()
Thanks again!
GavrielHabib123
on 28 Aug 2019
Is there a way to automatically display the dicom's image with its graphic annotation sequence using pydicom?
We don't have anything like that, sorry. The best way to test these things is usually to try them out in whatever third party software you're writing them for.
scaramallion
on 29 Aug 2019
Have you sorted this out? Can I close the issue?
scaramallion
on 21 Oct 2019
Yes, thanks.
GavrielHabib123
on 23 Oct 2019
Related issues
 wanghaisheng
·
8Comments
wanghaisheng
·
8Comments
 amandagb
·
8Comments
amandagb
·
8Comments
 Alex97schmid-zeiss
·
3Comments
Alex97schmid-zeiss
·
3Comments
 darcymason
·
9Comments
darcymason
·
9Comments
 aisosalo
·
11Comments
aisosalo
·
11Comments
Most helpful comment
The value of a sequence element in pydicom is a list of zero or more
Datasetobjects, (each item in a sequence element is representated as its ownDataset). So if you wanted to have a sequence containing four items (for example, where each item represented a single graphics object) you'd need a list containing fourDatasetobjects.To get an idea of the typical structure of a DICOM dataset (which resembles a tree), try the following.