Pvlib-python: Wrong values for DNI calculation
Describe the bug
I am calculating a year of DNI values with the DISC model. The highest output values are in the morning hours and not around noon. Looks like a time shift.
In the following table, you can see the mean for every hour of the whole year. GHI and DHI are my input values.
           dni         ghi         dhi
0     0.000000    0.000000    0.000000
1     0.000000    0.000000    0.000000
2     0.000000    0.000000    0.000000
3     0.000000    0.327671    0.302192
4     0.000000   11.089863    8.771507
5   157.377499   49.600274   32.492877
6   293.910088  123.240000   66.184658
7   405.557090  227.243836  103.245753
8   511.518952  335.350137  135.290685
9   520.851959  424.490685  156.915616
10  489.100594  481.686301  171.890685
11  447.388485  509.470137  180.929863
12  381.863784  486.880274  181.015342
13  304.504728  420.844932  169.425205
14  216.274204  321.139726  139.355342
15  127.797036  211.764384  103.553151
16   64.359863  113.658356   61.655890
17   16.287984   45.800548   30.003014
18    0.185598   10.009589    7.995068
19    0.000000    0.311781    0.308219
20    0.000000    0.000000    0.000000
21    0.000000    0.000000    0.000000
22    0.000000    0.000000    0.000000
23    0.000000    0.000000    0.000000
To Reproduce
location = pvlib.location.Location(45.37,
                                                8.25 ,
                                                'UTC',
                                                100,
                                                'ghi_2018')
solar_position = location.get_solarposition(ghi.index)
total_irrad = pd.DataFrame(pvlib.irradiance.disc(
            ghi,
            solar_position['apparent_zenith'],
            ghi.index)['dni'],
                                        index=ghi.index,
                                        columns=['dni'])
total_irrad['ghi'] = ghi
Screenshots

Versions:
pvlib.__version__:
0.6.0pandas.__version__:
0.23.4- python:
3.6
Additional context
Add any other context about the problem here.
 meteoDaniel
All 16 comments
This is a usage question that is better asked at pvlib google group. My guess is that there is some inconsistency between the time averaging of the GHI data and the times associated with each hourly model result. Are your GHI data hourly averages? If so, does the time stamp indicate the beginning of each hour? It is also difficult to reproduce your results without the code that reads the data file and handles the time stamp, including localization.
 cwhanse
on 8 Feb 2019
cwhanse
on 8 Feb 2019
Hi @meteoDaniel, I believe you are missing timezones from your indices. Your Location uses UTC, but your latitude and longitude put you in the central European timezone which is GMT +1.
Try this:
import pandas as pd
import pvlib
from matplotlib import pyplot as plt

plt.ion()

# use "Etc/GMT-1" to get GMT+1 (note opposite sign +/-)
ghi_2018 = pd.read_csv(
    'ghi_2018.csv',
    names=['ghi'],
    parse_dates=True,
    index_col=0
).tz_localize('Etc/GMT-1')

location = pvlib.location.Location(
    45.37,
    8.25 ,
    'Etc/GMT-1',
    100,
    'SanGeronimo-ITALY')

solar_position = location.get_solarposition(ghi_2018.index)

# flatten the ghi_2018 timeseries before using in disc
# it must be 1-d, but the ghi_2018 timeseries is 2-d
disc = pvlib.irradiance.disc(
    ghi_2018.values.flatten(),
    solar_position['apparent_zenith'].values,
    ghi_2018.index)

total_irrad = pd.DataFrame(disc['dni'],index=ghi_2018.index, columns=['dni'])
total_irrad['ghi'] = ghi_2018
total_irrad['hour'] = total_irrad.index.hour
total_irrad.groupby('hour').mean().plot()
plt.grid()
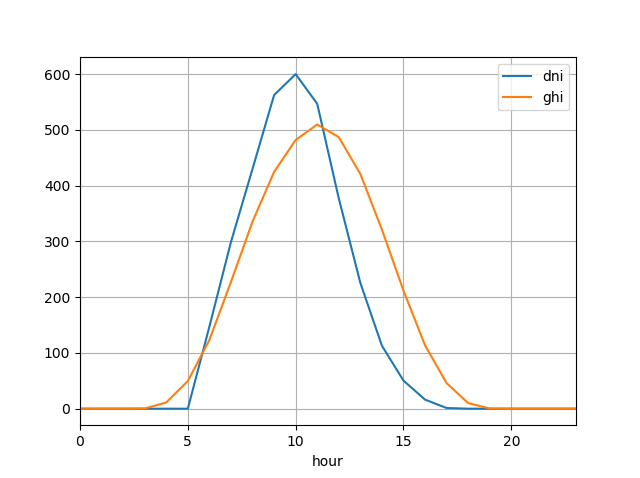
Although I suspect @cwhanse is correct that in addition there is some time averaging going on, because it looks like you are still off by an hour?
 mikofski
on 8 Feb 2019
mikofski
on 8 Feb 2019
My ghi data time stamps are in UTC (Satellite derived). And these are hourly averaged data. It could be possible that we are having end timestamps and the function expects timestamps at the beginning of the hour. But applying +timedelta(hours=1) does not has any effect on the "Time Shift".
But in general I would expect that the calculation is based on the timestamps I parse into the function?!
And @cwhanse: This is the to_csv() output of the dataframe i used there. So if you are parsing this with read_csv you have the dataframe i used there.
meteoDaniel
on 8 Feb 2019
If the timestamps are UTC then @mikofski's example should be changed to
# use "Etc/GMT-1" to get GMT+1 (note opposite sign +/-)
ghi_2018 = pd.read_csv(
    'ghi_2018.csv',
    names=['ghi'],
    parse_dates=True,
    index_col=0
).tz_localize('UTC').tz_convert('Etc/GMT-1')
@meteoDaniel please see if you can reproduce the issue with just a few times.
 wholmgren
on 8 Feb 2019
wholmgren
on 8 Feb 2019
Thanks for your Support. I will try your suggestions on monday when I am Back in office. Whish you all a good weekend.
meteoDaniel
on 8 Feb 2019
Agree with @mikofski and @wholmgren that the timezone needs to be established when the GHI data are read. The Location class does not do that.
I'm also guessing the GHI averages are time stamped at the beginning of the hour. The GHI values are being matched with the solar position at these times, which will overestimate clearness index in the morning, and overestimate in the afternoon, in turn causing a bias in DNI from the DISC model.
cwhanse
on 8 Feb 2019
Dear all,
the timezone of the ghi data I am using is 'UTC'. So If i am having all data in UTC, I think this should not result in a problem. @mikofski solution is not working because I am getting a pytz.exceptions.NonExistentTimeError: 2018-03-25 02:00:00 during localize or convert. I tried several ways of setting timezone. But no success.
At least the point with the averaging could be the reason for this behaviour.
I am in contact with the publisher of the data to find out the correct averaging timestamp and the timezone. I will comeback to you If i am having more information.
meteoDaniel
on 11 Feb 2019
pytz.exceptions.NonExistentTimeError: 2018-03-25 02:00:00
That's daylight savings time. Make sure you are using Etc/GMT-1 or UTC only.
mikofski
on 11 Feb 2019
I can confirm that the data is in UTC and the values are averaged (over 4 quarter hourly values) with a timestamp at the end of the hour.
I checked my file parsing function and deleted a small bug. The original data contains a hour 24, and my dirty solution was to -1 all hours. Now I am parsing it with pd.to_datetime() and localize the index as UTC.
Neverthelesse the Bug is still there. It does not matter if I am setting the timezone to Europe/Rome (or Etc/GMT-1) in the Locationobject and convert the ghi.index or everything is in UTC.
meteoDaniel
on 11 Feb 2019
It does not matter if I am setting the timezone to
Europe/Rome(orEtc/GMT-1) in theLocationobject
The Location.tz attribute does not have any effect on these calculations. That attribute is for user convenience and rarely (never?) used within pvlib. The only thing that pvlib cares about is the tz of your Series/DataFrame.
wholmgren
on 11 Feb 2019
I attached the mean for every hour for 3 experiment (GMT+1. GMT, GMT-1). Hope you can explain the behaviour.
meteoDaniel
on 11 Feb 2019
@meteoDaniel thanks for trying to work this through. Pandas timezones can be tricky.
I think you should consider posting your question on stack overflow or Google groups as explained in getting support. I can't guaranty that you'll find an answer, but with more eyes looking at your issue it may be easier to solve.
Also please consider posting a minimum complete verifiable example that others can use to understand your issue.
A couple of ideas.
- Did you try Will's comment
- Did you try any other decomposition like DIRINT, Erbs, or Liu & Jordan?
- Try SAM
Good luck! Keep trying. Stay positive. I know this can be solved :)
mikofski
on 11 Feb 2019
I agree with @mikofski. This is not a pvlib bug. Addressing usage problems on StackOverflow will be best for the community in the long run.
wholmgren
on 11 Feb 2019
@meteoDaniel please open an issue on StackOverflow or the google group, I have some code to share that shows how DNI and GHI averages align. The issue is with timezone assignment and the hourly averaging.
cwhanse
on 11 Feb 2019
I tried all Others. Always the same behaviour. I think the best Idea actually is using UTC und shifting the timestamp for 30min. I will try it later and tell you.
meteoDaniel
on 12 Feb 2019
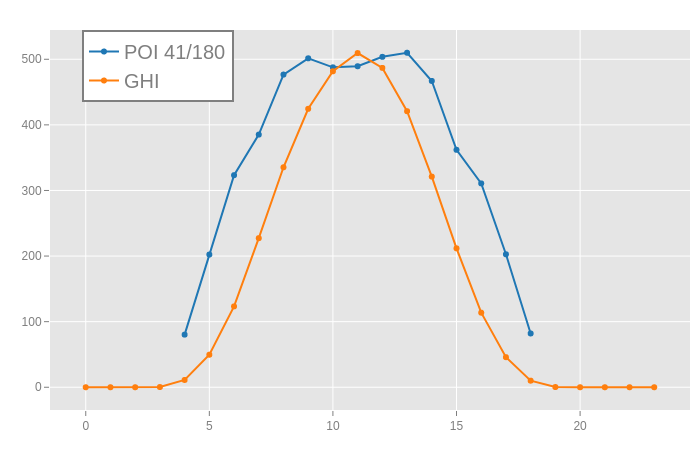
Dear all, thanks for the support. The averaging was the baddy! Since we are using end timestamps i only had to shift the timestamp for 30 minutes in the middle of the hour because this might be the most representativ timestamp for the corresponding value. Thanks a lot. In the end i wanted to simulate singleaxistracker. The result matches my expectations now.
meteoDaniel
on 12 Feb 2019
Related issues
 caseymcgon
·
3Comments
caseymcgon
·
3Comments
 Jawairia123
·
6Comments
Jawairia123
·
6Comments
 dberrian
·
4Comments
dberrian
·
4Comments
 chriswmackey
·
5Comments
chriswmackey
·
5Comments
 cbirkj
·
7Comments
cbirkj
·
7Comments
Most helpful comment
Dear all, thanks for the support. The averaging was the baddy! Since we are using end timestamps i only had to shift the timestamp for 30 minutes in the middle of the hour because this might be the most representativ timestamp for the corresponding value. Thanks a lot. In the end i wanted to simulate singleaxistracker. The result matches my expectations now.
