Puppeteer: Puppeteer slow execution on Cloud Functions
I am experimenting Puppeteer on Cloud Functions.
After a few tests, I noticed that taking a page screenshot of _https://google.com_ takes about 5 seconds on average when deployed on Google Cloud Functions infrastructure, while the same function tested locally (using firebase serve) takes only 2 seconds.
At first sight, I was thinking about a classical cold start issue. Unfortunately, after several consecutive calls, the results remain the same.
Is Puppeteer (transitively Chrome headless) so CPU-intensive that the best '2GB' Cloud Functions class is not powerful enough to achieve the same performance as a middle-class desktop?
Could something else explain the results I am getting? Are there any options that could help to get an execution time that is close to the local test?
Here is the code I use:
import * as functions from 'firebase-functions';
import * as puppeteer from 'puppeteer';

export const capture =
    functions.runWith({memory: '2GB', timeoutSeconds: 60})
        .https.onRequest(async (req, res) => {

    const browser = await puppeteer.launch({
        args: ['--no-sandbox']
    });

    const url = req.query.url;

    if (!url) {
        res.status(400).send(
            'Please provide a URL. Example: ?url=https://example.com');
    }

    try {
        const page = await browser.newPage();
        await page.goto(url, {waitUntil: 'networkidle2'});
        const buffer = await page.screenshot({fullPage: true});
        await browser.close();
        res.type('image/png').send(buffer);
    } catch (e) {
        await browser.close();
        res.status(500).send(e.toString());
    }
});
Deployed with Firebase Functions using NodeJS 8.
 lpellegr
All 63 comments
I have added some probe to measure operations time with console.time.
Here are the results for a local invocation (served by firebase serve):
info: User function triggered, starting execution
info: puppeteer-launch: 87.526ms
info: puppeteer-newpage: 16.353ms
info: puppeteer-page-goto: 1646.293ms
info: puppeteer-page-screenshot: 82.034ms
info: send-buffer: 0.282ms
info: Execution took 1835 ms, user function completed successfully
info: puppeteer-close: 5.214ms
The same for an invocation on Cloud Functions:
Function execution started
puppeteer-launch: 868.091ms
puppeteer-newpage: 1113.722ms
puppeteer-page-goto: 3079.503ms
puppeteer-page-screenshot: 353.134ms
Function execution took 5427 ms, finished with status code: 200
puppeteer-close: 61.146ms
send-buffer: 63.057ms
if I compare both:
- _puppeteer-launch_ is 10 times slower on Cloud Functions.
- _puppeteer-newpage_ is 70 times slower!
- _puppeteer-page-goto_ takes almost twice more.
- _puppeteer-page-screenshot_ is 4 times slower on Cloud Functions.
I can understand why the launch is slower on Cloud Functions, even after multiple runs since the hardware is quite different from a middle-class desktop computer. However, what about time differences for newPage and goto?
lpellegr
on 22 Aug 2018
@ebidel I saw you have written some experiments for Puppeter on Cloud Functions recently. Did you experience the same behaviour? do you have an idea about what could explain such a difference?
I noticed your nice try Puppeteer example deployed using a custom Docker environment does not suffer from this issue. Taking a screenshot requires about 2 seconds only, as for my local environment.
lpellegr
on 22 Aug 2018
I have similar results on GCF. Most of the slowdown seems to happen on screenshot and pdf calls for me. Similar code with modified Chrome for lambda environment runs fine on AWS Lambda with same resources so it's not related to memory.
BTW, things I tried;
- setting
pipe: true- no effect - disabling shm - no effect
- using the base64 encoded output directly (maybe decoding is slow somethow?) - no effect
- different regions - nah
- older puppeteer versions - nope
Maybe GCF CPU allocation is this bad. That would require benchmarking other stuff.
 eknkc
on 22 Aug 2018
eknkc
on 22 Aug 2018
@eknkc Thanks for sharing your experiments.
Here are the options I tried too. None are helping:
const browser = await puppeteer.launch({
headless: true,
args: [
'--disable-gpu',
'--disable-setuid-sandbox',
'--no-sandbox',
'--proxy-server="direct://"',
'--proxy-bypass-list=*'
]
});
As a quick test, I switched the function memory allocation to 1GB from 2GB. Based on the pricing documentation, this moves the CPU allocation to 1.4 GHz from 2.4 GHz.
Using 1GB function, taking a simple screenshot on Cloud Functions takes about 8s! The time increase seems to be a direct function of the CPU allocation :x
Maybe there is a magic option to get better timing and have Puppeteer really usable on production with Cloud Functions?
lpellegr
on 22 Aug 2018
Thanks for the report. I've passed this info off to the Cloud team since it's really their bug.
There's a known bug with GCF atm where the first few requests always hit cold starts. That could be causing a lot of the slowdown. But generally, GCF does not have the same performance characteristics that something like App Engine Standard or Flex have (my try puppeteer demo). Since you can only change the memory class, that also limits headless Chrome.
Another optimization is to launch chrome once and reuse it across requests. See the snippet from the blog post: https://cloud.google.com/blog/products/gcp/introducing-headless-chrome-support-in-cloud-functions-and-app-engine
 ebidel
on 22 Aug 2018
ebidel
on 22 Aug 2018
@ebidel Thanks. Is there a public link for the issue so that I can track the progress/discussion?
lpellegr
on 22 Aug 2018
Unfortunately, not one I'm aware of. Will post updates here when I hear something.
ebidel
on 22 Aug 2018
OK. Thanks :)
lpellegr
on 23 Aug 2018
Currently, there's a read-only filesystem is place that's hurting the performance based on our tests. The cloud team is working on optimizations to make things faster.
Another thing to try is to bundle your file so large loading deps are reduced e.g. require('puppteeter') gets inlined.
ebidel
on 23 Aug 2018
Thanks @ebidel for the investigation.
Speaking for my case though, the performance issue is not related to the startup but rather happen during runtime so inlining would not change that I assume?
It seems like the chrome instance that is already running struggles with large viewports or simply capturing the page. That operation happens to use a lot of shared memory which might be causing the issue.
Anyway, hope we can have it resolved. Thanks again.
eknkc
on 23 Aug 2018
That's been my experience as well.
Capturing full page screenshots, on large viewports, at DPR > 1 is intensive. It appears to be especially bad on Linux: https://github.com/GoogleChrome/puppeteer/issues/736
ebidel
on 23 Aug 2018
This combination improves a little the speed:
const browser = await puppeteer.launch({args: [
'--disable-gpu',
'--disable-dev-shm-usage',
'--disable-setuid-sandbox',
'--no-first-run',
'--no-sandbox',
'--no-zygote',
'--single-process', // <- this one doesn't works in Windows
]});
I'm getting loading times of 3 seconds in local and 13 seconds in GCF.
 wiliam-paradox
on 23 Aug 2018
wiliam-paradox
on 23 Aug 2018
I guess some improvements are made, I don't see long waiting times. I did use @wiliam-paradox options though.
 bogacg
on 5 Sep 2018
bogacg
on 5 Sep 2018
Experiencing this slowness as well. Anyone have suggestions on what to do to boost the speed in GCF? Local runs under 500ms, while when deployed to GCF takes 8-12 seconds.
 samginn
on 12 Sep 2018
samginn
on 12 Sep 2018
I'm experiencing the same but at AWS Lambda, where requests are reaching the timeout while the same requests from my local are fine and under expected time.
 Kikobeats
on 12 Sep 2018
Kikobeats
on 12 Sep 2018
Are you guys running puppeteer in HEADFUL mode on Cloud Functions? Running in headless mode is working fine but I need to run headful to be able to download PDF files. =/
Error: function execution failed. Details:
Failed to launch chrome!
[12:12:0913/012114.601900:ERROR:browser_main_loop.cc(596)] Failed to put Xlib into threaded mode.
(chrome:12): Gtk-WARNING **: 01:21:14.702: cannot open display:
 cirdes
on 13 Sep 2018
cirdes
on 13 Sep 2018
Thanks for the report. I've passed this info off to the Cloud team since it's really their bug.
There's a known bug with GCF atm where the first few requests always hit cold starts. That could be causing a lot of the slowdown. But generally, GCF does not have the same performance characteristics that something like App Engine Standard or Flex have (my try puppeteer demo). Since you can only change the memory class, that also limits headless Chrome.
Another optimization is to launch chrome once and reuse it across requests. See the snippet from the blog post: https://cloud.google.com/blog/products/gcp/introducing-headless-chrome-support-in-cloud-functions-and-app-engine
I'm trying to launch chrome just once exactly the way on snippet but I'm getting Function execution took 54 ms, finished with status: 'connection error' on the second run. Also running my tests with Jest the process doesn't exit the process. Closing and opening the browser between requests work fine.
cirdes
on 13 Sep 2018
@joelgriffith The reported issue is not about Chrome startup time but the full execution time. So sad to write promotional messages without even reading the issue purpose.
lpellegr
on 14 Sep 2018
Any update on this? GCF is executing any given Puppeteer action at perhaps 25% ~ 50% of my local desktop speed.
 dimavolo
on 27 Sep 2018
dimavolo
on 27 Sep 2018
@DimaFromCanada none that I've seen. To be clear, are you talking about total time (cold start + execution) or just running your handler code?
ebidel
on 27 Sep 2018
Cold start adds time of course, but I'm talking about handler code running
very slowly as well. Particularly page.goto() calls.
Compared to a local machine or a VPS, I'm finding Puppeteer on GCF to be 2x
- 4x slower.
On Fri, Sep 28, 2018 at 1:00 AM Eric Bidelman notifications@github.com
wrote:
@DimaFromCanada https://github.com/DimaFromCanada none that I've seen.
To be clear, are you talking about total time (cold start + execution) or
just running your handler code?—
You are receiving this because you were mentioned.
Reply to this email directly, view it on GitHub
https://github.com/GoogleChrome/puppeteer/issues/3120#issuecomment-425147806,
or mute the thread
https://github.com/notifications/unsubscribe-auth/AK5OkHJU8n7tNz8OaVNbLhAI2UJOm3ATks5ufPYxgaJpZM4WHOhH
.
--
DimaVolo.ca http://DimaVolo.ca?ref=email_sig
[email protected]
(917) 512-3119 <9175123119>
dimavolo
on 27 Sep 2018
Any URL you can share? I can pass that along to the Cloud team.
ebidel
on 27 Sep 2018
A response time in seconds for the same code running with Puppeteer on AWS Lambdas vs GCP Functions with twice more memory:

The code uses one goto(), which consumes most of the time, to get some HTML / JS / CSS files from GCP Storage and one evaluate() to get the rendered DOM.
 exAspArk
on 9 Oct 2018
exAspArk
on 9 Oct 2018
@lpellegr Very nice to see this brought up.
I've been facing the same pain for a while but always thought it would be closed as "won't fix".
I have a quite extensive puppeteer setup on AWS Lambda and I've been playing around with running puppeteer on Firebase/Google Cloud Functions for a while, even before support for Node 8.10 was announced. You can check the _hack_ I did back then here (unmaintained).
A run a proxyfied authentication service (user logs in into my website, that in turn uses puppeteer to check if he can authenticate with the same credentials on a third-party website), where execution speed of puppeteer will directly affect the user experience. Nothing fancy like screenshots or PDF, just a login flow.
Most of my architecture lives on Firebase, so it would be very convenient for me to run everything there, puppeteer included - this would help with the spaghetti-like fan-out architecture I'm forced to adopt due to Lambda limitations. However, the performance of GCF/FCF is so inferior compared to AWS Lambda that I cannot bring myself to make the switch.
Even after support for specifying closer regions and Node 8.10 was released on FCF, a 2GB Cloud Function will still be less performant than a 1GB Lambda: ~4s vs 10+ seconds! And Lambda even has the handicap of having to decompress the chromium binary (0.7 seconds, see chrome-aws-lambda).
And from my extensive testing I can tell this is not due to cold-starts.
I suspect the problem is more related in the differences between AWS and Google in the way the CPU shares and bandwidth are allocated in proportion to the amount of RAM defined. I can't be sure obviously, but I read a blog post a few months ago (can no longer find it) with very comprehensive tests on the big three (AWS, Google, Azure) that seem to reflect this suspicion - AWS is more "generous" in allocation.
Obviously, this doesn't seem to be a problem of puppeteer itself, but since Google is trying hard to scale up it's serverless game (and still playing catch-up it seems) it would be awesome if you could nudge some colleague at Google to look into this @ebidel - my current AWS infrastructure relies on hundreds of lines of Ansible and Terraform code as well as a couple Makefiles to keep everything together.
Switching to the no-frills approach of just writing triggers for Cloud Functions and listing dependencies (amazing work on this BTW) would make my life a lot easier. If only the performance was (a lot) better...
 alixaxel
on 13 Oct 2018
alixaxel
on 13 Oct 2018
Google Cloud PM here.
Part of the slowness comes from the fact that the filesystem on Cloud Functions is read only.
We noticed that Chrome tries a lot to write in different places, and failures doing so results in slowness.
We confirm that by enabling a writable filesystem, performances improve. However, at this time, we are not planning to enable a writable filesystem on GCF apart from /tmp.
We asked the Chromium team for help to better understand how we could configure it to not try to write outside of /tmp, as of now, we are pending guidance.
 steren
on 13 Oct 2018
steren
on 13 Oct 2018
@steren AWS has the same limitation, you only get a fixed 500MB on /tmp regardless of how much memory you allocate to Lambda.
On the other hand GCF/FCF is memory-mapped:
This is a local disk mount point known as a "tmpfs" volume in which data written to the volume is stored in memory. Note that it will consume memory resources provisioned for the function.
So even if GCF was running on HDDs and Lambda on SSDs, it still wouldn't explain the huge discrepancies in performance we are seeing.
alixaxel
on 13 Oct 2018
@steren @ebidel
So I just cooked up the simplest possible benchmark to test only the CPU (no disk I/O or networking).
Here's what I came up with:
const sieveOfErathosthenes = require('sieve-of-eratosthenes');
console.time('sieve');
console.log(sieveOfErathosthenes(33554432).length === 2063689);
console.timeEnd('sieve');
I deployed this function on both AWS Lambda, and Firebase Cloud Functions (both using Node 8.10).
Then I serially called the Lambda/Cloud Function and noted down the times. No warm-up was done.
| | FCF 2GB | AWS 2GB | FCF 1GB | AWS 1GB |
| ----------- | -------- | -------- | -------- | -------- |
| 1 | 5089 | 2519 | 6402 | 4036 |
| 2 | 5089 | 2693 | ERROR | 4278 |
| 3 | 5089 | 2753 | 4283 | 4525 |
| 4 | 4236 | 2554 | ERROR | 4430 |
| 5 | 3954 | 2671 | 4379 | 4417 |
| 6 | ERROR | 2717 | ERROR | 4409 |
| 7 | 3931 | 2726 | 4331 | 4447 |
| 8 | ERROR | 2725 | ERROR | 4393 |
| 9 | 4132 | 2714 | 4015 | 4456 |
| 10 | ERROR | 2723 | ERROR | 4405 |
| 11 | 3771 | 2730 | 4123 | 4389 |
| 12 | ERROR | 2722 | ERROR | 4431 |
| 13 | 4235 | 2725 | 4397 | 4445 |
| 14 | 4051 | 2732 | ERROR | 4418 |
| 15 | 4427 | 2707 | 4681 | 4452 |
| 16 | 4006 | 2715 | ERROR | 4442 |
| 17 | ERROR | 2732 | 4422 | 4289 |
| 18 | 3685 | 2725 | ERROR | 4401 |
| 19 | ERROR | 2718 | 4585 | 4379 |
| 20 | 3890 | 2719 | ERROR | 4402 |
| 21 | ERROR | 2797 | 4220 | 4415 |
| 22 | 4073 | 2795 | ERROR | 4452 |
| | | | | |
| MEDIAN | 4073 | 2722.5 | 4379 | 4416 |
| AVERAGE | 4243.867 | 2709.636 | 4530.727 | 4395.955 |
| STDEVP | 458.620 | 61.097 | 618.645 | 93.646 |
| STDEVPA | 2012.616 | 61.097 | 2307.213 | 93.646 |
The 1GB Lambda is on-par with the 2GB FCF - although with much more consistent timings and no errors.
Weirdly enough, the errors reported on 1GB FCF were:
Error: memory limit exceeded. Function invocation was interrupted.
Not sure why that happens intermittently for a deterministic function. As for the 2GB FCF, the errors were:
finished with status: 'connection error'
Similar results are reported on papers such as (there are quite a few!):
- Benchmarking Heterogeneous Cloud Functions
- Performance Evaluation of Parallel Cloud Functions
PS: Sorry if this is unrelated to PPTR itself, I'm just trying to suggest that CPU performance could be an important factor that explains why puppeteer performs so badly under GCF/FCF.
alixaxel
on 13 Oct 2018
@alixaxel For sure CPU plays an important part. However, as Google team members said, CPU is not the cause of the issue here. If you look at /proc/cpuinfo for a 2GB function/lambda allocated with Firebase function/Amazon you will see that Google allocates 4 CPUs whereas Amazon uses 2 only. Even if the frequency of the CPUs is a bit higher on Amazon it does not explain the time difference. I would even expect better timing with GCP since more CPUs allow better parallelism which seems highly used by Chrome (correct me if I am wrong).
To convince me I also made a test some weeks ago by creating a Docker image with a read/write filesystem and the puppeteer NPM dependency pre-installed, all, running in GCP kubernetes with nodes having a similar CPU allocation as a 2GB function. The results show acceptable times.
Hope we can get a guidance soon about how to configure chrome headless to write to /tmp only with Cloud functions.
Another solution seems to get access to the alpha container as a service feature on Cloud functions. In that case a simple solution could be to use a Docker image similar to the one I used with Kubernetes. Currently, it's my dream. Hope it can become a reality.
lpellegr
on 13 Oct 2018
As I mentioned, we observed that the slowness with Headless Chrome are different from traditional CPU/memory benchmarks.
I would be glad to invite you to the Alpha of serverless containers on the Cloud Function infrastructure so that you could perform more testing. Please fill in this form http://g.co/serverlesscontainers and mention "Headless Chrome" in the "use case" field. I should be able to invite you next week.
steren
on 13 Oct 2018
@steren Thanks a lot for the invite, looking forward to it.
@lpellegr I was referring to CPU _shares_, as in --cpu-shares Docker flag:
Set this flag to a value greater or less than the default of 1024 to increase or reduce the container’s weight, and give it access to a greater or lesser proportion of the host machine’s CPU cycles. This is only enforced when CPU cycles are constrained. When plenty of CPU cycles are available, all containers use as much CPU as they need. In that way, this is a soft limit. --cpu-shares does not prevent containers from being scheduled in swarm mode. It prioritizes container CPU resources for the available CPU cycles. It does not guarantee or reserve any specific CPU access.
Obviously it's just a guess since FaaS are a blackbox to us mere mortals. But given that the read-only FS is equally present on Lambda, it seems like a weird source to justify the for the discrepancy we see.
alixaxel
on 13 Oct 2018
@ebidel I was under the impression that if used with --disable-dev-shm-usage and userDataDir was pointing to /tmp (as PPTR does), then Chromium wouldn't create any additional files outside of /tmp?
alixaxel
on 13 Oct 2018
That I'm not sure of. I would assume since the chromium distro/deps that's installed on the GCF machines lives outside of /tmp, Chrome is probably writing other stuff there unrelated to user data.
So just because you write user data to /tmp doesn't mean that's the only thing that's being stored there.
It would be nice if someone could confirm where writes are happening.
ebidel
on 16 Oct 2018
@ebidel So if I would run the standalone headless binary I compile for Lambda (it's compatible with GCF) under /tmp should I expect that it only tries to write to /tmp and therefore shouldn't have the IO performance penalty?
alixaxel
on 16 Oct 2018
Or actually... I can just install puppeteer on my local and watch which files it touches with strace or something right?
alixaxel
on 16 Oct 2018
When you use puppeteer on GCF it installs a local version of chromium into ./node-modules. So probably touching files there. @steren would that fall under the I/O perf issues?
I would try this:
- Test on Linux (GCF's env). You could try running things inside docker container to replicate. Example Dockerfile here.
- Call
puppeteer.launch({userDataDir: '/tmp', args: ['--disable-dev-shm-usage']}). Hopefully that writes anything and everything to/tmp. - Setup a file watcher to see what directories are being written to...
ebidel
on 17 Oct 2018
Executing the following on GCF:
exports.dir = (req, res) => {
res.status(200).send(__dirname);
};
Gives me: /srv
So puppeteer and its downloaded Chromium lives in the /srv/node_modules. And this is not a writable location.
+1 to investigate exactly where is Chrome trying to write.
steren
on 17 Oct 2018
Any news on this ? It would be nice if GCF could run puppeteer correctly. I tried to launch chrome with the userDataDir: '/tmp' option but it doesn't seem to have any effect on performance.
 TimotheeJeannin
on 29 Oct 2018
TimotheeJeannin
on 29 Oct 2018
I tried to copy the whole chrome folder to the /tmp directory and launch chrome from there.
const fs = require('fs-extra');
if (!fs.existsSync('/tmp/chrome-linux')) {
let chromeFolder = fs.readdirSync(__dirname + '/node_modules/puppeteer/.local-chromium')[0];
fs.copySync(
__dirname + '/node_modules/puppeteer/.local-chromium/' + chromeFolder + '/chrome-linux',
'/tmp/chrome-linux')
}
if (!browser) {
console.warn('Launching browser.');
browser = await puppeteer.launch({
userDataDir: '/tmp/testing',
executablePath: '/tmp/chrome-linux/chrome',
args: ['--no-sandbox']
});
}
From the performance mesurments I made, this changes nothing, GCF is still at least two times slower than AWS Lambda.
TimotheeJeannin
on 29 Oct 2018
@TimotheeJeannin I also ran the Chromium I compile for AWS with the exact same approach / paths and everything. And, all things being equal, GCF is way slower. I don't know why Google devs are trying to dismiss this issue as a disk I/O issue, if that was the case the Sieve of Eratosthenes I shared before would have no justification for being so slow as well.
alixaxel
on 29 Oct 2018
@lpellegr /proc/cpuinfo is always shows 4 CPUs on GCF, and os.cpus() always shows the 8 hyperthreads, regarless of "instance size".
A bit annoying actually since some apps will use this to decide how many threads they'll create for a CPU intensive job, and a 128 MB function for sure won't be allowed to tax all 8 of the host's hyperthreads.
In situations where I launch a CPU/memory intensive sub-process, I've got to a point where I can't even kill the sub-process. Then my function eventually times out, container is "suspended", and when another request comes in, container is "reused", old process is still running, and I still can't kill it.
 ncruces
on 19 Nov 2018
ncruces
on 19 Nov 2018
@ebidel Any updates on this problem?
We want to move our project from AWS Lambda to Google Cloud functions. Actually, we completed migration. But we are waiting for this issue.
 bahattincinic
on 30 Nov 2018
bahattincinic
on 30 Nov 2018
Same here. We wanted to migrate from AWS Lambda to GCF because the underlying linux distribution used by AWS Lambda is a pain to work with. We did quite extensive stress tests on GCF and we experienced extremly slow functions compared to AWS Lambda. It's so much slower than it's currently not possible for us to migrate even if we would prefer to work with the underlying linux distribution GCF uses.
TimotheeJeannin
on 30 Nov 2018
@steren I assume you were the one who marketed this back in August with this blog post: https://cloud.google.com/blog/products/gcp/introducing-headless-chrome-support-in-cloud-functions-and-app-engine
Isn't it a bit awkward to push a product to masses without actually testing performance aspect of it, especially in a product (Cloud Functions) that people would like to use it at scale?
 baratrion
on 13 Dec 2018
baratrion
on 13 Dec 2018
Many customers are successfully using puppeteer on Cloud Functions or App Engine.
We tested headless Chrome performances and were aware of them before publishing the blog post. To sum up: let's say that this is part of the current tradeoff of using our pay-for-usage fast-scaling managed compute products (Cloud Functions and App Engine standard environment)
If performance is what you are optimizing for, Google Cloud Platform has many other compute options that allow you to run puppeteer with better performances: take a look at the App Engine flexible environment, Google Kubernetes Engine or just a Compute Engine VM
steren
on 15 Dec 2018
I ran some benchmarks again with chrome-aws-lambda and I noticed some improvements on Firebase.
The average timings I got with multiple URLs and warmed up functions were:
puppeteer(2684 ms on Firebase 1GB)chrome-aws-lambda(1675 ms on Firebase 1GB)chrome-aws-lambda(1154 ms on AWS Lambda 1GB)
With chrome-aws-lambda, FCFs are "only" 45% slower than Lambdas (compared to 130%+ when using puppeteer). In light of this, I've added support for GCFs to my package, if anyone wants to try it out:
npm i chrome-aws-lambda iltorb puppeteer-core
Sample code (you need Node 8 runtime for it):
const chromium = require('chrome-aws-lambda');
const puppeteer = require('puppeteer-core');
const functions = require('firebase-functions');

const options = {
  memory: '2GB',
  timeoutSeconds: 300,
};

exports.chrome = functions.runWith(options).https.onRequest(async (request, response) => {
  let result = null;
  let browser = null;

  try {
    browser = await puppeteer.launch({
      args: chromium.args,
      defaultViewport: chromium.defaultViewport,
      executablePath: await chromium.executablePath,
      headless: chromium.headless,
    });

    let page = await browser.newPage();

    await page.goto(request.query.url || 'https://example.com');

    result = await page.title();
  } catch (error) {
    throw error;
  } finally {
    if (browser !== null) {
      await browser.close();
    }
  }

  return response.send(result);
});
I can also confirm that using chrome-aws-lambda with puppeteer-core on firebase functions yields a significant speedup
 jineshshah36
on 18 Jan 2019
jineshshah36
on 18 Jan 2019
I can confirm significant improvements in Firebase Functions / GCF. Enough so that I’m now using it in several mission critical production workflows for several weeks now.
@steren if helpful for future launches, I’m grateful for the announcement with the known issues and the follow up improvements. This allowed for me to build based on the documentation and deploy based on the project requirements as improvements have been made (still some to go :)
I don’t think you need to defend the state at launch, especially given the open approach the team has taken to acknowledgement and improvements.
 kylewill
on 19 Jan 2019
kylewill
on 19 Jan 2019
npm i chrome-aws-lambda ilotorb puppeteer-coreMany thanks for the alternative, mate! I guess, fixing a typo in
iltorb(instead of ilotorb) may save some time for other folks.
 yzalvov
on 29 Jan 2019
yzalvov
on 29 Jan 2019
Thank you for the tip on speeding up Puppeteer on FCF.
Is there a way to test this function locally using firebase serve --only functions on a MAC?
I am getting the following error:
UnhandledPromiseRejectionWarning: Error: Failed to launch chrome!
/tmp/chromium: /tmp/chromium: cannot execute binary file


TROUBLESHOOTING: https://github.com/GoogleChrome/puppeteer/blob/master/docs/troubleshooting.md
which lists troubleshooting for Linux.
How are people using MAC OS testing this implementation?
 gyoon-dev
on 9 Feb 2019
gyoon-dev
on 9 Feb 2019
https://github.com/GoogleChrome/puppeteer/issues/3120#issuecomment-450575911
I can confirm that this works.
Before using chrome-adw-lambdamy screenshots were rendered in about 12 second. After it went down to about 2 seconds. That's about 500% faster!
 comwidedigital
on 23 Feb 2019
comwidedigital
on 23 Feb 2019
@alixaxel I'm curious as to why chrome-aws-lambda is giving better results; are the chrome binaries compiled differently to those that Puppeteer downloads? Does this performance increase only affect cold starts?
 Robula
on 29 May 2019
Robula
on 29 May 2019
@Robula Besides shipping with less resources, chrome-aws-lambda is a headless-only build. That by itself should already explain some gains, but if you read the discussion above, making /tmp it's home should also be beneficial in GCF context. But I'm just guessing here, I don't have any concrete data to back it up.
alixaxel
on 29 May 2019
Just wanted to add some details on how to run the code below locally (on Ubuntu, in my case) and on Firebase :point_down:
executablePath: await chromium.executablePath
First, install Chromium, with your usual package manager (ex: apt install chromium-browser -Y).
Then, check where did it installed with whereis chromium-browser, it should be something like /usr/bin/chromium-browser
Create a .runtimeconfig.json into your app_folder_repo/functions like that one
{
  "app": {
    "firebase_chromium_exe_path": "/usr/bin/chromium-browser"
  }
}
Then in your code, you can run
const local_vars = functions.config()
[...]
executablePath: local_vars.app.firebase_chromium_exe_path || await chromium.executablePath
Try it locally with firebase emulators:start --only functions
Deploy it on Firebase with firebase deploy --only functions :rocket:
It should now work on both environments ! :confetti_ball:
 kissu
on 1 Jul 2019
kissu
on 1 Jul 2019
followed above trick, but getting this on Mac OS
i  functions: Beginning execution of "export-chrome"
>  { app: { firebase_chromium_exe_path: '/Applications/Chromium.app' } }
⚠  functions: TypeError: input.on is not a function
    at new Interface (readline.js:207:11)
    at Object.createInterface (readline.js:75:10)
    at Promise (/Users/rakhi/Documents/Office/cloud-functions/functions/node_modules/puppeteer-core/lib/Launcher.js:333:25)
    at new Promise (<anonymous>)
    at waitForWSEndpoint (/Users/rakhi/Documents/Office/cloud-functions/functions/node_modules/puppeteer-core/lib/Launcher.js:332:10)
    at Launcher.launch (/Users/rakhi/Documents/Office/cloud-functions/functions/node_modules/puppeteer-core/lib/Launcher.js:176:41)
⚠  Your function was killed because it raised an unhandled error.
 xerosanyam
on 19 Sep 2019
xerosanyam
on 19 Sep 2019
For Mac OS
visit, chrome://version/ & see the Executable Path path field to get the Chromium path.
It would be something like /Applications/Chromium.app/Contents/MacOS/Chromium
so, this makes it work locally on Mac
executablePath: '/Applications/Chromium.app/Contents/MacOS/Chromium'
xerosanyam
on 20 Sep 2019
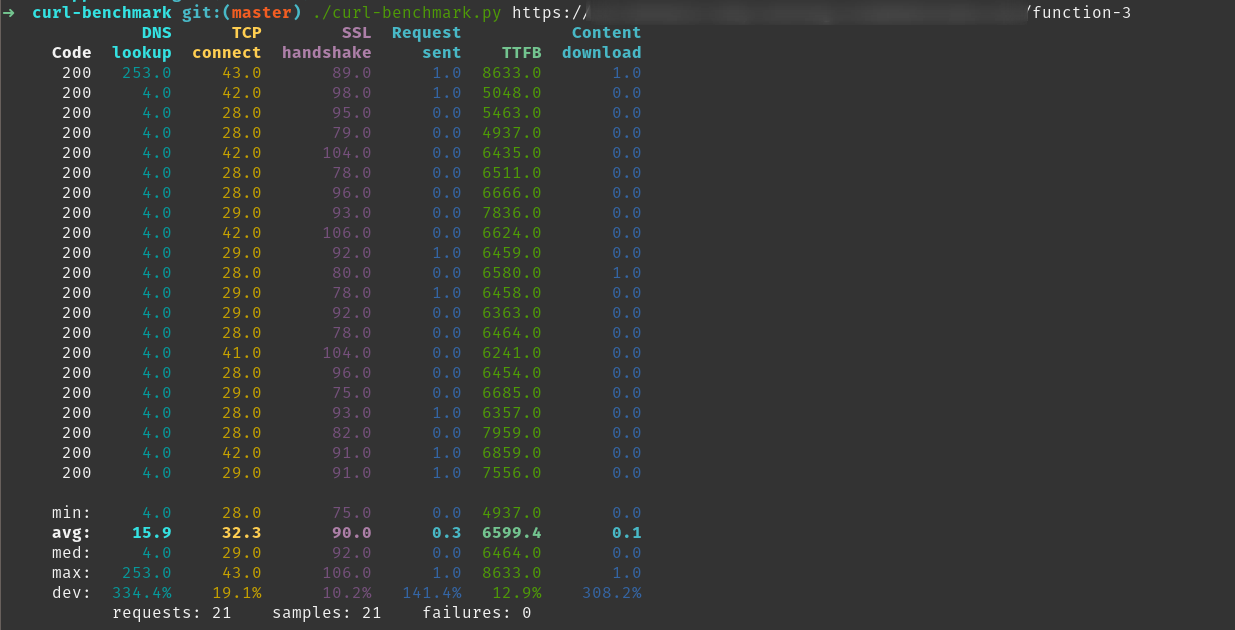
Here are my benchmarks using Cloud Run, Cloud Functions and the Kubernetes/Any other server.
Cloud run is 2x slower, Cloud functions are 6-10x slower compared to a normal always-on server.
Tasks performed:
- Open browser
- Load example.com
- Get title
Benchmarks:
Kubernetes/Server
Mainly this would mean high availability, no cold start, though it defeats the purpose of serverless, the comparison is just to show how Cloud Functions are doing compared to this.

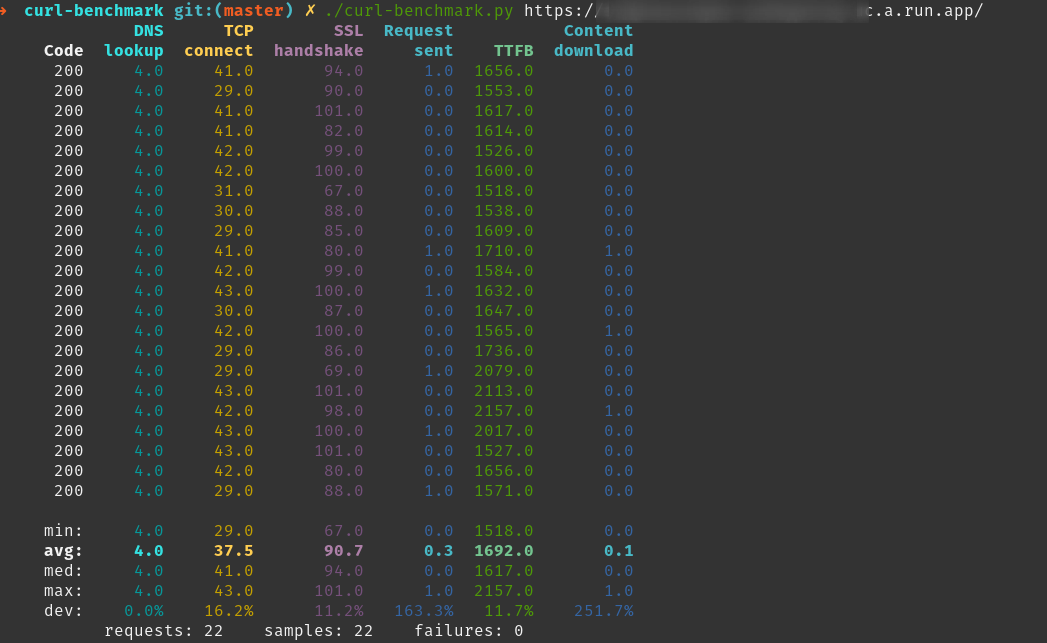
Cloud Run
It's slower, and understandable. Got much more flexibility than Cloud Functions as well.

Cloud Functions
Never mind the cold start, it was extremely painful to watch. No matter what kind of optimizations are put, just opening the browser takes most of the time.

If anyone runs a test with chrome-aws-lambda, it will be nice.
 entrptaher
on 7 Nov 2019
entrptaher
on 7 Nov 2019
@entrptaher pass me the test script and I'll see what I can do. I run https://checklyhq.com and run a ton of AWS Lambda based Puppeteer runs.
 tnolet
on 8 Nov 2019
tnolet
on 8 Nov 2019
I tested with puppeteersandbox (which is the one you have on aws lambda), and that reported me around 1000ms (endTime - startTime). A benchmark with ./curl-benchmark.py would be much nicer :D to look.
I will also mention, All of them were allocated 512MB ram and at most 250-280MB were used. At first it were using less ram, but then started to increase on further deployments.
Here you go, the code. I removed as many things as I could to keep it simple.
index.js
const puppeteer = require("puppeteer");

const scraper = async () => {
  const browser = await puppeteer.launch({args: [
    '--no-sandbox',
    '--disable-setuid-sandbox',
    '--disable-dev-shm-usage'
  ]});

  const page = await browser.newPage();
  await page.goto("https://example.com");
  const title = await page.title();
  await browser.close();
  return title
};

exports.helloWorld = async (req, res) => {
  const title = await scraper();
  res.send({ title });
};
package.json
{
  "name": "helloworld",
  "version": "1.0.0",
  "description": "Simple hello world sample in Node",
  "main": "index.js",
  "scripts": {
    "start": "functions-framework --target=helloWorld"
  },
  "dependencies": {
    "@google-cloud/functions-framework": "^1.3.2",
    "puppeteer": "^2.0.0",
  }
}
Without functions-framework
Cloud Functions
On the previous benchmark, I was using functions-framework, which is a small overhead for handling requests on port 8080.
Once again, here are the results,
The benchmark doesn't change much even if you remove functions-framework. It gets 2 second faster. However this still does not justify the 4 second response, which is 4x time the normal aws response.

Cloud Run
I removed functions-framework and added express, which is a lower overhead. We can try vanilla js as well.
Code:
const express = require('express');
const app = express();

app.get("/", async (req, res) => {
  const title = await scraper();
  res.send({ title });
});

const port = process.env.PORT || 8080;
const server = app.listen(port, () => {
  const details = server.address();
  console.info(`server listening on ${details.port}`);
});
Result:
entrptaher
on 8 Nov 2019
@entrptaher Great that you used https://puppeteersandbox.com
Even without the curl benchmark, this shows a sub 1000ms execution on most runs.
Note, puppeteer sandbox uses 1478MB's of RAM on each run, so that will have an effect.
For those who want to give it a try, I saved this script with added timing:
tnolet
on 9 Nov 2019
I used 512mb on my run. Having 1500mb will definitely have a greater effect but that kinda defeats the purpose of the whole benchmark thing on a example.com website. Can you try to benchmark with 512mb limit ? 😁
entrptaher
on 10 Nov 2019
For Mac OS
visit, chrome://version/ & see theExecutable Pathpath field to get the Chromium path.
It would be something like/Applications/Chromium.app/Contents/MacOS/Chromiumso, this makes it work locally on Mac
executablePath: '/Applications/Chromium.app/Contents/MacOS/Chromium'
In order to get this to work locally on my mac, and on production deployment i had to check for the "local_vars.app" first or it would crash on production. Hope this helps someone else...
    const browser = await puppeteer.launch({
      args: chromium.args,
      defaultViewport: chromium.defaultViewport,
      executablePath: local_vars.app
        ? local_vars.app.firebase_chromium_exe_path
        : await chromium.executablePath,
      headless: chromium.headless
    });
 jmgunter
on 3 Feb 2020
jmgunter
on 3 Feb 2020
I didn't do any deep profiling but at least in my case the bottleneck seems to be the CPU. I used Cloud Run, when deployed with single CPU duration was around 20 seconds, and once I allocated 2 CPUs, it was reduced to around 10 seconds, and on my computer (i7 with 4 cores) I get around 5 seconds.
I published like this:
gcloud run deploy test --image gcr.io/test/test --memory 1G --cpu 2
Unfortunately, seems you cannot increase Cloud Run containers allocated CPUs beyond 2. And for Cloud Functions I did not find any way to control the number of the CPUs allocated.
 sinapis
on 14 Feb 2020
sinapis
on 14 Feb 2020
Any updates on this from the Google Team or has anyone cracked this? I'm a first time user of puppeteer and trying to glue up puppeteer-core, puppeteer-extra, puppeteer-cluster, (and apparently now chrome-aws-lambda) in Firebase Functions and the performance is disappointing to say the least...
 deldrid1
on 10 Aug 2020
deldrid1
on 10 Aug 2020
Related issues
 rlog
·
78Comments
rlog
·
78Comments
 fortes
·
191Comments
fortes
·
191Comments
 ivibe
·
79Comments
ivibe
·
79Comments
 vsemozhetbyt
·
69Comments
vsemozhetbyt
·
69Comments
 JaLe29
·
58Comments
JaLe29
·
58Comments
Most helpful comment
I ran some benchmarks again with chrome-aws-lambda and I noticed some improvements on Firebase.
The average timings I got with multiple URLs and warmed up functions were:
puppeteer(2684 ms on Firebase 1GB)chrome-aws-lambda(1675 ms on Firebase 1GB)chrome-aws-lambda(1154 ms on AWS Lambda 1GB)With
chrome-aws-lambda, FCFs are "only" 45% slower than Lambdas (compared to 130%+ when usingpuppeteer). In light of this, I've added support for GCFs to my package, if anyone wants to try it out:Sample code (you need Node 8 runtime for it):