Pulsar: Unable to consume messages, need to re-subscribe client
This is similar to issue 2013. We have several shared subscriptions of partitioned topics and we found some cases where a subscription's client is not receiving messages, but it's not related to a specific topic partition.
In this case, if we re-subscribe the client (PulsarClient.subscribeAsync), messages start to be delivered as expected.
Client logs this warn:
[log_time:16:17:42.377] [thread:pulsar-timer-6-1] [level:WARN ] [logger:UnAckedMessageTracker] - [ConsumerBase{subscription='picking-consumer-prod.fbm-wms-picking', consumerName='i-08e97d991d75e9d07-10.73.125.156', topic='persistent://fury/global/wms-wave-feed-prod.fbm-wms-picking/wms-wave-feed-prod.fbm-wms-picking'}] 1 messages have timed-out
And we don't see any error from brokers.
Any idea? Any log or metric that may be useful to debug this problem?
System configuration
Pulsar version (brokers): 1.20.0
Pulsar clients version: 1.22.0
Bookkeeper version: 4.7.1
 bardock
All 14 comments
@bardock Can you shared topics stats : pulsar-admin persistent stats $TOPIC and internal stats pulsar-admin persistent stats-internal $TOPIC
 merlimat
on 23 Aug 2018
merlimat
on 23 Aug 2018
Here they are: stats.zip
Thanks!
bardock
on 23 Aug 2018
@bardock From the stats, it seems all partitions have rate 0, and no backlog accumulated. I couldn't see any stuck consumer/subscription in there.
merlimat
on 24 Aug 2018
@merlimat sorry, that consumer is working ok right now. I will update this issue when it'll happen again. We are facing this problem almost every week. Thanks!
bardock
on 24 Aug 2018
Hi. I don't know if it's a similar issue, but here is what just happened on our Pulsar cluster (small three nodes clusters) :
One of the 3 broker suddenly stopped sending messages, its total MSG/S OUT was zero while MSG/I IN were still at ~100k/s. So it acted as if all the consumers on this particular broker were simultaneously disconnected. The odd thing is that no exception were thrown, and no error or warning were issued, either on the client side (the log level for pulsar is WARN) or on the brokers. The topics are persistent, failover non shared. All machines (clients and brokers) were under light load (0% wait, 20% CPU, low network BW).
After a client restart, the consumers started receiving messages again.
Is there anything we can do to detect such disconnection ? I thought pulsar clients & consumers were supposed to reconnect automatically, but maybe we need to listen to ConsumerEvents to detect disabled consumers ?
Client & brokers are 2.1.0
 guillaumepitel
on 11 Sep 2018
guillaumepitel
on 11 Sep 2018
@guillaumepitel : did you acknowledge the messages on consumers? One thing to check when this happens, you can run pulsar-admin persistent stats $TOPIC and pulsar-admin persistent stats-internal $TOPIC to collect the stats of topics. so we will have a better idea on how many consumers connected to broker for that topic and other metrics will potentially help a lot as well.
 sijie
on 11 Sep 2018
sijie
on 11 Sep 2018
@sijie I am looking at a heap dump from @guillaumepitel and trying to get repro of this issue.
merlimat
on 11 Sep 2018
@merlimat seems that there is no activity on this issue, I moved it to 2.4.0
sijie
on 27 Dec 2018
Hello @merlimat @sijie,
Yesterday, we faced this problem again.
Here are the stats:
topic-stats.txt
topic-stats-internal.txt
Brokers were logging this:
2019-02-05 17:25:38,735 - [level:WARN] [class:ManagedCursorImpl$11] [line:958] [thread:BookKeeperClientWorker-20-1] - [fury/global/0f9b2d5d1c3d495d9081e530b18111a3-notifications-news/persistent/0f9b2d5d1c3d495d9081e530b18111a3-notifications-news-partition-3][f6f49168781f402c99ddfa871bc0e90c-fury-news-sender-ios-meli.notifications-providers] Error while replaying entries
2019-02-05 17:25:38,735 - [level:ERROR] [class:PersistentDispatcherMultipleConsumers] [line:399] [thread:BookKeeperClientWorker-20-1] - [persistent://fury/global/0f9b2d5d1c3d495d9081e530b18111a3-notifications-news/0f9b2d5d1c3d495d9081e530b18111a3-notifications-news-partition-3 / f6f49168781f402c99ddfa871bc0e90c-fury-news-sender-ios-meli.notifications-providers] Error reading entries at 1666190:133506 : org.apache.bookkeeper.client.BKException$BKTooManyRequestsException, Read Type Replay - Retrying to read in 15.0 seconds
2019-02-05 17:25:40,713 - [level:ERROR] [class:PersistentDispatcherMultipleConsumers] [line:399] [thread:BookKeeperClientWorker-20-1] - [persistent://fury/global/0f9b2d5d1c3d495d9081e530b18111a3-notifications-news/0f9b2d5d1c3d495d9081e530b18111a3-notifications-news-partition-3 / f6f49168781f402c99ddfa871bc0e90c-fury-news-sender-ios-meli.notifications-providers] Error reading entries at 1666190:133506 : org.apache.bookkeeper.client.BKException$BKTimeoutException, Read Type Replay - Retrying to read in 29.185 seconds
A bookie was also with higher CPU than the rest (~60%). We restarted some bookies and every broker and the problem persisted but some minutes later the problem was solved.
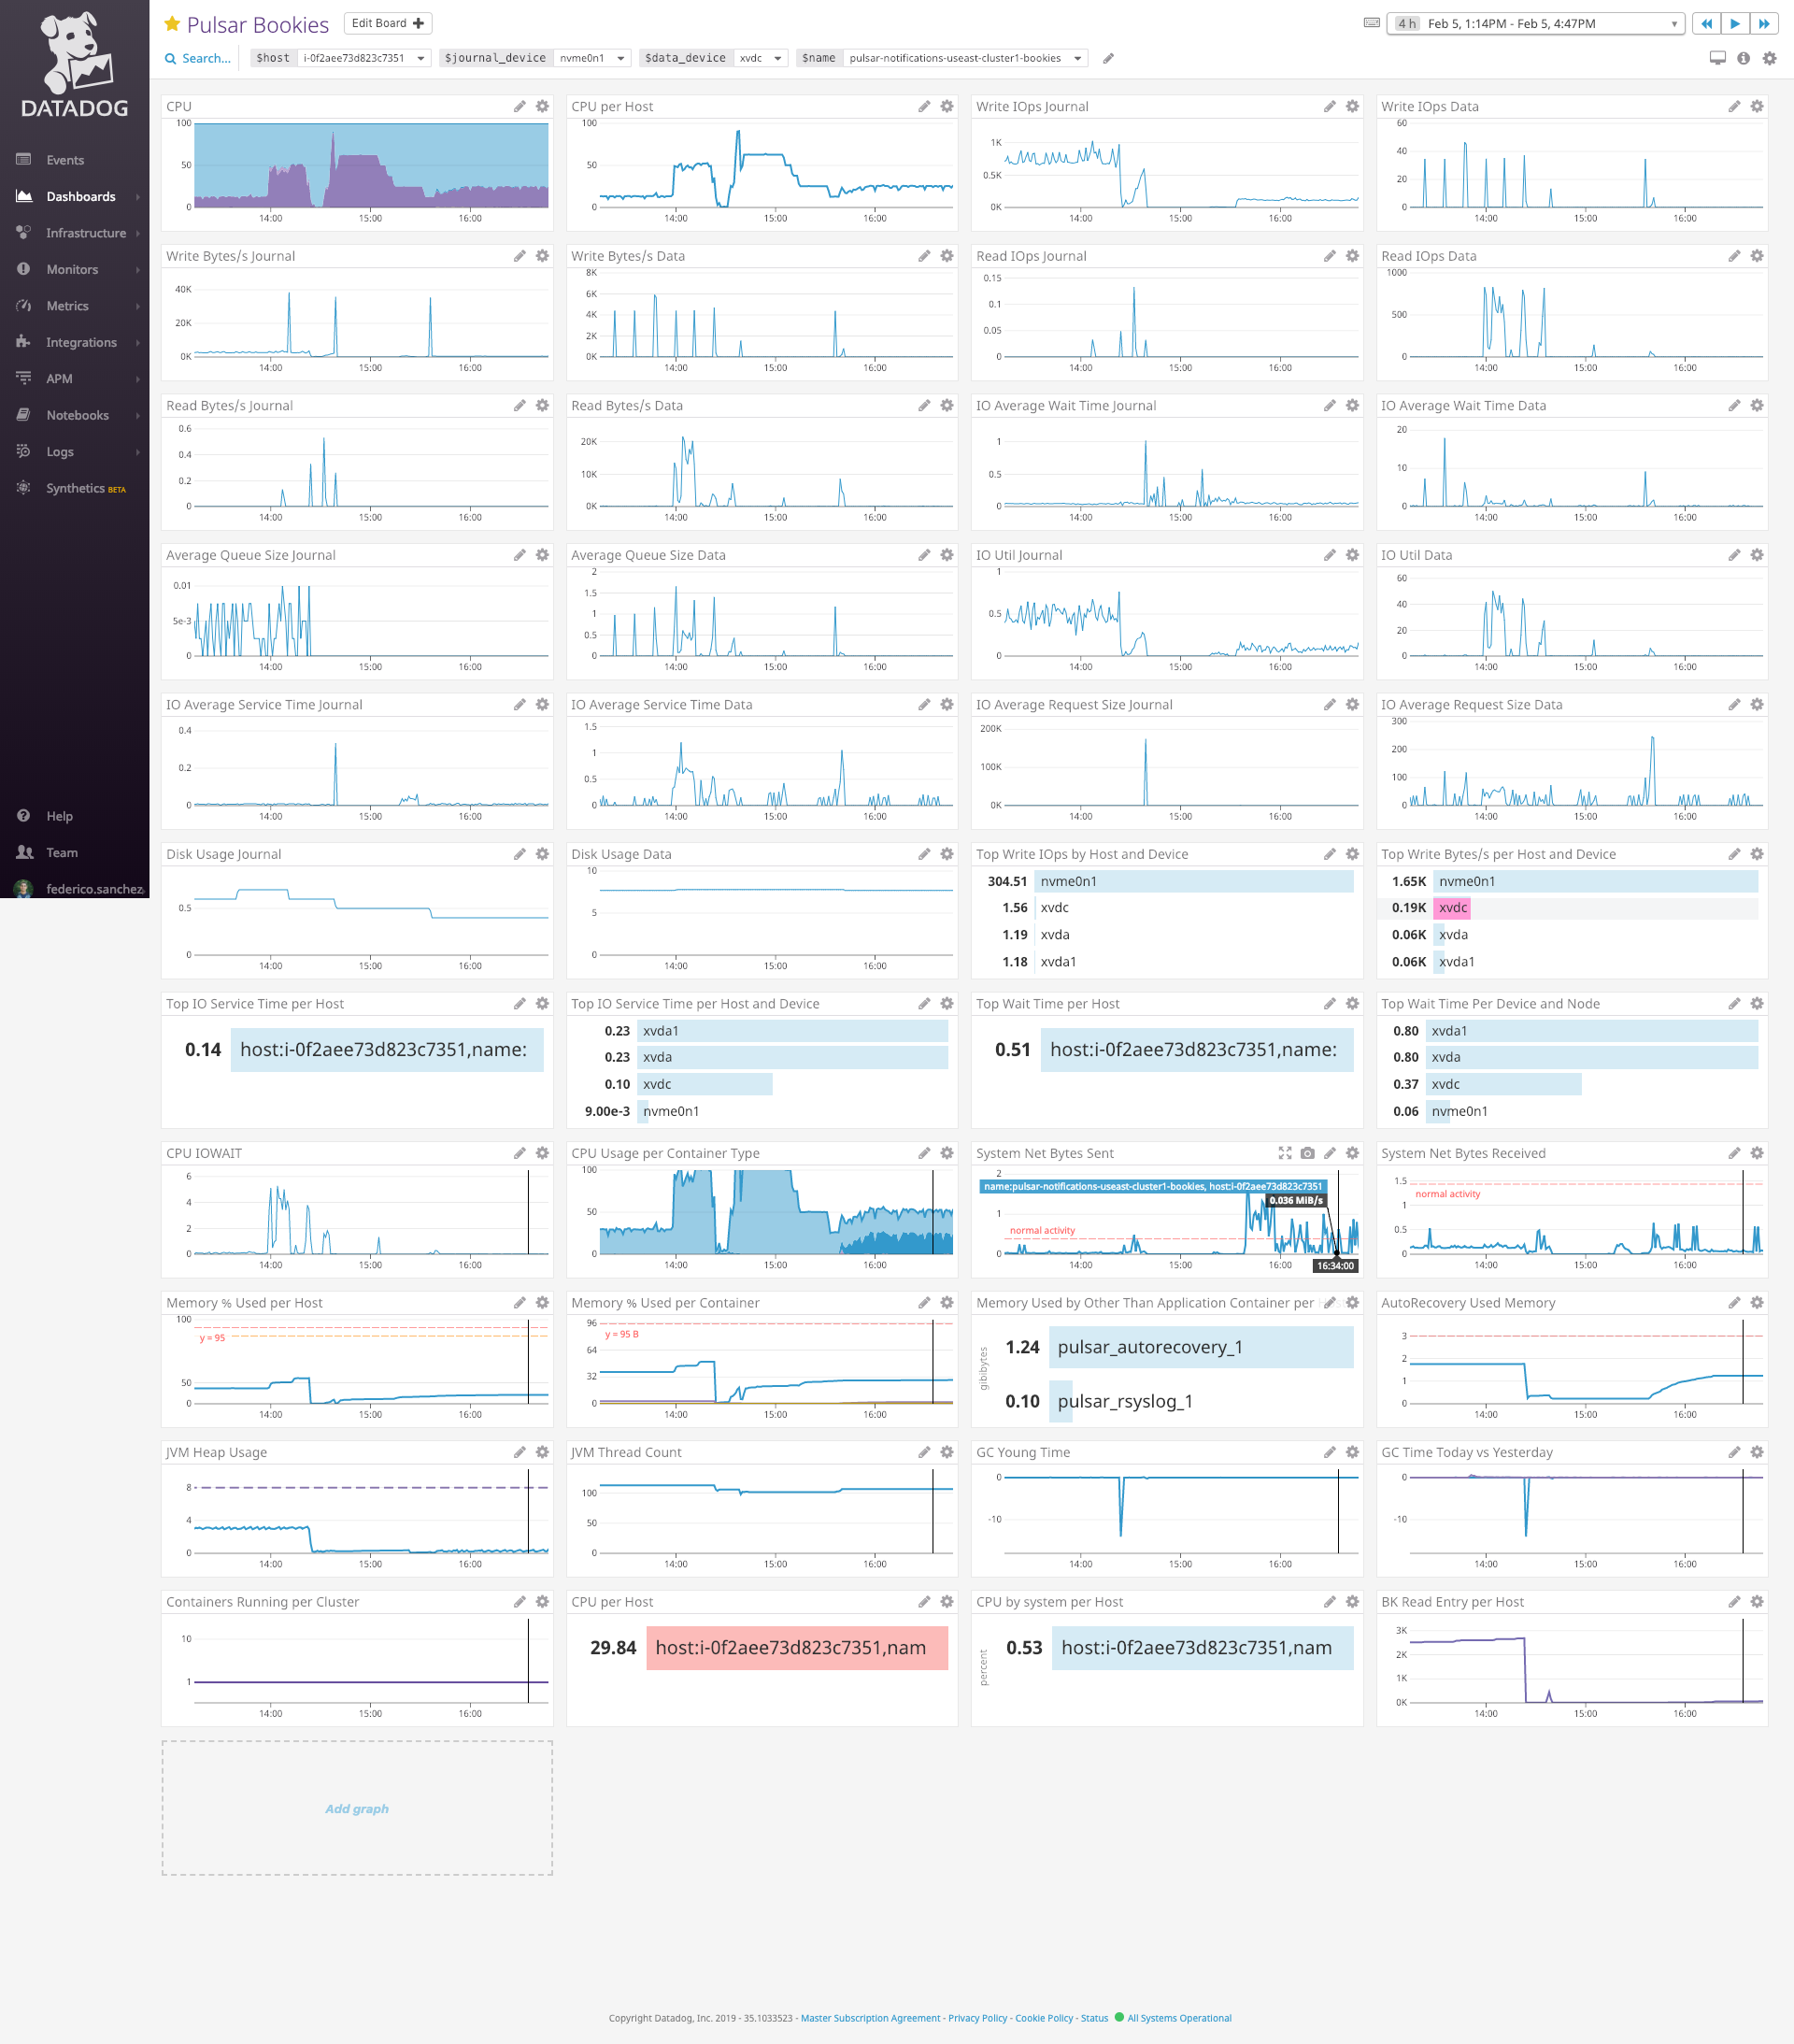
As you can see in the above image, at around 14:00 started the high cpu in that bookie, we restarted it at around 14:20 and a few minutes later the cpu was high again but this time the bookie has few or none read/write activity.
We believe we hit this bug: https://github.com/apache/bookkeeper/pull/1620
So we are planning to update to the last stable version (4.7.3).
As you can see in internal stats, subscription f6f49168781f402c99ddfa871bc0e90c-fury-news-sender-ios-meli.notifications-providers had some weird values:
      "messagesConsumedCounter" : -116637,
      "cursorLedger" : -1,
      "cursorLedgerLastEntry" : -1,
      "state" : "NoLedger"
Is that cursor's state expected?
Thanks!
bardock
on 6 Feb 2019
We have had similar problems with our 3 node cluster (2.3.1). Every couple of weeks a bunch of our subscriptions (but not all) stop receiving messages and we have to restart all brokers to get things going again. Restarting the consuming services doesn't help.
Another problem we have that might be related and possibly easier to diagnose is that sometimes subscriptions seem to get "stuck" with a message in the backlog but nothing delivered to the client. Restarting the consuming service doesn't help. The brokers have to be restarted.
I have attached the stats. Tx.
 davidtinker
on 23 Jul 2019
davidtinker
on 23 Jul 2019
Hello! We started using Pulsar instead of Kafka in our system, and currently facing the same issue, when few subscriptions (like 1 - 3 of 30) stop receiving messages, and they get stuck in a backlog, until either a subscriber, or pulsar proxy restarted.
We are using version 2.4.2, with 3 brokers in a cluster. Issue appears pretty often, like 3 - 6 times in a day. Stats also attached. Hope this issue can be fixed or at least hope there can be any workaround except of force deleting kube pods with subscriptions to make them reconnect. We used Kafka to handle some critical parts of our system, unfortunately we can't rely on Pulsar without having simplest consumer - producer scenario work well. Thank you!
 Poluect
on 27 Dec 2019
Poluect
on 27 Dec 2019
@Poluect I think there are multiple fixes (e.g. #5894) around "consumer not able to consume the messages from broker". Have you tried to upgrade broker to 2.5.x?
sijie
on 9 Jun 2020
@sijie thanks for the reply! Currently we are not using pulsar, didn't try whether it works on 2.5.x (after posting an issue)
Poluect
on 15 Jun 2020
@Poluect thank you for your update! I would close this issue for now. Please re-open one if there is still an issue in the latest release.
sijie
on 2 Jul 2020
Related issues
 bilahepan
·
4Comments
bilahepan
·
4Comments
 russorat
·
3Comments
russorat
·
3Comments
 tfhappy
·
3Comments
tfhappy
·
3Comments
 kuido85
·
3Comments
kuido85
·
3Comments
 tuteng
·
3Comments
tuteng
·
3Comments
Most helpful comment
Hello! We started using Pulsar instead of Kafka in our system, and currently facing the same issue, when few subscriptions (like 1 - 3 of 30) stop receiving messages, and they get stuck in a backlog, until either a subscriber, or pulsar proxy restarted.
We are using version 2.4.2, with 3 brokers in a cluster. Issue appears pretty often, like 3 - 6 times in a day. Stats also attached. Hope this issue can be fixed or at least hope there can be any workaround except of force deleting kube pods with subscriptions to make them reconnect. We used Kafka to handle some critical parts of our system, unfortunately we can't rely on Pulsar without having simplest consumer - producer scenario work well. Thank you!
topic-stats-internal.txt
topic-stats.txt