Prysm: Steadily climbing memory usages
It has been reported that user node's RAM usage steadily climbs. Opening this issue to track whether there's something hang onto references or unbound caches. The memory usage over time doesn't look right
https://eth2stats.io/topaz-testnet. <- Some are over 3GB
 terencechain
All 12 comments
I’ve had this problem too. However my memory usage was much higher than was displayed for my node on https://eth2stats.io/topaz-testnet - it showed me at 1.25GB even though I’d almost run out of memory on a machine with 8GB.
 pintail-xyz
on 20 Apr 2020
pintail-xyz
on 20 Apr 2020
Heap profile serving 1000 validators:

terencechain
on 20 Apr 2020
An approach to mitigate it is to not use state to verify incoming unaggregated attestation via sync. Use cached committee and pubkeys. It requires a bit of refactoring and I dont think this is pressing. Not that many nodes will be servicing 1000 validators anyway
terencechain
on 20 Apr 2020
I have experienced the same problem without serving validators. The heap stays a nearly consistent size while resident memory usage increases over time.
 prestonvanloon
on 21 Apr 2020
prestonvanloon
on 21 Apr 2020
Bumping up priority since this affects non-serving validator beacon node
terencechain
on 21 Apr 2020
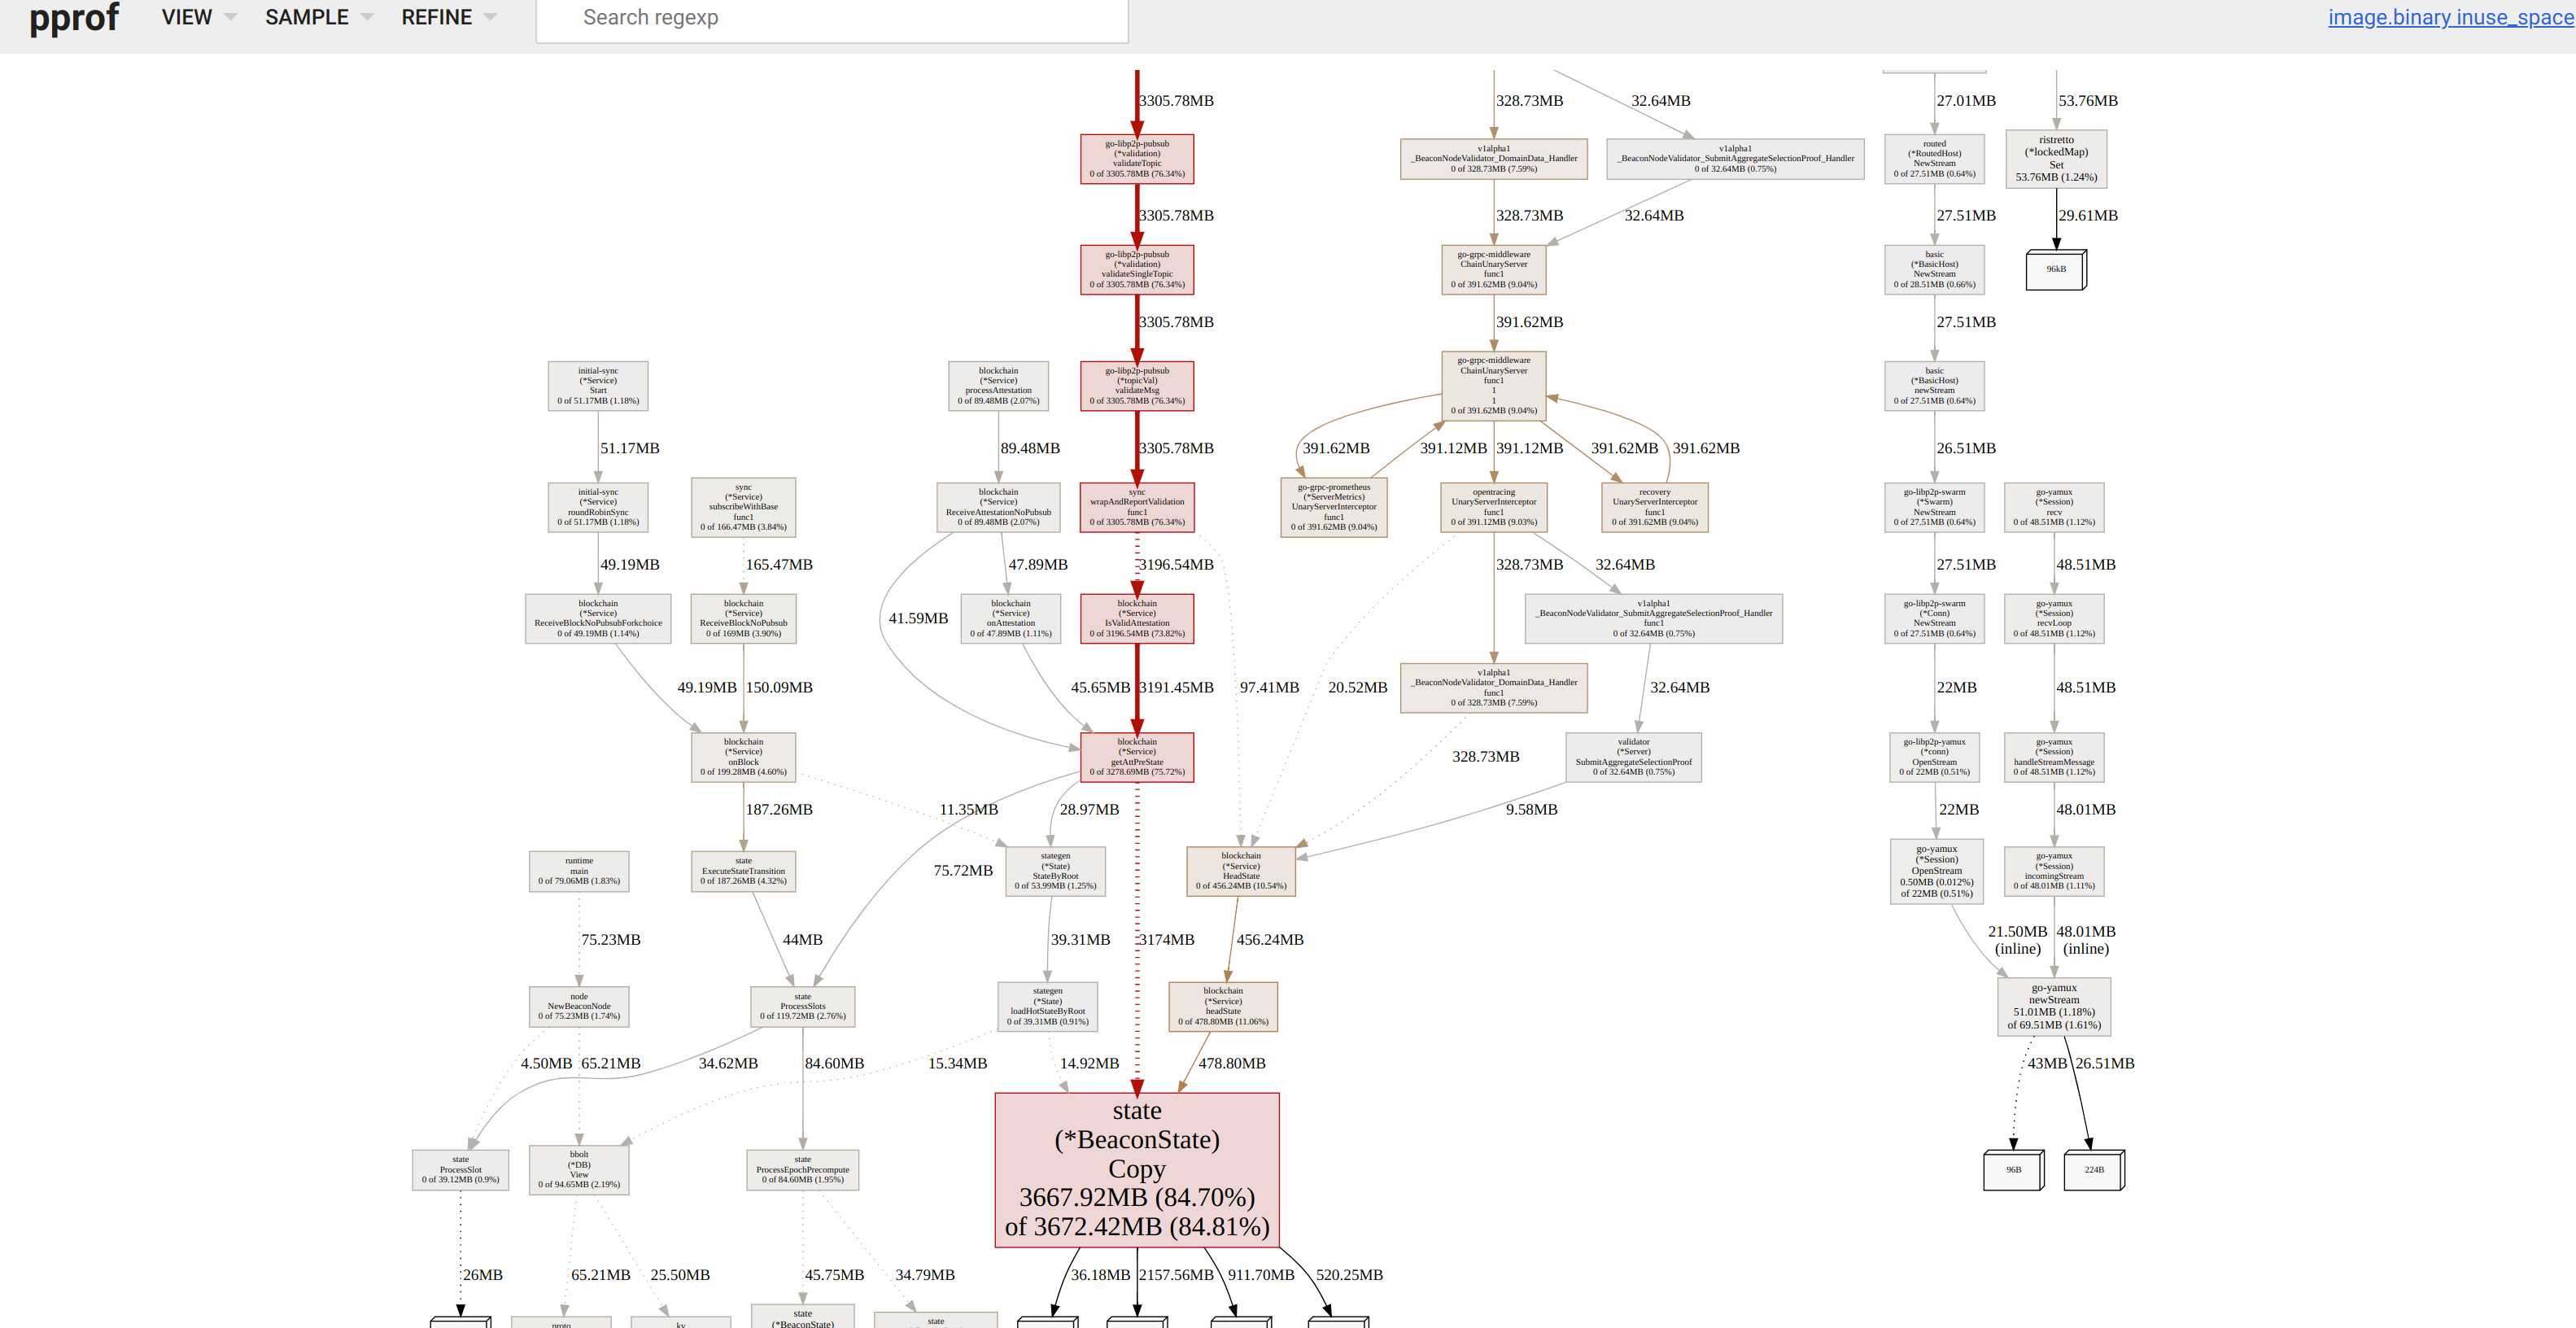
Looks like new state managementt might be an issue. #5567 will flip the flag's default value to be opt-in instead of opt-out. We'll create a new release after #5567 merges
prestonvanloon
on 21 Apr 2020
Update. I have a solution for this. Going be thoroughly testing this today
terencechain
on 22 Apr 2020
I started a beacon-chain with an empty state this morning and the resident memory usage went very high, I'm currently sitting at 6.5G with an observed peak at 6.8G, it stopped raising after it went fully synchronized.
PID USER     %MEM   DRS   RSS COMMAND
30422 magicki+ 86.7 10249360 6823008 /app/beacon-chain/image.binary --datadir=/data --log-file=/data/beacon-1.log
After a restart with a beacon-chain fully synced, I was only at 1.5g.
PID USER     %MEM   DRS   RSS COMMAND
  315 magicki+ 19.7 3822636 1555964 /app/beacon-chain/image.binary --datadir=/data --log-file=/data/beacon-1.log
Version: Prysm/Git commit: eb5513f8c209c6f1254f9cc311202f59c3570d3e. Built at: 2020-04-27 07:06:03+00:00
 Magicking
on 27 Apr 2020
Magicking
on 27 Apr 2020
@Magicking that looks like standard flags, i wonder if initial syncing brought memory up to 6.5G
cc @farazdagi
terencechain
on 27 Apr 2020
hey @Magicking can you try
--enable-state-ref-copy
this should reduce your memory usage by quite a bit
 nisdas
on 29 Apr 2020
nisdas
on 29 Apr 2020
Version "Prysm/Git commit: cc07494e67d2cfa1c60dd1c5aa24febceb6e6719. Built at: 2020-04-30 15:36:01+00:00" going from a fresh sync it capped again at 6.6G of resident memory.
[magicking@broken:~/prysm]$ ps -o pid,user,%mem,drs,rss,command ax | sort -b -k3 -r | head -n 2
  PID USER     %MEM   DRS   RSS COMMAND
10929 magicki+ 86.1 9592988 6771464 /app/beacon-chain/image.binary --datadir=/data --log-file=/data/beacon-2.log --enable-state-ref-copy
After a restart with a fully synced beacon chain it capped at 1.1G and approximately 2 hours later it went up to 1.5G.
[magicking@broken:~/prysm]$ ps -o pid,user,%mem,drs,rss,command ax | sort -b -k3 -r | grep "PID\|beacon"
  PID USER     %MEM   DRS   RSS COMMAND
11504 magicki+ 15.1 3412664 1193936 /app/beacon-chain/image.binary --datadir=/data --log-file=/data/beacon-2.log --enable-state-ref-copy
# ~2 hours later
[magicking@broken:~/prysm]$ ps -o pid,user,%mem,drs,rss,command ax | sort -b -k3 -r | grep "PID\|beacon"
  PID USER     %MEM   DRS   RSS COMMAND
11504 magicki+ 20.3 4223788 1598120 /app/beacon-chain/image.binary --datadir=/data --log-file=/data/beacon-2.log --enable-state-ref-copy
Yeah. Fresh sync has its own memory problem. This issue is more about memory problem post initial syncing. Please refer to https://github.com/prysmaticlabs/prysm/issues/5390
terencechain
on 1 May 2020
Related issues
prestonvanloon
·
3Comments
 stefa2k
·
5Comments
stefa2k
·
5Comments
 0xKiwi
·
5Comments
0xKiwi
·
5Comments
 banescusebi
·
4Comments
banescusebi
·
4Comments
 shayzluf
·
4Comments
shayzluf
·
4Comments