Prophet: When use Cross Validation function from Prophet, MAE decrease as Horizon increase
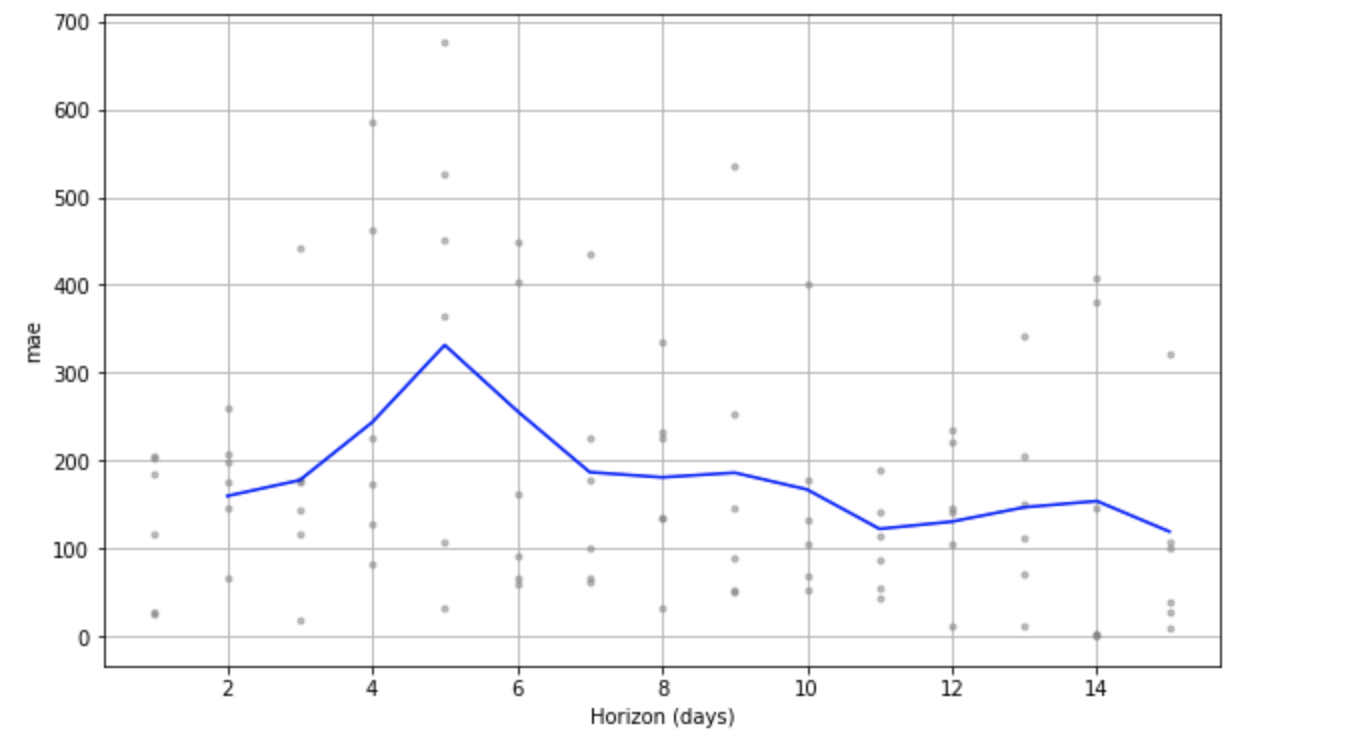
Does this make sense (doesn't make sense to me..)? what could be a potential reasons..?
 xiaoyaoyang
All 5 comments
Cross validation is attempting to estimate the average of the stochastic function MAE(h) using a few samples from that function. In this case it is 6 samples (the number of simulated historical forecasts). Since that is a fairly small number of samples, it may just be random noise that the forecast errors were high at h=5. Try decreasing period to get more measurements of MAE(h) (cut it in half, or even by 1/4) and that will likely smooth things out.
 bletham
on 12 Jul 2019
bletham
on 12 Jul 2019
Thanks a lot.
xiaoyaoyang
on 12 Jul 2019
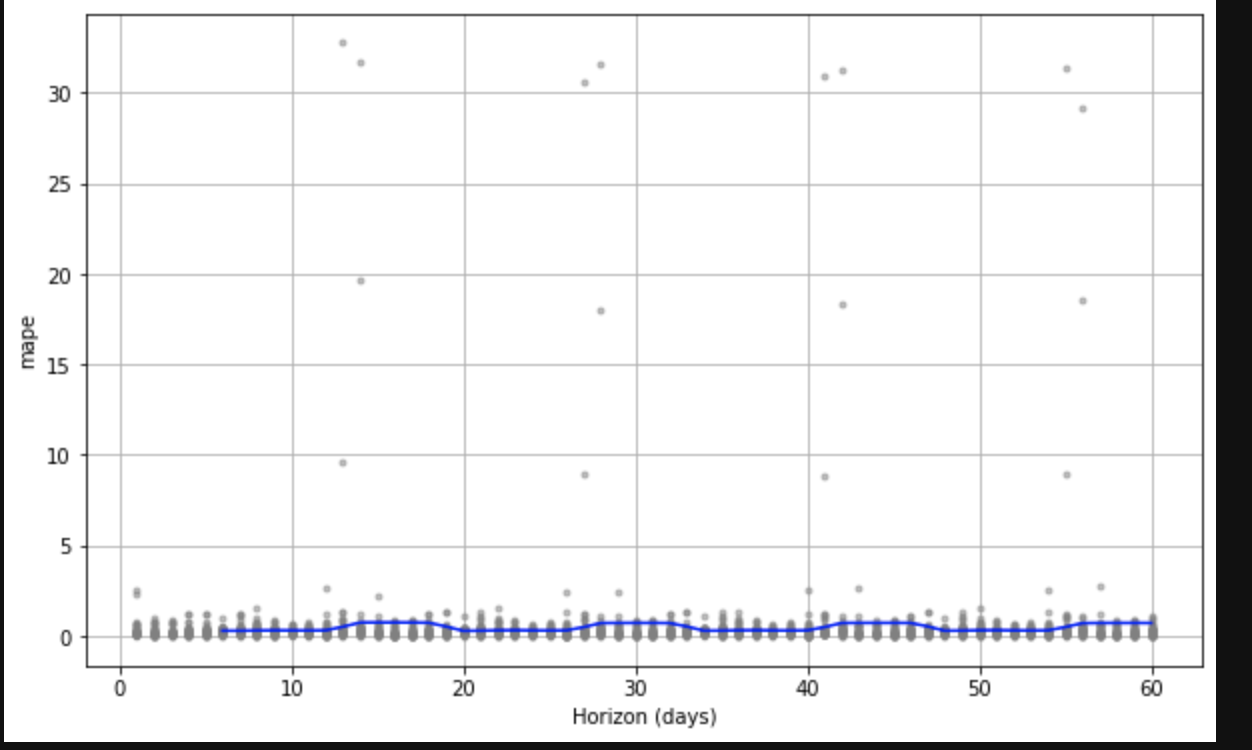
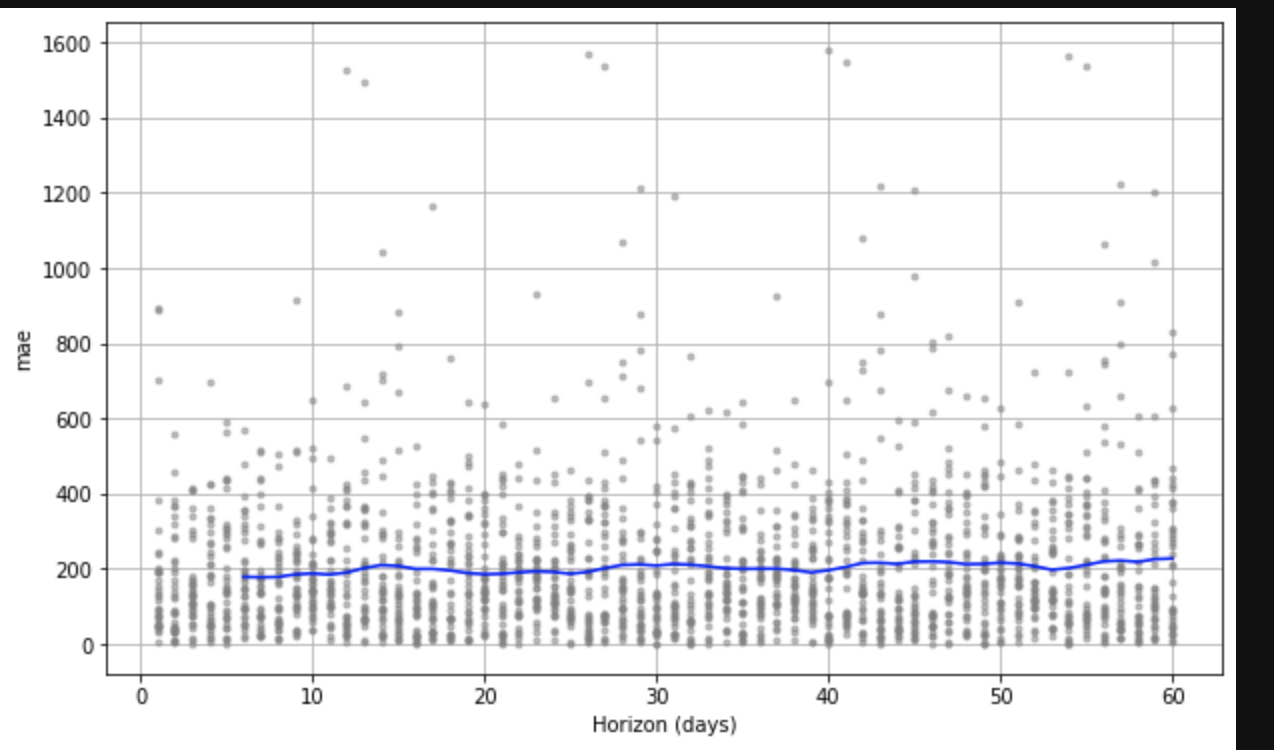
@bletham Hmm.... I tried to increate the sample size.. and tried to delete the outliers (which I actually would like to keep at the end).. The chart looks strange, it looks like the error rate is high with a certain patterns..
It lookd like the cycle depend on periods argument.. If I set period = 10, then the MAPE will jump every 10 days in the graph
xiaoyaoyang
on 12 Jul 2019
I'd look at the dataframe of cross validation results (output of cross_validation) and see where those really high values are coming from. Are they all from the same cutoff? If so, then maybe that cutoff just happened to have a really bad fit for a seasonality that is showing high errors. You could then manually fit the model to only the data up to the cutoff, and look at the predictions and see why it is making those high errors at certain points in the future.
If the large errors aren't all coming from one cutoff, I'd be really interested in seeing the data if it's possible for you to post it.
bletham
on 12 Jul 2019
@bletham Thanks! I found the issue.. they don't have the same cutoff date but they do have similar predicting date... So basically there are some dates that the model is not able to predict.. (kind of outliers)..
xiaoyaoyang
on 13 Jul 2019
Related issues
 maxwell873
·
3Comments
maxwell873
·
3Comments
 ahash52
·
3Comments
ahash52
·
3Comments
 ChaymaeHarfoush
·
3Comments
ChaymaeHarfoush
·
3Comments
 andrew-pollock
·
3Comments
andrew-pollock
·
3Comments
 robertdknight
·
3Comments
robertdknight
·
3Comments