Prophet: charts in my_model.plot and model.plot_components is duplicated
Firstly, thank you for your works.
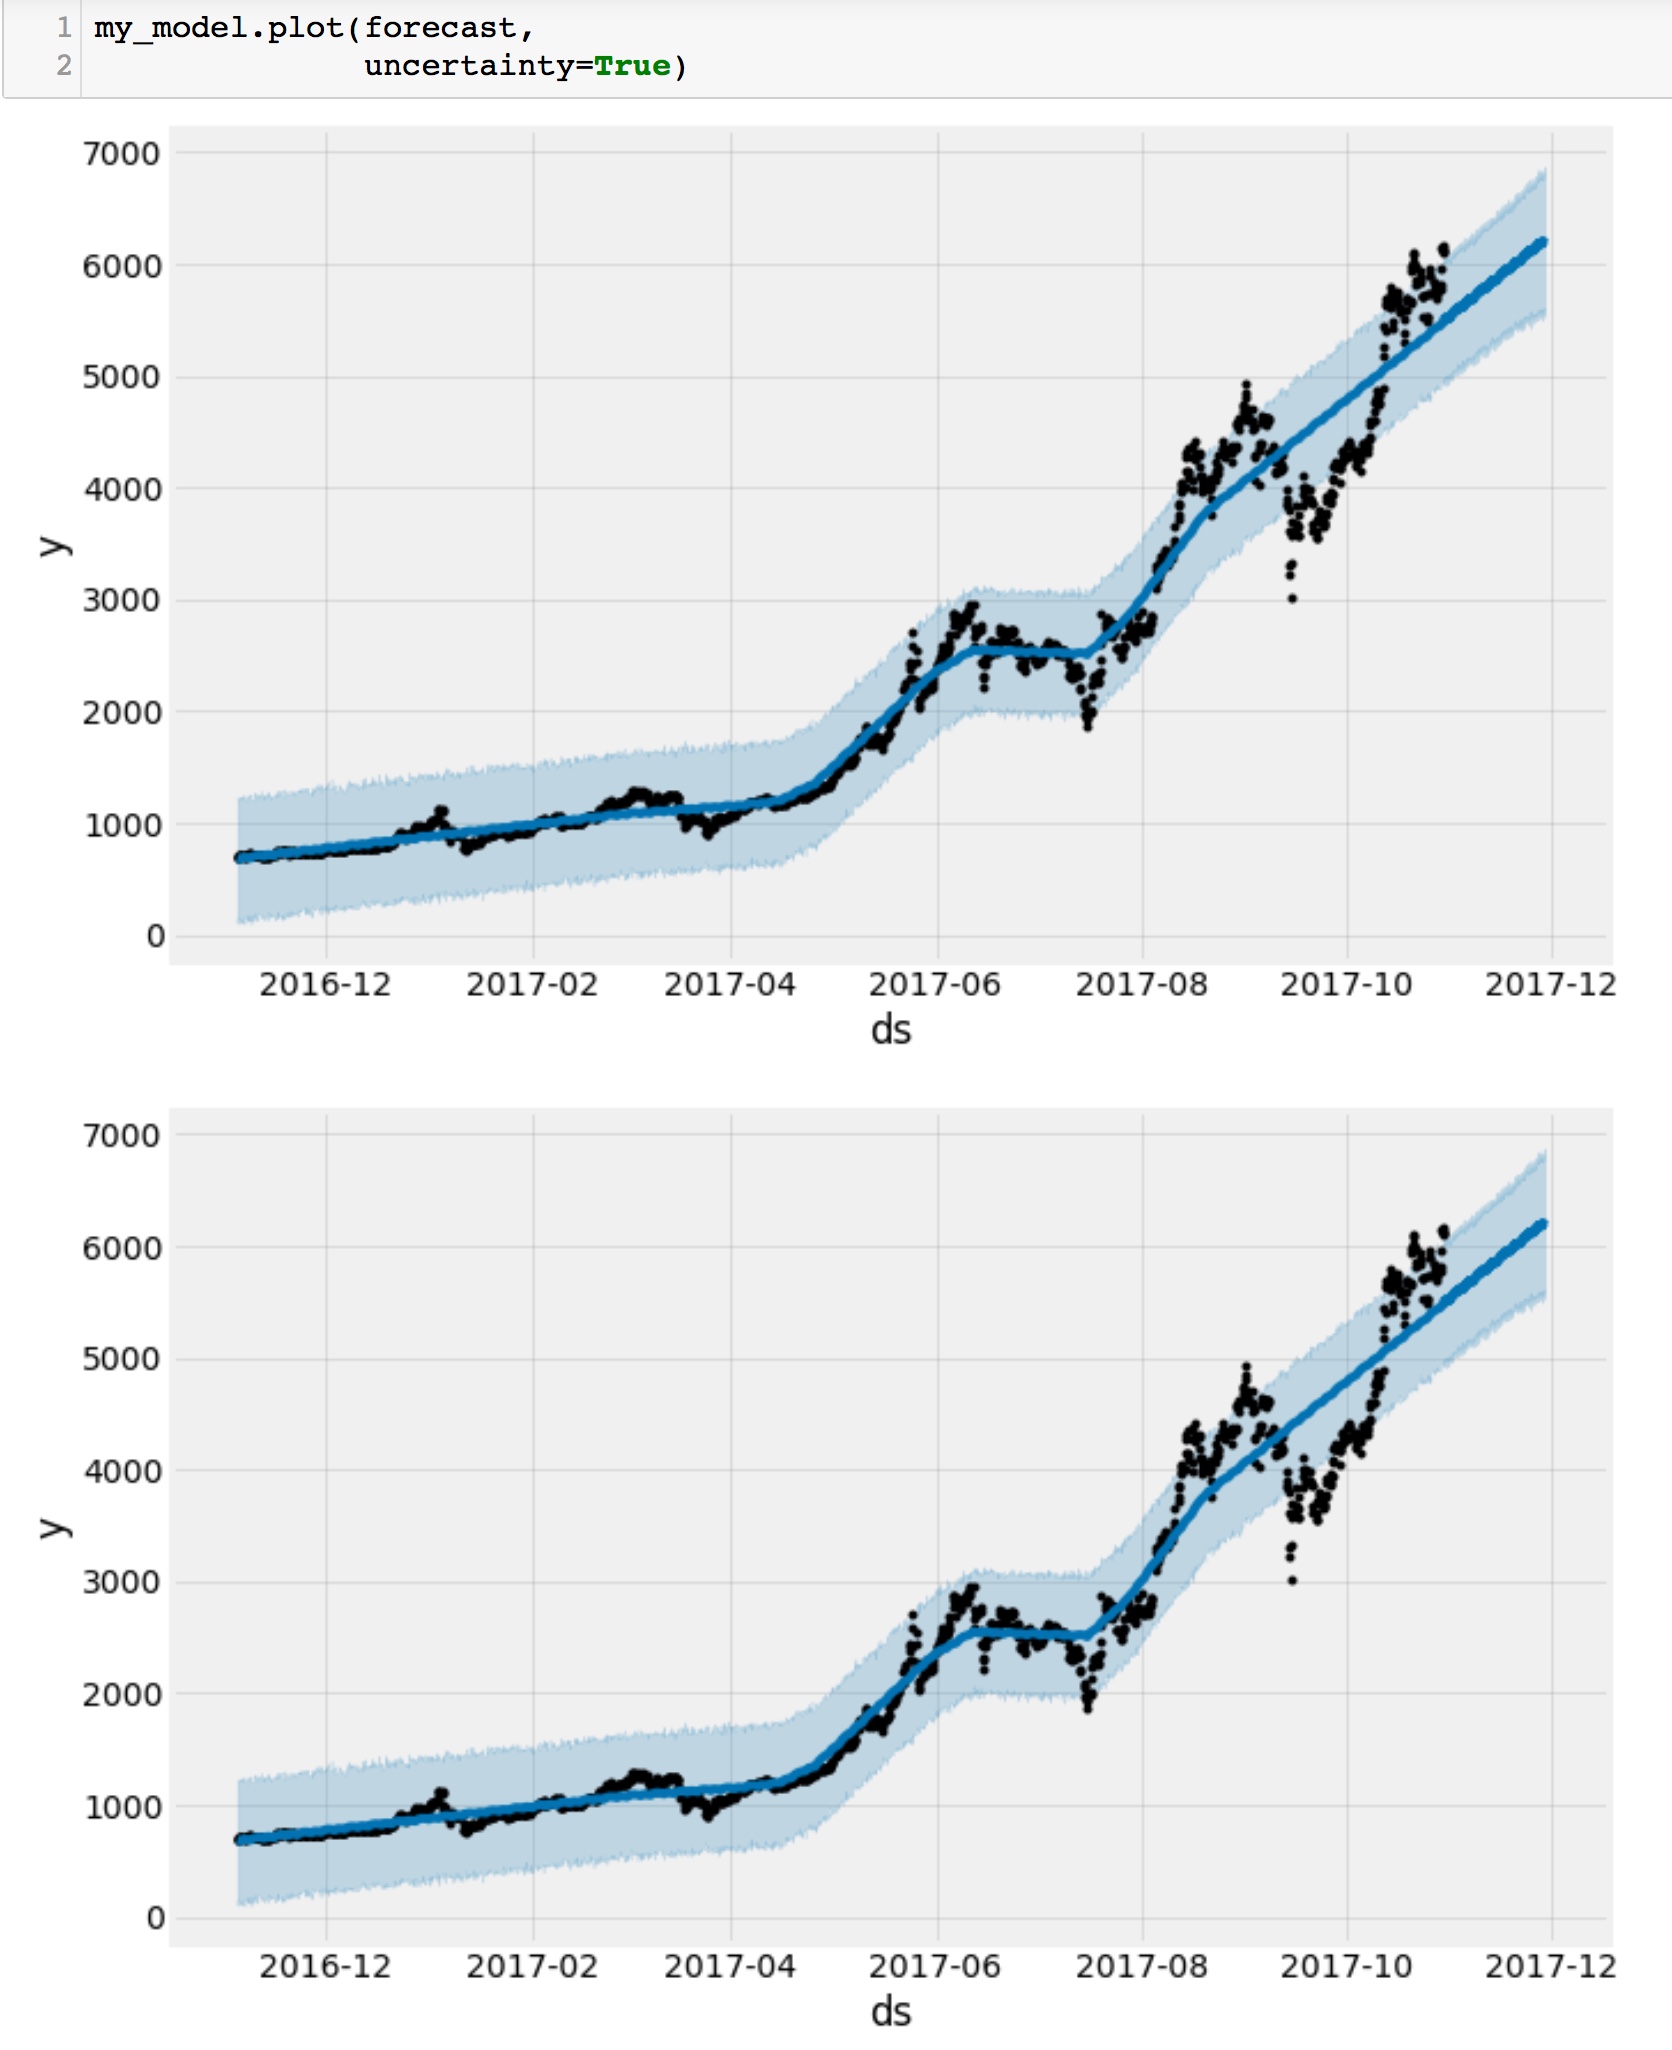
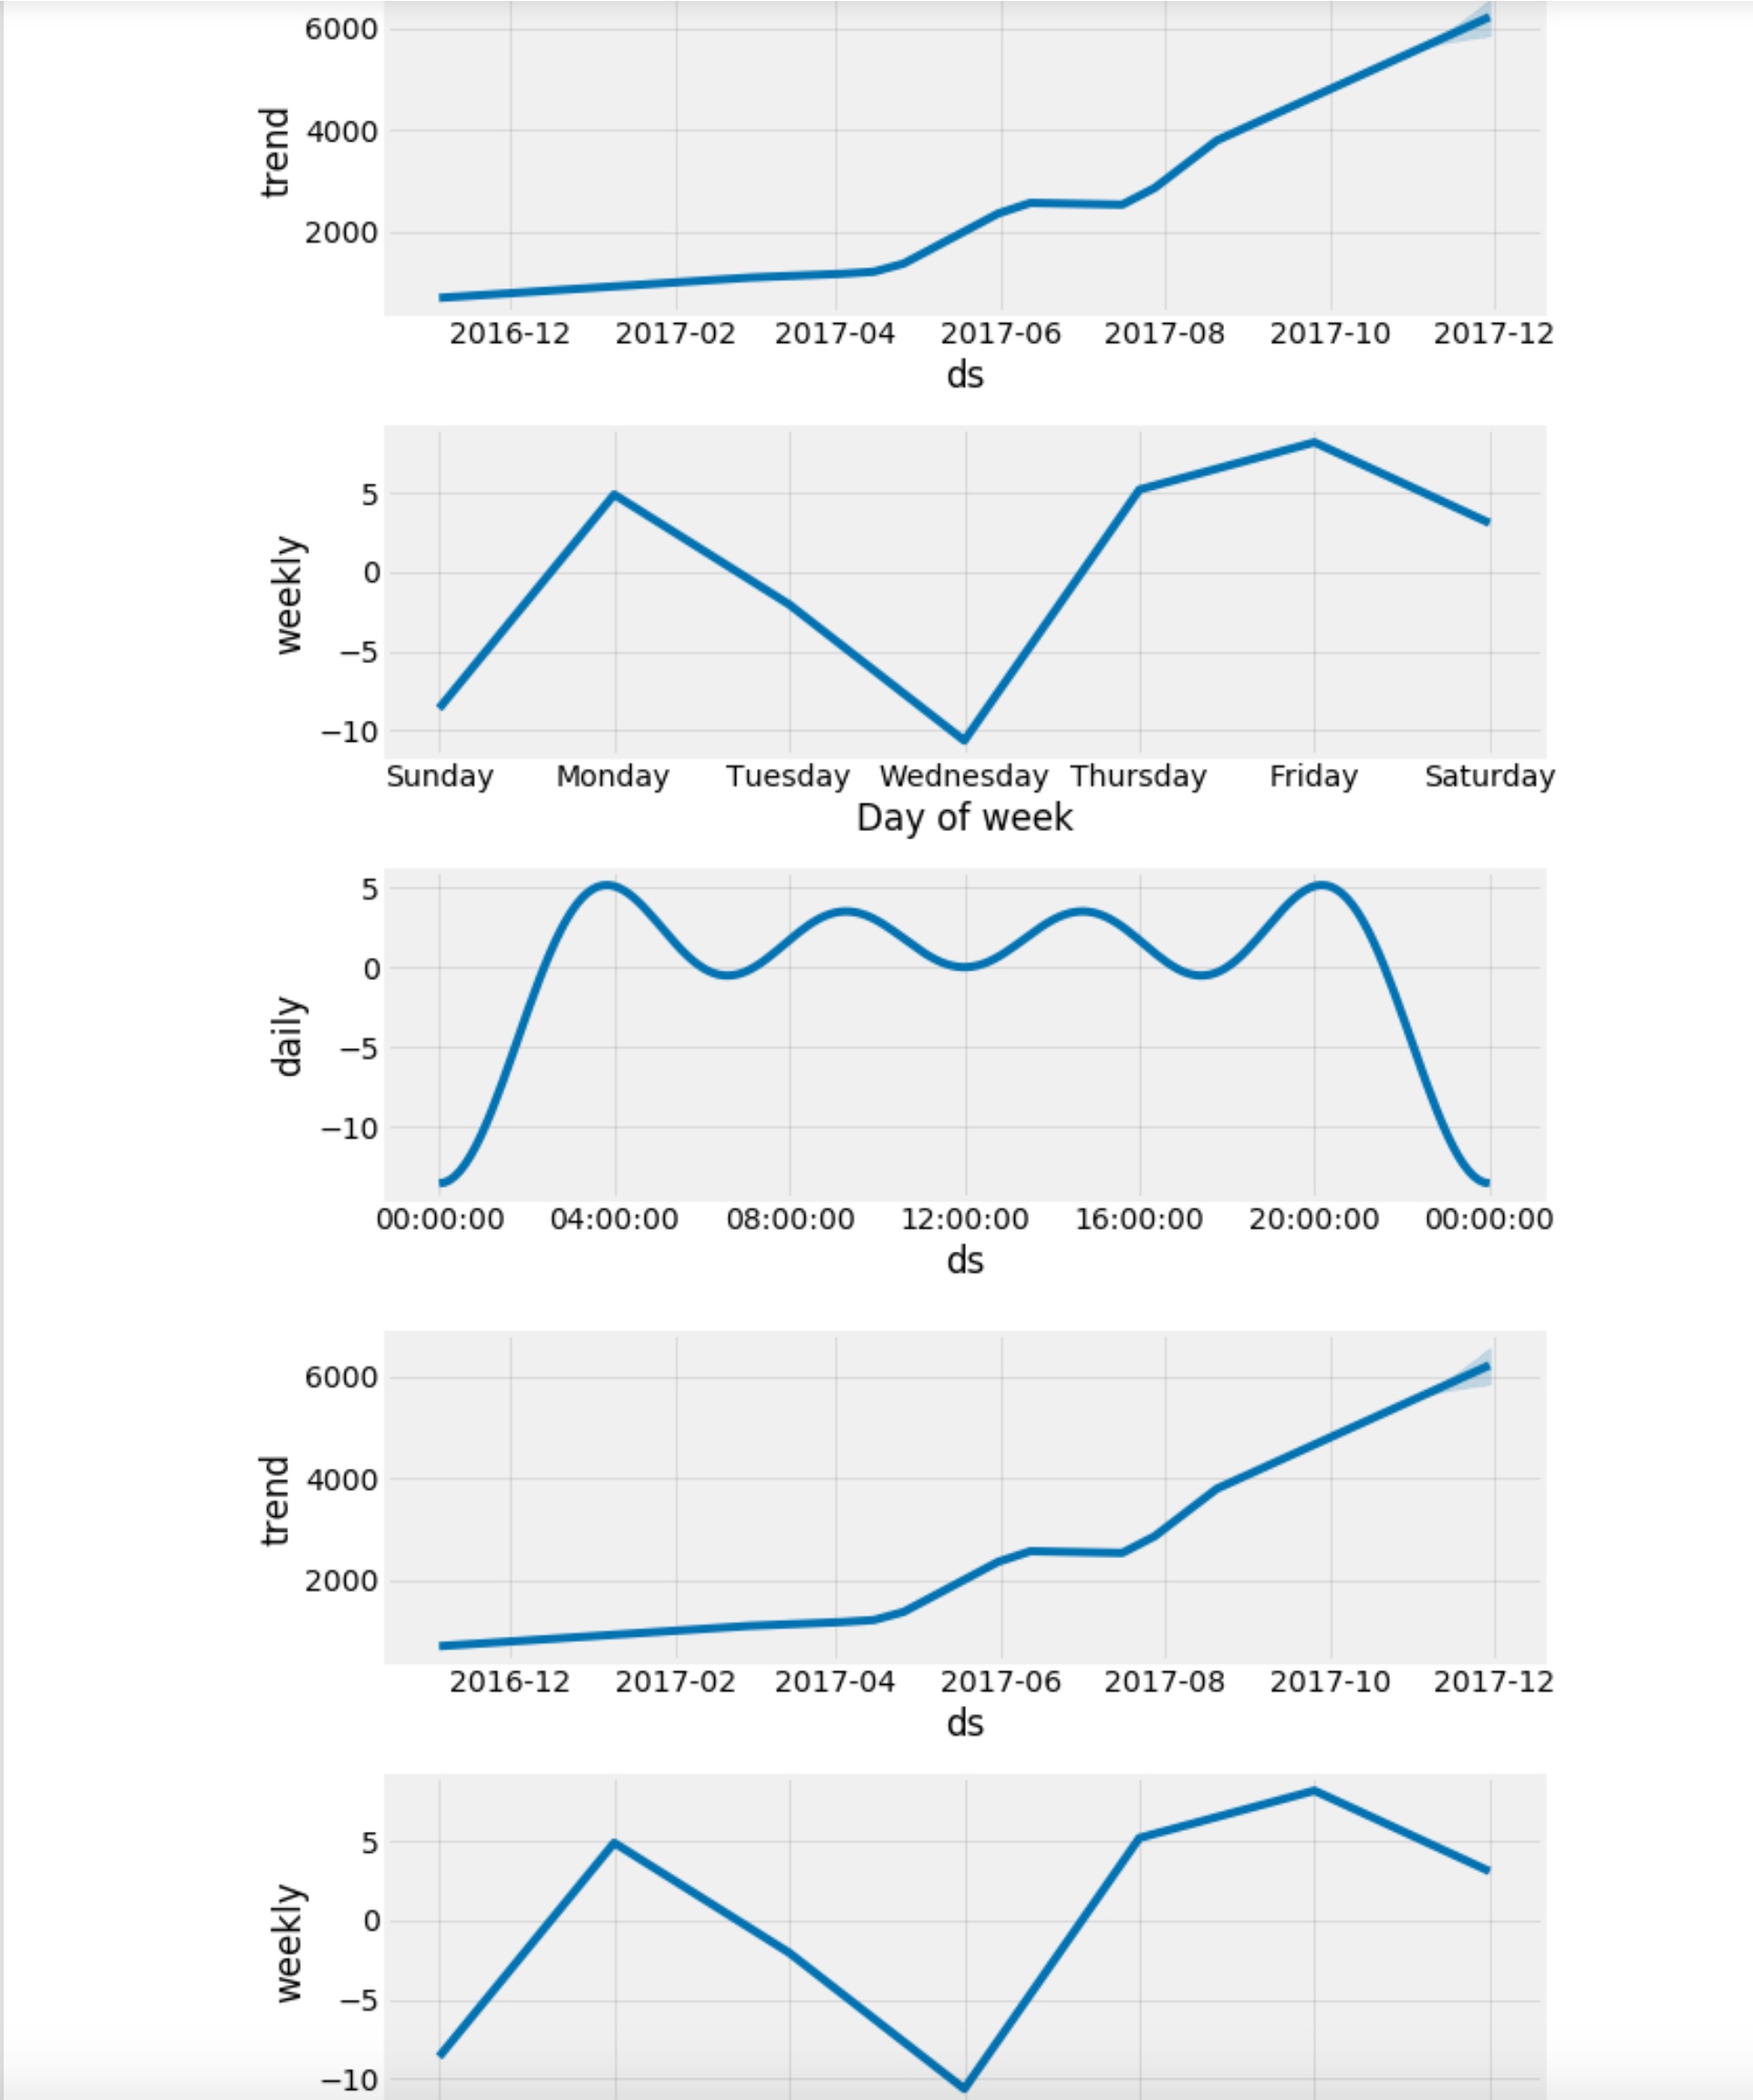
And, I have a problem that charts in my_model.plot and model.plot_components is duplicated as below.
How can I fix it?
Thanks.
 LeeChang-Soo
>All comments
If this is in a notebook, then it is because of Jupyter behavior that displays any plot that is generated, but then also prints the return value of the last line in the cell (if not assigned). In this case, m.plot() returns a matplotlib figure, and so jupyter is printing the figure a second time.
You can get around this by either assigning the output of plot, e.g. like fig = m.plot(). Or, in the notebook you can also suppress the printing of the last line by ending it with a semicolon, like m.plot();. You'll notice in our documentation that the plot lines have semicolons after them exactly for this reason.
 bletham
on 4 Nov 2017
bletham
on 4 Nov 2017
Related issues
 andmib
·
3Comments
andmib
·
3Comments
 arnaudvl
·
3Comments
arnaudvl
·
3Comments
 ahash52
·
3Comments
ahash52
·
3Comments
 maxwell873
·
3Comments
maxwell873
·
3Comments
 dsvrsec
·
3Comments
dsvrsec
·
3Comments
Most helpful comment
If this is in a notebook, then it is because of Jupyter behavior that displays any plot that is generated, but then also prints the return value of the last line in the cell (if not assigned). In this case,
m.plot()returns a matplotlib figure, and so jupyter is printing the figure a second time.You can get around this by either assigning the output of plot, e.g. like
fig = m.plot(). Or, in the notebook you can also suppress the printing of the last line by ending it with a semicolon, likem.plot();. You'll notice in our documentation that the plot lines have semicolons after them exactly for this reason.