Prometheus-operator: ServiceMonitor on headless service
Greetings,
Fairly straightforward question. I'm trying to add a ServiceMonitor for the Kiam app I have running on my AWS cluster. When Kiam is created via the Helm chart in that link, it creates a headless service.
My main questions:
- What exactly is required to make a
ServiceMonitorobject successfully work? Can individual pods be monitored through aServiceMonitordefinition? - Why does Prometheus pick up the service in Service Discovery, but doesn't start scraping it?
What did you do?
I'm used to adding ServiceMonitor resources for apps that include their Prometheus port in the Service definition. The Helm chart _does_ configure the Kiam app to export Prometheus metrics on port 9620, but unfortunately it doesn't add the metrics port to the service itself. The chart itself needs to be fixed, but that's another story. I followed this model, and manually added the Prometheus port like so:
I then created the ServiceMonitor definition below.
What did you expect to see?
Metrics for kiam-server show up, in the Service Discovery and Target tabs in the Prometheus UI.
What did you see instead? Under which circumstances?
I _did_ see that Prometheus picked it up under the Service Discovery tab:
kube-system/kiam-server/0 (0/111 active targets)
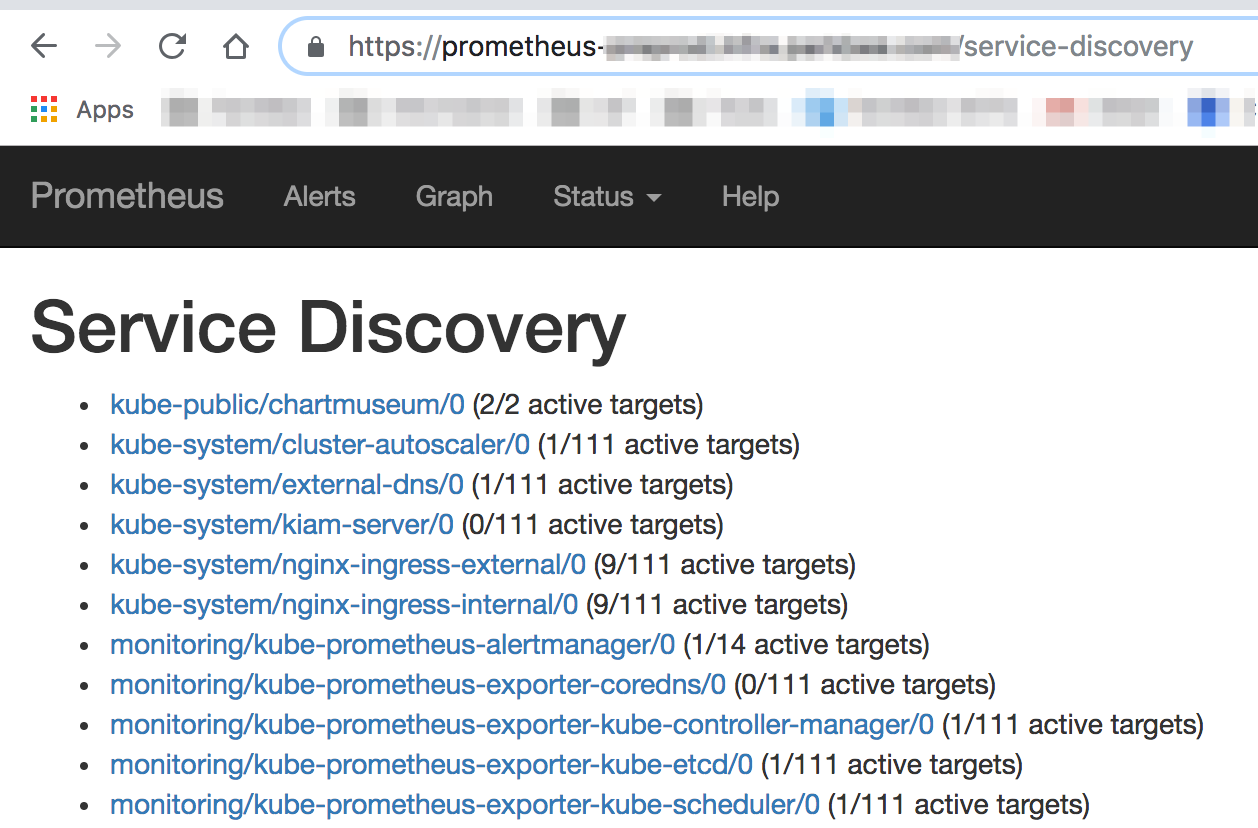
But no metrics are scraped.
Environment
Prometheus Operator version: v0.23.2
Kubernetes version information:
Client Version: version.Info{Major:"1", Minor:"11", GitVersion:"v1.11.3", GitCommit:"a4529464e4629c21224b3d52edfe0ea91b072862", GitTreeState:"clean", BuildDate:"2018-09-10T11:44:36Z", GoVersion:"go1.11", Compiler:"gc", Platform:"darwin/amd64"}
Server Version: version.Info{Major:"1", Minor:"10", GitVersion:"v1.10.7", GitCommit:"0c38c362511b20a098d7cd855f1314dad92c2780", GitTreeState:"clean", BuildDate:"2018-08-20T09:56:31Z", GoVersion:"go1.9.3", Compiler:"gc", Platform:"linux/amd64"}
Kubernetes cluster kind: kops
Manifests:
Kiam default service manifest
---
apiVersion: v1
kind: Service
metadata:
  labels:
    app: kiam
    chart: kiam-1.2.0
    component: server
    heritage: Tiller
    release: kiam
  name: kiam-server
  namespace: kube-system
spec:
  clusterIP: None
  ports:
  - name: grpc
    port: 443
    protocol: TCP
    targetPort: 443
  selector:
    app: kiam
    component: server
    release: kiam
  sessionAffinity: None
  type: ClusterIP
Kiam modified service manifest:
  clusterIP: None
  ports:
+  - name: metrics
+    port: 9620
+    protocol: TCP
+    targetPort: 9620
  - name: grpc
    port: 443
    protocol: TCP
    targetPort: 443
  selector:
    app: kiam
    component: server
ServiceMonitor definiton:
---
apiVersion: monitoring.coreos.com/v1
kind: ServiceMonitor
metadata:
  name: kiam-server
  namespace: kube-system
  labels:
    prometheus: kube-prometheus
spec:
  jobLabel: kiam-server
  selector:
    matchLabels:
      app: kiam
      release: kiam
  namespaceSelector:
    matchNames:
    - kube-system
  endpoints:
  - interval: 15s
    targetPort: 9620
    honorLabels: true
    path: /metrics
- Prometheus Operator Logs:
The logs don't really help here.
 sc250024
All 4 comments
The ServiceDiscovery page is for debugging service discovery configuration in Prometheus, which means the targets are not actually being picked up. Essentially you want to look at the "kube-system/kiam" entry, which currently says that there are 0 targets selected though that service discovery entry (which is generated through the ServiceMonitor). Headless services work perfectly fine, in fact they have just the right characteristics because Prometheus always scrapes each individual Pod.
As far as I can tell you just need to change
  endpoints:
  - interval: 15s
    targetPort: 9620
    honorLabels: true
    path: /metrics
To
  endpoints:
  - interval: 15s
    port: metrics
The kiam Prometheus metrics don't look like they will need to honor labels and /metrics is the default path.
 brancz
on 17 Sep 2018
brancz
on 17 Sep 2018
Thanks so much @brancz , that did the trick. Just to confirm, this addition I made to the Service definition:
  clusterIP: None
  ports:
+  - name: metrics
+    port: 9620
+    protocol: TCP
+    targetPort: 9620
  - name: grpc
    port: 443
    protocol: TCP
    targetPort: 443
  selector:
    app: kiam
    component: server
Would still be needed, correct?
sc250024
on 17 Sep 2018
correct, that's exactly what the ServiceMonitor selects :slightly_smiling_face:
brancz
on 17 Sep 2018
Thank you sir! Closing.
sc250024
on 17 Sep 2018
Related issues
 ohmanandam
·
4Comments
ohmanandam
·
4Comments
 scottrigby
·
3Comments
scottrigby
·
3Comments
 Shini31
·
3Comments
Shini31
·
3Comments
 magick93
·
4Comments
magick93
·
4Comments
 mikebryant
·
4Comments
mikebryant
·
4Comments
Most helpful comment
Thank you sir! Closing.