Prometheus-operator: Prometheus in prometheus-operator consume 1G+ memory
What did you do?
Install Prometheus and operator via the following command in k8s 1.10:
kubectl create -f contrib/kube-prometheus/manifests/
What did you expect to see?
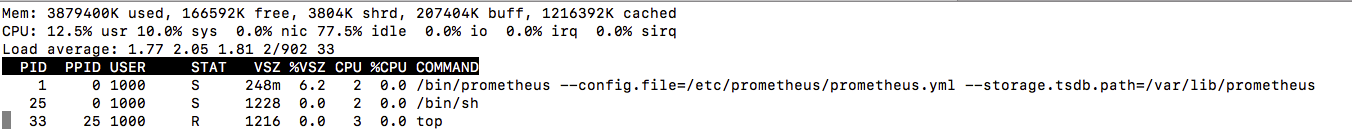
Prometheus pod consume ~ 200 MB memory as the one I installed by myself
What did you see instead? Under which circumstances?
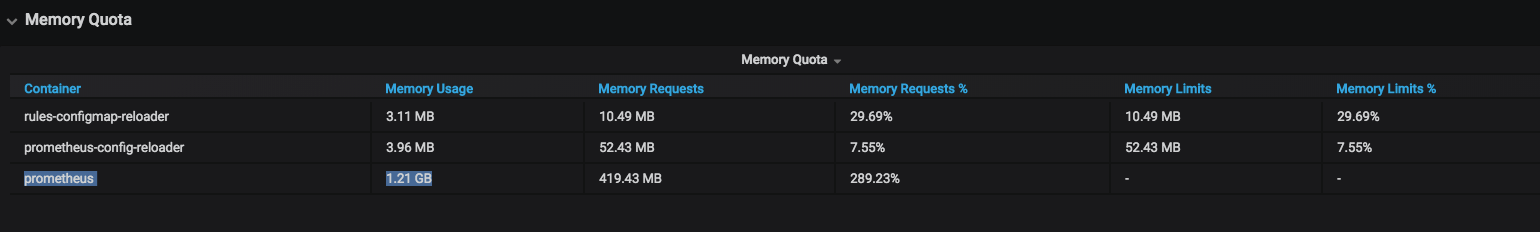
Prometheus install by prometheus operater consume 1GB+ memory

Environment
k8s 1.10
Prometheus Operator version:
latest code from github, should be 0.23Kubernetes version information:
Client Version: version.Info {
Major: "1",
Minor: "10",
GitVersion: "v1.10.5",
GitCommit: "32ac1c9073b132b8ba18aa830f46b77dcceb0723",
GitTreeState: "clean",
BuildDate: "2018-06-21T11:46:00Z",
GoVersion: "go1.9.3",
Compiler: "gc",
Platform: "linux/amd64"
}
Server Version: version.Info {
Major: "1",
Minor: "10",
GitVersion: "v1.10.5",
GitCommit: "32ac1c9073b132b8ba18aa830f46b77dcceb0723",
GitTreeState: "clean",
BuildDate: "2018-06-21T11:34:22Z",
GoVersion: "go1.9.3",
Compiler: "gc",
Platform: "linux/amd64"
}
 benjaminhuo
All 45 comments
Thanks a lot for reporting this!
Are you using the same version of Prometheus for both, and which version is what? Also could you share the config for both as well as the flags? Thanks!
 brancz
on 7 Aug 2018
brancz
on 7 Aug 2018
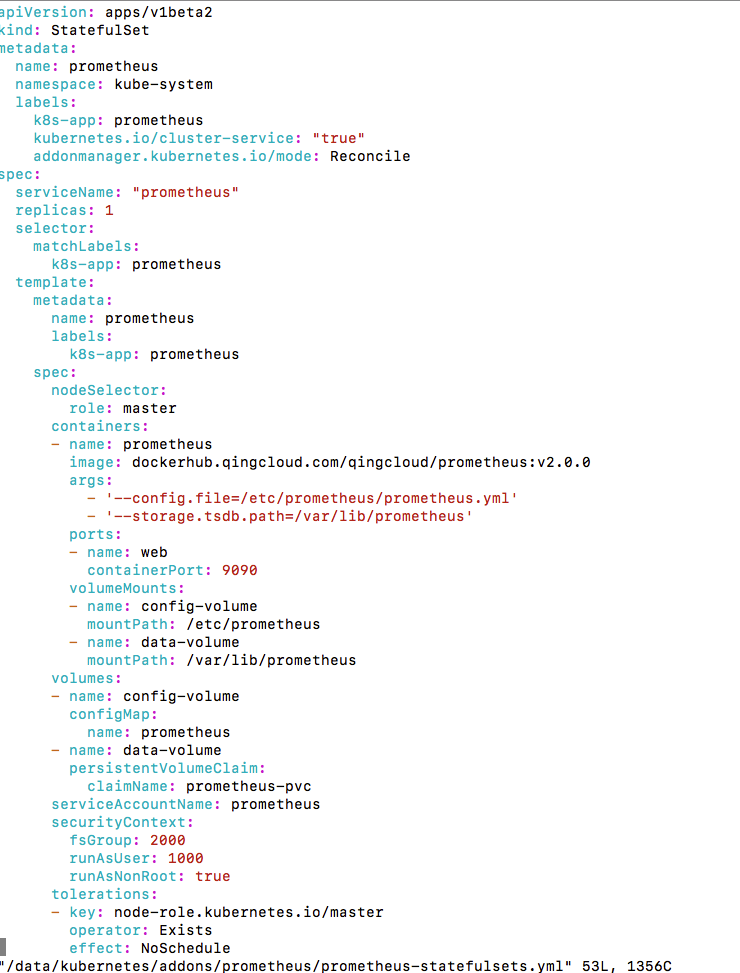
The one I installed myself is v2.0
prometheus.tar.gz
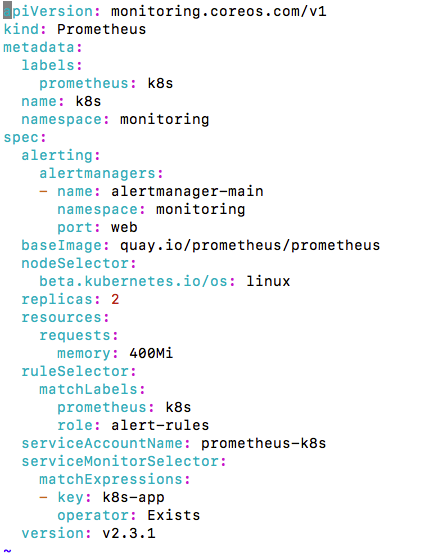
The one I deployed using operator is v 2.3.1:
benjaminhuo
on 7 Aug 2018
The memory usage drop a little bit to 900MB to 1G after I disable the following remote write option:
but still a lot more higher than v2.0
benjaminhuo
on 7 Aug 2018
Just so we're not comparing two totally disconnected versions (between which a lot of things happened), could you update both of them to the latest stable release: v2.3.2? (I just want to make sure that this is definitely not a Prometheus problem, and it's hard to tell with different versions) Thanks! :slightly_smiling_face:
brancz
on 7 Aug 2018
Thanks for the quick response.
Here are some updates:
The memory consumption of my standalone prometheus is 265 MB after I changed the image to v2.3.2.
, and it raised to 422 MB after I turn the remote_write on.
The prometheus installed by operator consume ~ 400 MB memory, and it raised to 1GB + when remoteWrite is turned on and keep increasing to 1.8GB.
Another irrelevant question regarding operator is there are 2 replicas of prometheus , will the remote write adapter receive 2 copies of the same metrics at the same time if I add remoteWrite option to prometheus?
Thanks very much
Ben
benjaminhuo
on 8 Aug 2018
Thanks for the additional information!
Another irrelevant question regarding operator is there are 2 replicas of prometheus , will the remote write adapter receive 2 copies of the same metrics at the same time if I add remoteWrite option to prometheus?
Yes, your remoteWrite adapter needs to handle this appropriately.
Could you share the flags as well as configuration you are using for the standalone Prometheus, as well as the configuration generated by the Prometheus Operator? Although regarding the ~140MB difference without remoteWrite could simply be a lot more connections that are open to Kubernetes. (there is already a pull request by us to deduplicate unnecessary connections to Kubernetes from Prometheus but it's not yet merged or released)
brancz
on 8 Aug 2018
Thanks again for the explanation.
I found out that the memory consumption is related to queueConfig of remote_write:
queue_config:
capacity: 400
max_samples_per_send: 200
max_shards: 10000
The memory goes down if I reduce the maxShards
The above is observed on my standalone prometheus.
Regarding the prometheus installed by operator, the memory still kept increasing after turning on remoteWrite
benjaminhuo
on 9 Aug 2018
Another question is the prometheus installed by prometheus operator stored time series data in memory or on disk?
In my standalone installation, we use statefulset to persis data on disk, but I didn't find a statefulset definition in prometheus operator
benjaminhuo
on 9 Aug 2018
@benjaminhuo all Prometheus pods created by the Prometheus Operator belong to a Prometheus StatefulSet. You can find some of the relevant implementation here [0][1]. These Promethei store all time series data on disk.
[0] https://github.com/coreos/prometheus-operator/blob/master/pkg/prometheus/operator.go#L945
[1] https://github.com/coreos/prometheus-operator/blob/master/pkg/prometheus/statefulset.go#L80
 squat
on 9 Aug 2018
squat
on 9 Aug 2018
@squat Thanks for the reply.
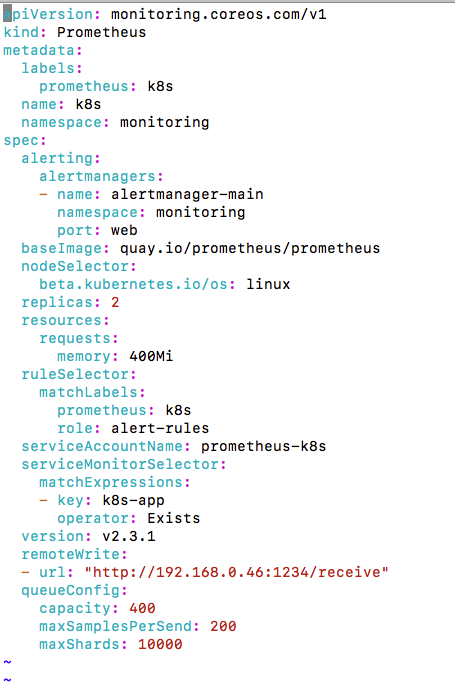
I'd like to use prometheus operator, but the memory consumption goes up too quickly when remotewrite is enabled.
remoteWrite:
- url: "http://192.168.0.46:1234/receive"
queueConfig:
capacity: 400
maxSamplesPerSend: 200
maxShards: 10000
I'm using the following test adapter to test the remote write:
https://github.com/prometheus/prometheus/blob/master/documentation/examples/remote_storage/example_write_adapter/server.go
benjaminhuo
on 9 Aug 2018
Could you please share all flags on your standalone Prometheus and the generated ones on the StatefulSet? With remote write there will always be overhead, as you create new queues of 400 capacity, which of course will always use memory.
brancz
on 13 Aug 2018
7GB+ of RAM used by prometheus (by each instance i.e. 14gb in peak with 2 replicas) for monitoring 4 nodes and ~50 services. Downscaled replicas to a single prometheus, ram usage dropped to 3Gb. Increased metrics interval from 30s to 60s - nothing changed. It really unusable in that way. Any advice? while I'm reading docs on "remote write"..
P.S. prometheus:v2.3.2
 Imunhatep
on 27 Sep 2018
Imunhatep
on 27 Sep 2018
Also seeing prometheus currently using 1G+ of RAM with default installation of kube-prometheus. This is only with a handful of pods running.
 rdubya16
on 27 Nov 2018
rdubya16
on 27 Nov 2018
@rdubya16 can you share the amount of samples you are ingesting per second? The query for that in Prometheus would be:
rate(prometheus_tsdb_head_samples_appended_total[5m])
@brancz Sure, looks to be around 1400
rdubya16
on 27 Nov 2018
A database that you are inserting 1400k records to per second doesn't seem like too much consumption at 1gb memory :slightly_smiling_face: .
brancz
on 27 Nov 2018
Sorry I edited my post. It was 1.4k. Its an default install, I havent tweaked it yet. Whatever its gathering is out of the box. I have 5 namespaces with 4-5 pods in each.
rdubya16
on 27 Nov 2018
The Kubernetes baseline is rather high (but can be optimized if that’s too much, you have tell prometheus to drop certain metrics). I run private 6 node clusters with ~70pods each and they have Prometheus at ~2k per second.
brancz
on 27 Nov 2018
Before Prometheus 1.6, tuning memory usage was difficult and unreliable. Between 1.6 and 2.0, there was the storage.local.target-heap-size option that prometheus-operator also takes advantage of - great! It will even do so automatically, taking into account memory request and overhead.
With 2.0 and later, this option seems to be gone, taking the only semi-reliable way of tuning memory consumption away. While that's less of a concern in a cluster with huge nodes, it can cause serious issues for anything else.
Simply setting limits on the template is not really an option either, as that will just get the Prometheus instances get OOM reaped when they eat too much memory, just as it frequently happened to me before 1.6.
I'm not doing any remote writes for the time being, but seeing memory usage grow to several GiB with only a handful pods makes me very uneasy. I really don't want to think of what's going to happen when I let it loose on my staging and production clusters (200-500 pods).
Setting a shorter retention time doesn't seem like a very reliable way of tuning memory usage either. Why was the heap-size option removed in Prometheus 2.0?
 onitake
on 11 Jan 2019
onitake
on 11 Jan 2019
@onitake , I've made some customization on kube-prometheus and the memory consumption has been controlled in a reasonable range, the actions taken include:
- scrape interval changed from 15s to 1m
- retention set to 7 days
- remove unnecessary alert rules and recording rules
the memory consumption is 11 GB on a 200 node k8s cluster with 8000 pod, without alert manager and grafana
benjaminhuo
on 13 Jan 2019
Thanks for sharing @benjaminhuo! For what it’s worth minimizing the retention shouldn’t impact memory usage as only the past 2 hours are in memory for Prometheus, so the biggest win that you applied was likely increasing the scrape interval. The retention primarily concerns disk usage as after the 2 hour range Prometheus writes the data in an immutable block to disk and uses mmap to have the kernel perform loading and eviction. What this means in the end is that Prometheus will only use memory for the data that is 2 hours old or older if you’re actually querying it.
brancz
on 14 Jan 2019
Thanks for those hints @benjaminhuo , I'll see if this helps. And thanks for the insight @brancz .
It still doesn't solve the underlying problem that Prometheus will use arbitrary amounts of memory, though. But as long as it stays in a sane range, I guess I can live with that.
onitake
on 14 Jan 2019
@onitake it doesn't. The point of the Prometheus 2.0 storage re-write is that Prometheus doesn't do eviction, but the Kernel does. This way the Kernel can evict memory from Prometheus when other processes need it, and at the same time do this much more precisely and efficiently than Prometheus could have done in-process. The stable (and non-evictable) overhead is what is in memory, as in the data within the latest 2 hour range.
brancz
on 14 Jan 2019
@brancz , It seems that the retention period does has something to do with the memory consumption.
The head block's (in memory) min-block-duration is 2hr, but the max-block-duration is 10% * retention period. So that means the longer the retention , the higher the upper limit of the head block memory consumption.
Another observation is that the recording rules and alerts rules also have something to do with the memory consumption, they increase the number of metrics to be scraped in my opinion.
So deleting unused recording rules and alert rules also helped to reduce the memory usage.
Ben
benjaminhuo
on 14 Jan 2019
The only way I see the retention affect the memory consumption is, if your dashboards constantly query the last week or so. Rules or Alerts spanning across multiple hours. Other than that, the memory should be pretty constant and only affect the last 2 hours.
With regards to alerting rules and recording rules, these don't do any scrapes, but alerting rules need to be evaluated, so yes they query internally and might increase the memory consumption. Recording rules on the other hand create aggregated copies of the metrics they work on (similar to materialized views in SQL databases).
 metalmatze
on 15 Jan 2019
metalmatze
on 15 Jan 2019
Compaction currently has some overhead, that is true, but you should be seeing it as spikes in memory, not overhead (Prometheus compacts blocks up to max-block-duration). The head chunk is always min-block-duration though.
Yes alerts and recording rules definitely can have an impact, if you have identified problematic ones please share them :slightly_smiling_face: .
brancz
on 15 Jan 2019
Thanks @metalmatze and @brancz for the explanation, it's good to know these details of prometheus.
Ben
benjaminhuo
on 16 Jan 2019
So, after following your advice and setting the scrape interval to 1 minute, my Prometheus instance is consuming less memory, but it keeps growing, even after filling up the retention period (which shouldn't have made a difference anyway).
I see a very odd pattern: memory usage grows constantly, and there's some kind of garbage collection every hour. But every 3 hours, this garbage collection doesn't happen.
If this was code I had written myself, I'd be chasing a memory leak now.
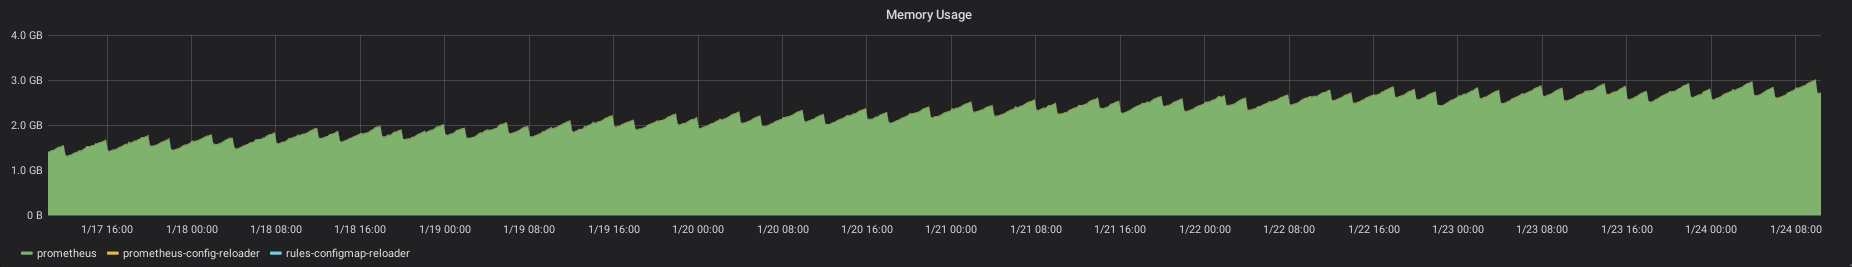
The pod has been running for ~9 days now, and the graph show the memory consumption of the last 7 days.
Do you have an explanation on what's happening here and how I can prevent Prometheus from hitting the limits? I really don't want to give the pod unlimited memory and hope for the best.
onitake
on 24 Jan 2019
@onitake
As I can remember, this graph you saw includes buffer/cache. The memory consumption should be much stable if you run kubectl top .
Another tip is that if you check the prometheus config , you'll notice that there are lots of scrape interval related setting like below, make sure you've changed all that:
coredns
kube-apiserver
kube-controller-manager
kube-scheduler
kube-state-metrics
kubelet
node-exporter
prometheus
prometheus-operator
benjaminhuo
on 25 Jan 2019
@benjaminhuo I'm pretty sure that it doesn't, as that would make absolutely no sense in the context of k8s resource allocation and cgroup limits.
I've been watching memory consumption for a bit longer, and also on a cluster with more activity.
It seems like it's settling around 3.2GB. On the cluster where the graph above was generated, consumption rises slowly, so it's difficult to see immediate effects. On the other cluster, the spikes are much steeper and it settles earlier.
I assumed that the only component relevant to scrape tuning was Prometheus itself, as the ServiceMonitors shouldn't initiate scrapes and store any data of their own. But I'll take a look.
onitake
on 28 Jan 2019
Ok, it seems like you were right about cache being included: https://github.com/google/cadvisor/issues/1744 (can't find any relevant documentation aside from that)
W/r to that, the metric container_memory_usage_bytes doesn't seem very useful for alerting, debugging and tuning purposes, as caches can go up and down depending on available memory. If I subtract cache memory, the prometheus pod on the smaller cluster consumes ~600MB, while on the large one it's around 1GB and stays more or less stable. That's still huge, but much more reasonable than 3GB+.
Thanks for pointing me in the right direction!
onitake
on 28 Jan 2019
Sorry for not being very responsive. Could you show the amount of metrics ingested per second over the same time period? The query for that is:
rate(prometheus_tsdb_head_samples_appended_total[5m])
You probably rather want to look at container_memory_rss. For a point of reference a rather large cluster of ours ingests ~13k samples per second at ~4Gb container_memory_rss.
brancz
on 28 Jan 2019
On the small cluster, I get ~ 2350 samples/5min . On the larger one, it's 6000-7000.
onitake
on 29 Jan 2019
The range query just means over which time-ranges to interpolate the rate over, so that's 2350 samples per second and 6-7000 per second your large one. I don't know, that's 600 million data points per day, I don't think that's a lot of memory usage.
brancz
on 29 Jan 2019
I'm also seeing huge memory usage on the prometheus pod (over 5G). My cluster has > 30 nodes and running an average of 1000 pods.
Is there a sizing guide to help tune this? Is vertical sizing the only way to scale? Recommended settings for the helm chart?
I've installed latest stable prometheus-operator using helm.
 eldada
on 7 Feb 2019
eldada
on 7 Feb 2019
Same question, how many time-series are you ingesting?
rate(prometheus_tsdb_head_samples_appended_total[5m])
And this one is a relatively expensive query, but allows you to figure out which metrics might have high cardinality (possibly a cardinality explosion):
topk(10, count({job=~".+"}) by(__name__))
@brancz Thanks for your explanations. Together with the better memory metrics (as posted in https://github.com/kubernetes-monitoring/kubernetes-mixin/issues/152#issuecomment-461873645 ), I'm now much more confident about using Prometheus and prometheus-operator.
onitake
on 8 Feb 2019
Thanks for the awesome suggestions! :)
brancz
on 8 Feb 2019
@brancz - I ran the queries as suggested.
rate(prometheus_tsdb_head_samples_appended_total[5m])
I get > 33000 (!)
topk(10, count({job=~".+"}) by(__name__))
I see the following:
container_network_tcp_usage_total{}   | 154649
container_tasks_state{}               | 70295
container_network_udp_usage_total{}     | 56236
container_memory_failures_total{}       | 56236
storage_operation_duration_seconds_bucket{} | 18810
container_fs_reads_total{}                     | 17627
container_fs_writes_total{}                    | 17627
container_spec_memory_limit_bytes{}  | 14059
container_memory_swap{}              | 14059
...
How can I tune this?
eldada
on 10 Feb 2019
As done by https://github.com/coreos/prometheus-operator/pull/2387, some of the highest cardinality metrics you have there (container_network_tcp_usage_total, container_tasks_state, container_network_udp_usage_total) are automatically dropped, so just updating would get you those changes, just doing that will give you almost 300k less active time-series :slightly_smiling_face: . For the others, you can just do the same method, if you don't need them, but the network metrics are even disabled so collecting them is just a waste (as described in the pull request).
brancz
on 18 Feb 2019
Sounds good! What version of prometheus-operator is it? Is it already in the official chart?
eldada
on 18 Feb 2019
The "prometheus-operator" chart on the upstream charts repo is incorrectly named, it should be named "kube-prometheus", and we don't maintain it, it is entirely community maintained.
If you use master of this repositories kube-prometheus, you will get it automatically.
brancz
on 21 Feb 2019
This issue has been automatically marked as stale because it has not had any activity in last 60d. Thank you for your contributions.
![stale[bot] picture](https://avatars3.githubusercontent.com/in/1724?v=4&s=40) stale[bot]
on 14 Aug 2019
stale[bot]
on 14 Aug 2019
This issue has been automatically marked as stale because it has not had any activity in last 60d. Thank you for your contributions.
stale[bot]
on 20 Oct 2019
Closing due to inactivity.
brancz
on 21 Oct 2019
Related issues
 wleese
·
49Comments
wleese
·
49Comments
 Capitrium
·
43Comments
Capitrium
·
43Comments
 ellen-lau
·
32Comments
brancz
·
44Comments
ellen-lau
·
32Comments
brancz
·
44Comments
 simox-83
·
47Comments
simox-83
·
47Comments
Most helpful comment
@brancz Thanks for your explanations. Together with the better memory metrics (as posted in https://github.com/kubernetes-monitoring/kubernetes-mixin/issues/152#issuecomment-461873645 ), I'm now much more confident about using Prometheus and prometheus-operator.