Prometheus-operator: [Helm] Separated Prometheus doesnt have Alertmanager endpoints
I wanted to deploy a separated Prometheus (to create a CRD Prometheus and let Operator generates configs ). I already deployed kube-prometheus before and it's working FINE.
I used this command to deploy one more Prometheus (And only Prometheus, no Alertmanager, no Grafana, No rules, No Servicemonitors):
cd helm/prometheus
helm install -n prometheus-app -f prometheus-app-values.yaml
And I got 2 Prometheus CRD
kk get prometheus
NAME                         AGE
kube-prometheus-prometheus   9d
prometheus-app               16m
I specified Alertmanager endpoints in prometheus-app-values.yaml like this (I wanted to send the alert to previous deployed Alertmanager):
alertingEndpoints:
  - name: "kube-prometheus-alertmanager"
     namespace: "monitoring"
     port: 9093
     scheme: http
And my "kube-prometheus-alertmanager" Endpoint object already created before like this:
kubectl get endpoints
kube-prometheus-alertmanager          100.110.210.106:9093,100.110.210.118:9093
I expected the newly created prometheus's alertmanager should be like this (this is the Prometheus of kube-prometheus, which is already deployed before and is working fine):
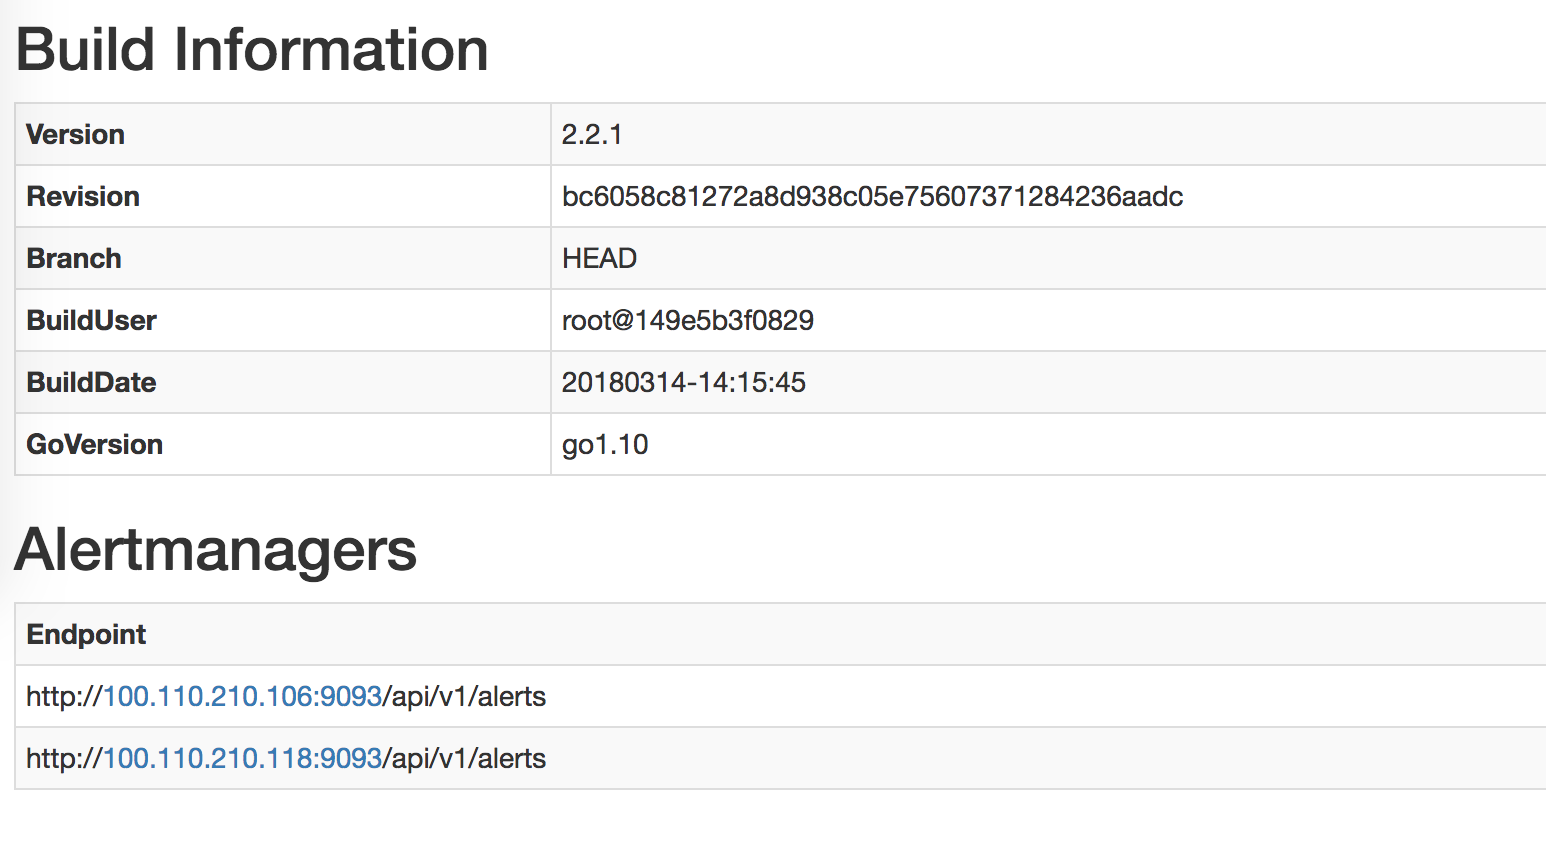
However, this Alertmanager section of the separated Prometheus is BLANK.
So how should I deploy a separated Prometheus properly ?
 kyledakid
All 33 comments
Please post the dump of your prometheus and alertmanager CRDS
 gianrubio
on 25 May 2018
gianrubio
on 25 May 2018
Could you also share the logs of that Prometheus server, this looks like an RBAC problem, where the Prometheus server is not allowed to discover the Alertmanager in the monitoring namespace. The solution to that would be to create a Role in the monitoring namespace and bind it to the serviceaccount the Prometheus server uses in the prometheus-app namespace.
 brancz
on 25 May 2018
brancz
on 25 May 2018
I tried to disable RBAC and also PSP, no luck (even helm del and reinstall, not just upgrade). I'm installing all these Prometheus instances in the same namespace "Devops"
Prometheus "kube-prometheus-prometheus" CRD (This is working fine):
apiVersion: monitoring.coreos.com/v1
kind: Prometheus
metadata:
clusterName: ""
creationTimestamp: 2018-05-28T07:55:30Z
labels:
app: prometheus
chart: prometheus-0.0.38
heritage: Tiller
prometheus: kube-prometheus-prometheus
release: kube-prometheus
name: kube-prometheus-prometheus
namespace: devops
resourceVersion: "11048846"
selfLink: /apis/monitoring.coreos.com/v1/namespaces/devops/prometheuses/kube-prometheus-prometheus
uid: 7e32db6a-624c-11e8-9534-0612bfc1fd24
spec:
affinity:
podAntiAffinity:
preferredDuringSchedulingIgnoredDuringExecution:
- podAffinityTerm:
labelSelector:
matchLabels:
app: prometheus
prometheus: kube-prometheus
topologyKey: kubernetes.io/hostname
weight: 100
alerting:
alertmanagers:
- name: kube-prometheus-alertmanager
namespace: devops
port: http
baseImage: quay.io/prometheus/prometheus
externalUrl: https://prometheus.v1.k8s.linkplatforms.com
logLevel: info
paused: false
replicas: 2
resources: {}
retention: 45d
routePrefix: /
ruleSelector:
matchLabels:
prometheus: kube-prometheus
role: alert-rules
serviceMonitorSelector:
matchExpressions:
- key: app
operator: In
values:
- alertmanager
- exporter-coredns
- exporter-kube-controller-manager
- exporter-kube-dns
- exporter-kube-etcd
- exporter-kube-scheduler
- exporter-kube-state
- exporter-kubelets
- exporter-kubernetes
- exporter-node
- grafana
- prometheus
- prometheus-operator
storage:
volumeClaimTemplate:
spec:
accessModes:
- ReadWriteOnce
resources:
requests:
storage: 400Gi
storageClassName: ebs-us-east-1a
tolerations:
- effect: NoSchedule
key: type
operator: Equal
value: MONITOR
version: v2.2.1
Prometheus "prometheus-app-prometheus" CRD (This is having blank Alertmanger endpoints):
apiVersion: monitoring.coreos.com/v1
kind: Prometheus
metadata:
clusterName: ""
creationTimestamp: 2018-05-28T07:57:06Z
labels:
app: prometheus
chart: prometheus-0.0.38
heritage: Tiller
prometheus: prometheus-app-prometheus
release: prometheus-app
name: prometheus-app-prometheus
namespace: devops
resourceVersion: "11049393"
selfLink: /apis/monitoring.coreos.com/v1/namespaces/devops/prometheuses/prometheus-app-prometheus
uid: b76b12c9-624c-11e8-9534-0612bfc1fd24
spec:
affinity:
podAntiAffinity:
preferredDuringSchedulingIgnoredDuringExecution:
- podAffinityTerm:
labelSelector:
matchLabels:
app: prometheus
prometheus: prometheus-app
topologyKey: kubernetes.io/hostname
weight: 100
alerting:
alertmanagers:
- name: kube-prometheus-alertmanager
namespace: devops
port: 9093
scheme: http
baseImage: quay.io/prometheus/prometheus
externalUrl: http://prometheus-app.v1.k8s.linkplatforms.com
logLevel: info
paused: false
replicas: 1
resources: {}
retention: 24h
routePrefix: /
ruleSelector:
matchLabels:
prometheus: prometheus-app
role: alert-rules
tolerations:
- effect: NoSchedule
key: type
operator: Equal
value: MONITOR
version: v2.2.1
Alertmanager "kube-prometheus" CRD (I'm only using this alertmanager):
apiVersion: v1
items:
- apiVersion: monitoring.coreos.com/v1
kind: Alertmanager
metadata:
clusterName: ""
creationTimestamp: 2018-05-28T07:55:30Z
labels:
alertmanager: kube-prometheus
app: alertmanager
chart: alertmanager-0.1.2
heritage: Tiller
release: kube-prometheus
name: kube-prometheus
namespace: devops
resourceVersion: "11048826"
selfLink: /apis/monitoring.coreos.com/v1/namespaces/devops/alertmanagers/kube-prometheus
uid: 7e2d7167-624c-11e8-9534-0612bfc1fd24
spec:
affinity:
podAntiAffinity:
preferredDuringSchedulingIgnoredDuringExecution:
- podAffinityTerm:
labelSelector:
matchLabels:
alertmanager: kube-prometheus
app: alertmanager
topologyKey: kubernetes.io/hostname
weight: 100
baseImage: quay.io/prometheus/alertmanager
externalUrl: https://alarm.v1.k8s.linkplatforms.com
paused: false
replicas: 2
resources: {}
storage:
volumeClaimTemplate:
spec:
accessModes:
- ReadWriteOnce
resources:
requests:
storage: 50Gi
storageClassName: ebs-us-east-1a
tolerations:
- effect: NoSchedule
key: type
operator: Equal
value: MONITOR
version: v0.14.0
kind: List
metadata:
resourceVersion: ""
selfLink: ""
This is the log of the newly created Prometheus pod
level=info ts=2018-05-28T07:57:09.189450451Z caller=main.go:220 msg="Starting Prometheus" version="(version=2.2.1, branch=HEAD, revision=bc6058c81272a8d938c05e75607371284236aadc)"
level=info ts=2018-05-28T07:57:09.189515625Z caller=main.go:221 build_context="(go=go1.10, user=root@149e5b3f0829, date=20180314-14:15:45)"
level=info ts=2018-05-28T07:57:09.189542874Z caller=main.go:222 host_details="(Linux 4.4.0-1013-aws #22-Ubuntu SMP Fri Mar 31 15:41:31 UTC 2017 x86_64 prometheus-prometheus-app-prometheus-0 (none))"
level=info ts=2018-05-28T07:57:09.189572115Z caller=main.go:223 fd_limits="(soft=1048576, hard=1048576)"
level=info ts=2018-05-28T07:57:09.192145999Z caller=main.go:504 msg="Starting TSDB ..."
level=info ts=2018-05-28T07:57:09.192562544Z caller=web.go:382 component=web msg="Start listening for connections" address=0.0.0.0:9090
level=info ts=2018-05-28T07:57:09.19811879Z caller=main.go:514 msg="TSDB started"
level=info ts=2018-05-28T07:57:09.198150577Z caller=main.go:588 msg="Loading configuration file" filename=/etc/prometheus/config_out/prometheus.env.yaml
level=info ts=2018-05-28T07:57:09.198224142Z caller=main.go:491 msg="Server is ready to receive web requests."
level=info ts=2018-05-28T07:57:13.611468707Z caller=main.go:588 msg="Loading configuration file" filename=/etc/prometheus/config_out/prometheus.env.yaml
The content of "prometheus.env.yaml" is blank, so I tried to cat "/etc/prometheus/prometheus.yml" in case you guys need it @brancz :
# my global config
global:
scrape_interval: 15s # Set the scrape interval to every 15 seconds. Default is every 1 minute.
evaluation_interval: 15s # Evaluate rules every 15 seconds. The default is every 1 minute.
# scrape_timeout is set to the global default (10s).
# Alertmanager configuration
alerting:
alertmanagers:
- static_configs:
- targets:
# - alertmanager:9093
# Load rules once and periodically evaluate them according to the global 'evaluation_interval'.
rule_files:
# - "first_rules.yml"
# - "second_rules.yml"
# A scrape configuration containing exactly one endpoint to scrape:
# Here it's Prometheus itself.
scrape_configs:
# The job name is added as a label `job=<job_name>` to any timeseries scraped from this config.
- job_name: 'prometheus'
# metrics_path defaults to '/metrics'
# scheme defaults to 'http'.
static_configs:
- targets: ['localhost:9090']
Your second Prometheus object does not have a serviceMonitorSelector set, which is an older artifact from the early days of the Prometheus Operator, where this was the method of supplying a custom configuration for Prometheus, which is why you're not seeing one in the container. Simply set that field to serviceMonitorSelector: {}, which will select all ServiceMonitor objects in that namespace.
brancz
on 28 May 2018
serviceMonitorSelector: {} it currently is. But what I care about is the Alertmanager. I dont think it relates to serviceMonitorSelector (please correct me if I'm wrong)
kyledakid
on 28 May 2018
It does matter, as the Prometheus configuration is not generated at all (and therefore the Alertmanager configuration as well). In the above manifest that you shared "prometheus-app-prometheus", I don't see a serviceMonitorSelector at all.
brancz
on 28 May 2018
Ah, I removed all of them. I dont need them on the new Prometheus. My new Prometheus is only for monitoring my app's services.
You expected these ?
serviceMonitorSelector:
matchExpressions:
- key: app
operator: In
values:
- alertmanager
- exporter-coredns
- exporter-kube-controller-manager
- exporter-kube-dns
- exporter-kube-etcd
- exporter-kube-scheduler
- exporter-kube-state
- exporter-kubelets
- exporter-kubernetes
- exporter-node
- grafana
- prometheus
- prometheus-operator
Simply set that field to serviceMonitorSelector: {}
Yes, it currently is
kyledakid
on 28 May 2018
Even for monitoring your apps, you need a ServiceMonitor selector, even if it just selects the one ServiceMonitor.
Note that no serviceMonitorSelector is not the same as serviceMonitorSelector: {}.
brancz
on 28 May 2018
Hi brancz,
I set serviceMonitorSelector and tried to use serviceaccount from the currently running "kube-prometheus". Still no luck. The new Prometheus instance doesnt have Alertmanager and also can not scrape defined serviceMonitorSelector
My new Prometheus instance output:
apiVersion: monitoring.coreos.com/v1
kind: Prometheus
metadata:
clusterName: ""
creationTimestamp: 2018-05-29T09:37:27Z
generation: 0
labels:
app: prometheus
chart: prometheus-0.0.29
heritage: Tiller
prometheus: prometheus-app
release: prometheus-app
name: prometheus-app
namespace: devops
resourceVersion: "11391234"
selfLink: /apis/monitoring.coreos.com/v1/namespaces/devops/prometheuses/prometheus-app
uid: e65e5044-6323-11e8-9534-0612bfc1fd24
spec:
affinity:
podAntiAffinity:
preferredDuringSchedulingIgnoredDuringExecution:
- podAffinityTerm:
labelSelector:
matchLabels:
app: prometheus
prometheus: prometheus-app
topologyKey: kubernetes.io/hostname
weight: 100
alerting:
alertmanagers:
- name: kube-prometheus-alertmanager <<<< This is being used by kube-prometheus
namespace: devops
port: 9093
scheme: http
baseImage: quay.io/prometheus/prometheus
externalUrl: http://prometheus-app.v1.k8s.linkplatforms.com
logLevel: info
paused: false
replicas: 1
resources: {}
retention: 24h
routePrefix: /
ruleSelector:
matchLabels:
prometheus: prometheus-app
role: alert-rules
serviceAccountName: kube-prometheus-prometheus <<<< this is being used by kube-prometheus
serviceMonitorSelector:
matchExpressions:
- key: app
operator: In
values:
- scheduler-extender-scheduler-extender . <<<< this is being scraped by kube-prometheus, no problem
tolerations:
- effect: NoSchedule
key: type
operator: Equal
value: MONITOR
version: v2.2.1
Log output of Prometheus container:
level=info ts=2018-05-29T09:40:11.175521655Z caller=main.go:220 msg="Starting Prometheus" version="(version=2.2.1, branch=HEAD, revision=bc6058c81272a8d938c05e75607371284236aadc)"
level=info ts=2018-05-29T09:40:11.17559311Z caller=main.go:221 build_context="(go=go1.10, user=root@149e5b3f0829, date=20180314-14:15:45)"
level=info ts=2018-05-29T09:40:11.175611925Z caller=main.go:222 host_details="(Linux 4.4.0-1013-aws #22-Ubuntu SMP Fri Mar 31 15:41:31 UTC 2017 x86_64 prometheus-prometheus-app-0 (none))"
level=info ts=2018-05-29T09:40:11.175625268Z caller=main.go:223 fd_limits="(soft=1048576, hard=1048576)"
level=info ts=2018-05-29T09:40:11.178269611Z caller=main.go:504 msg="Starting TSDB ..."
level=info ts=2018-05-29T09:40:11.178729482Z caller=web.go:382 component=web msg="Start listening for connections" address=0.0.0.0:9090
level=info ts=2018-05-29T09:40:11.185438574Z caller=main.go:514 msg="TSDB started"
level=info ts=2018-05-29T09:40:11.185469975Z caller=main.go:588 msg="Loading configuration file" filename=/etc/prometheus/config_out/prometheus.env.yaml
level=info ts=2018-05-29T09:40:11.186530425Z caller=kubernetes.go:191 component="discovery manager notify" discovery=k8s msg="Using pod service account via in-cluster config"
level=info ts=2018-05-29T09:40:11.187098879Z caller=main.go:491 msg="Server is ready to receive web requests."
level=info ts=2018-05-29T09:40:15.507121236Z caller=main.go:588 msg="Loading configuration file" filename=/etc/prometheus/config_out/prometheus.env.yaml
level=info ts=2018-05-29T09:40:15.507841221Z caller=kubernetes.go:191 component="discovery manager notify" discovery=k8s msg="Using pod service account via in-cluster config"
Log output of prometheus-config-reloaded container:
level=info ts=2018-05-29T09:40:10.20955281Z caller=reloader.go:77 msg="started watching config file for changes" in=/etc/prometheus/config/prometheus.yaml out=/etc/prometheus/config_out/prometheus.env.yaml
level=error ts=2018-05-29T09:40:10.906917537Z caller=runutil.go:43 msg="function failed. Retrying" err="trigger reload: reload request failed: Post http://localhost:9090/-/reload: dial tcp [::1]:9090: connect: connection refused"
level=info ts=2018-05-29T09:40:15.50864304Z caller=reloader.go:182 msg="Prometheus reload triggered" cfg_in=/etc/prometheus/config/prometheus.yaml cfg_out=/etc/prometheus/config_out/prometheus.env.yaml rule_dir=/etc/prometheus/config_out/rules
level=debug ts=2018-05-29T09:40:15.508704853Z caller=reloader.go:97 msg="received watch event" op=CHMOD name=/etc/prometheus/config/prometheus.yaml
level=debug ts=2018-05-29T09:40:15.606862411Z caller=reloader.go:97 msg="received watch event" op=CHMOD name=/etc/prometheus/config/prometheus.yaml
Can you share what you can see in the /config page in the Prometheus UI? (this is the currently loaded configuration)
brancz
on 29 May 2018
Here you are
global:
scrape_interval: 30s
scrape_timeout: 10s
evaluation_interval: 30s
external_labels:
prometheus: devops/prometheus-app
prometheus_replica: prometheus-prometheus-app-0
alerting:
alert_relabel_configs:
- separator: ;
regex: prometheus_replica
replacement: $1
action: labeldrop
alertmanagers:
- kubernetes_sd_configs:
- api_server: null
role: endpoints
namespaces:
names:
- devops
scheme: http
path_prefix: /
timeout: 10s
relabel_configs:
- source_labels: [__meta_kubernetes_service_name]
separator: ;
regex: kube-prometheus-alertmanager
replacement: $1
action: keep
- source_labels: [__meta_kubernetes_container_port_number]
separator: ;
regex: "9093"
replacement: $1
action: keep
rule_files:
- /etc/prometheus/config_out/rules/rules-0/*
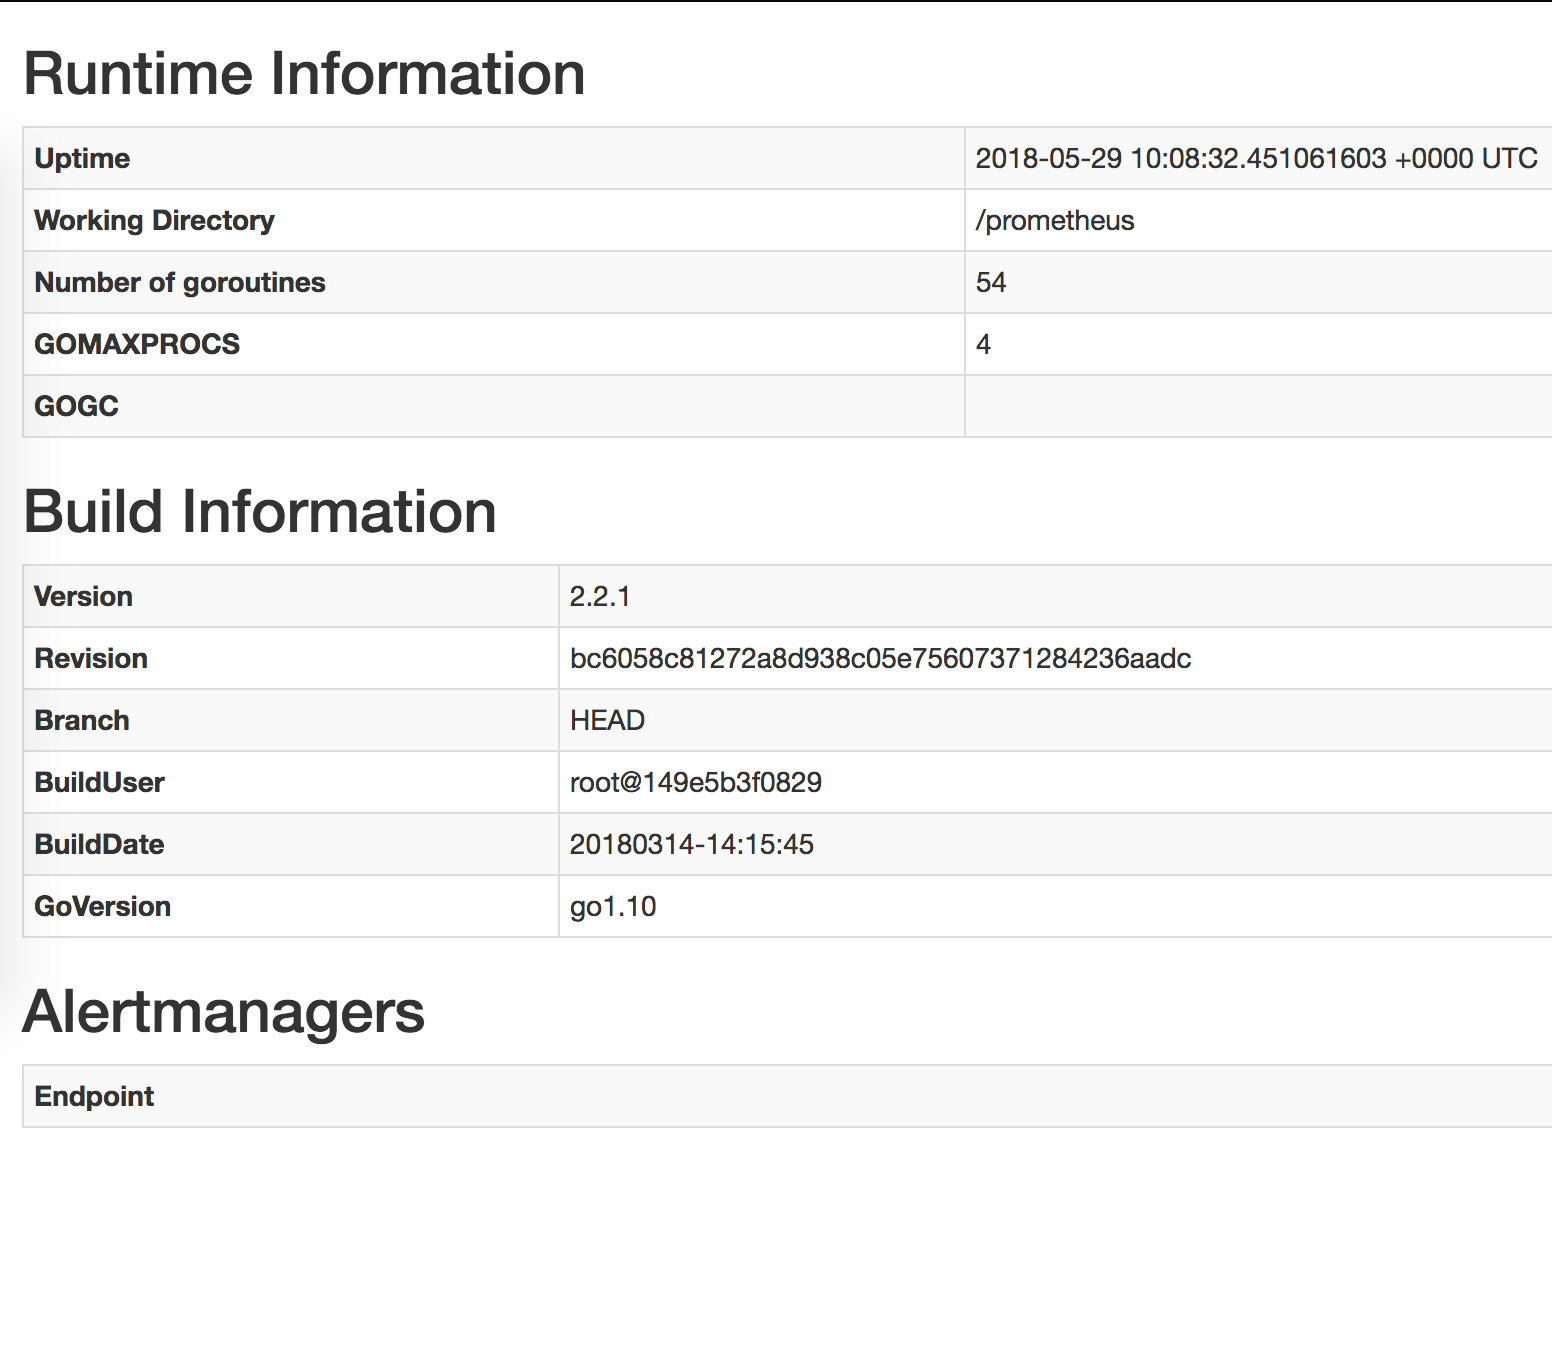
And the blank Alertmanager Endpoint also:
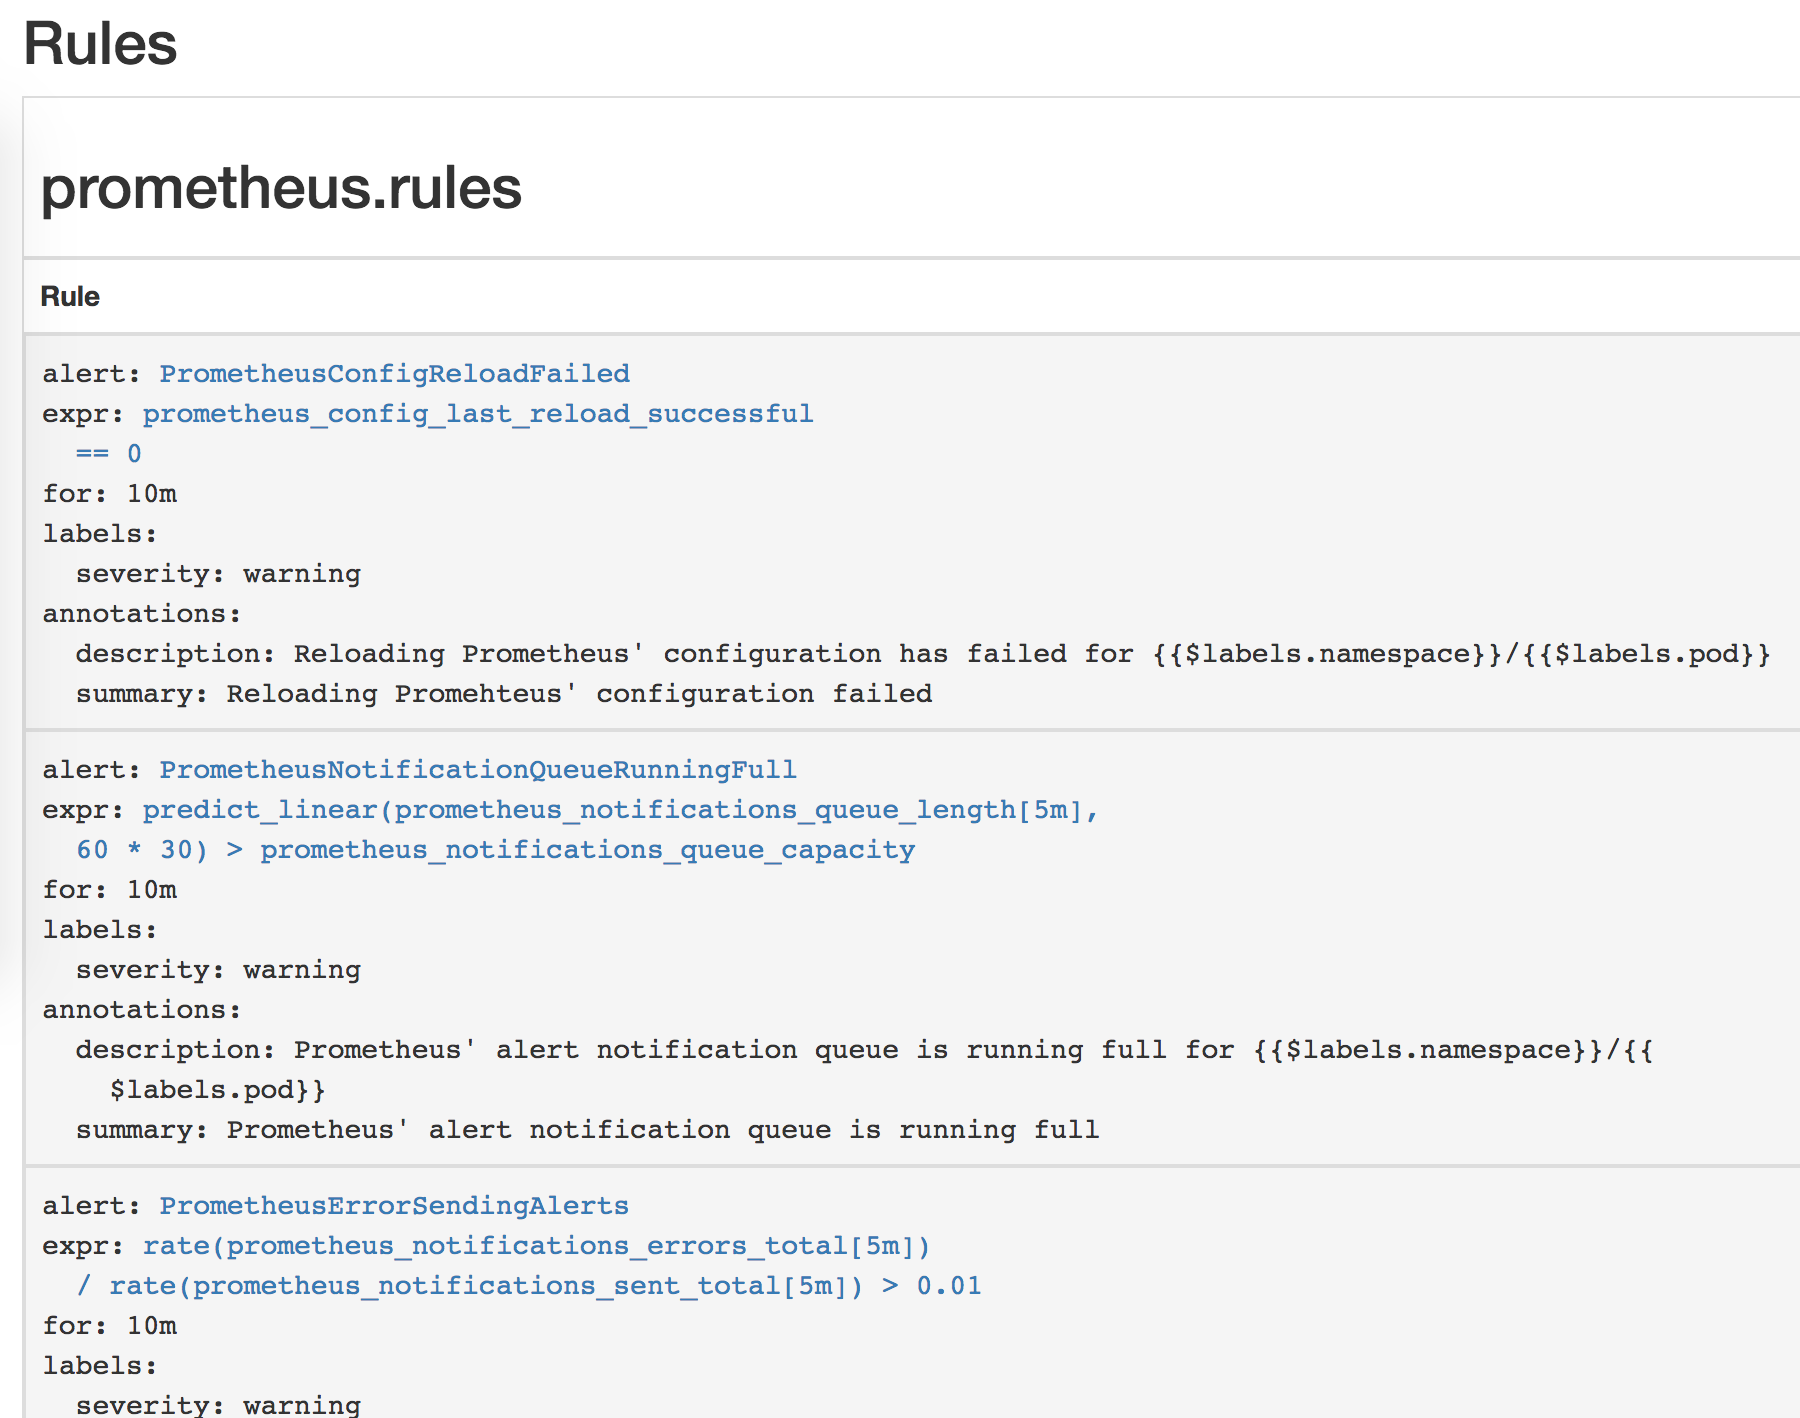
Some Prometheus rules in helm
"Targets" and "Service discovery" is blank
kyledakid
on 30 May 2018
Can you share the output of kubectl -n devops get svc,endpoints? The configuration looks correct at first sight.
brancz
on 30 May 2018
Okay, brancz.
kk get svc,endpoints
NAME TYPE CLUSTER-IP EXTERNAL-IP PORT(S) AGE
alertmanager-operated ClusterIP None <none> 9093/TCP,6783/TCP 26d
kube-prometheus-alertmanager ClusterIP 100.71.230.248 <none> 9093/TCP 2d
kube-prometheus-exporter-kube-state ClusterIP 100.69.44.221 <none> 80/TCP 2d
kube-prometheus-exporter-node ClusterIP 100.65.11.145 <none> 9100/TCP 2d
kube-prometheus-grafana ClusterIP 100.71.181.52 <none> 80/TCP 2d
kube-prometheus-prometheus ClusterIP 100.70.245.240 <none> 9090/TCP 2d
prometheus-app-prometheus ClusterIP 100.69.209.121 <none> 9090/TCP 15s
prometheus-operated ClusterIP None <none> 9090/TCP 27d
NAME ENDPOINTS AGE
alertmanager-operated 100.110.210.84:9093,100.110.210.89:9093,100.110.210.84:6783 + 1 more... 26d
kube-prometheus-alertmanager 100.110.210.84:9093,100.110.210.89:9093 2d
kube-prometheus-exporter-kube-state 100.105.133.188:8080 2d
kube-prometheus-exporter-node 10.101.20.118:9100,10.101.20.239:9100,10.101.22.155:9100 + 17 more... 2d
kube-prometheus-grafana 100.110.210.86:3000 2d
kube-prometheus-prometheus 100.110.210.87:9090,100.110.210.90:9090 2d
prometheus-app-prometheus 100.105.133.134:9090 15s
prometheus-operated 100.105.133.134:9090,100.110.210.87:9090,100.110.210.90:9090 27d
I believe you may just need to change the port from the number to web.
brancz
on 30 May 2018
you mean this ?
alertingEndpoints:
- name: "kube-prometheus-alertmanager"
namespace: "monitoring"
port: 9093 -> web
scheme: http
Yes
brancz
on 30 May 2018
Sorry, still no luck. Does this work on your environment ?
The way to reproduce is simple. Just install coreos's prometheus helm chart to get one more Prometheus CRD object. Am I doing the right way to create one more Prometheus ?
kyledakid
on 30 May 2018
Ah wait, your alertmanager endpoints say the monitoring namespace, whereas you are expecting it to be devops, no?
brancz
on 31 May 2018
Ah no, I just copied and pasted from the first comment to clarify my example. The current config is "devops".
kyledakid
on 31 May 2018
Sorry it's quite confusing, could you share again all the manifests you currently have applied against your cluster, as well as the generated configuration?
brancz
on 31 May 2018
That's a lot of information. Could you please do as I suggested to reproduce ?
(all of this are in the same whatever namespace)
(1) helm install prometheus-operator
(2) helm install kube-prometheus
(3) helm install prometheus (from this project's prometheus helm chart and set Alertmanager's value to the above kube-prometheus's)
And then go to the new Prometheus (3) homepage (not the kube-prometheus's prometheus) to find out if there's Alertmanager
kyledakid
on 31 May 2018
I don't use helm, maybe @gianrubio can try and help with reproducing.
brancz
on 31 May 2018
Okie, @gianrubio please take a look at this.
kyledakid
on 31 May 2018
I believe I'm seeing a similar problem.
I've installed the prometheus-operator, prometheus, and alertmanager helm charts.
I've set the following values for the prometheus chart:
alertingEndpoints:
- name: alertmanager
namespace: monitoring
port: 9093 (also tried "web")
scheme: http
...
I too am seeing that Prometheus is not finding any alertmanager endpoints.
(I am using the "monitoring" namespace).
FWIW, I don't currently have the kube-prometheus chart installed, but I did have then removed it. I doubt it's related, but worth mentioning.
 ball-hayden
on 31 May 2018
ball-hayden
on 31 May 2018
@ball-hayden your problem might be that alertingEndpoints should be alertmangers.
brancz
on 31 May 2018
@brancz I believe the helm chart uses alertingEndpoints:
https://github.com/coreos/prometheus-operator/blob/82761eff2e9a923c256604e82a99d3c95b2d7faa/helm/prometheus/values.yaml#L4
Using alertmanagers in my Prometheus helm values results in a Prometheus resource with:
Alerting:
Alertmanagers:
Name: prometheus-alertmanager
Namespace: monitoring
Port: http
which definitely isn't right.
If I use the config in my previous comment, I see the following Prometheus resource produced:
Spec:
...
Alerting:
Alertmanagers:
Name: alertmanager
Namespace: monitoring
Port: 9093
Scheme: http
which looks more correct (but still results in no alertmanager being picked up by Prometheus)
ball-hayden
on 31 May 2018
Wait. Gotcha.
That default config has "port: http".
The following Helm values worked for me @vielktus - maybe you've seen the same thing:
alertingEndpoints:
  - name: alertmanager
    namespace: monitoring
    port: http
    scheme: http
Quite why the port should be "http", not "9093" nor "web" as suggested above, I don't know...
ball-hayden
on 31 May 2018
If that is the case, I'd suggest the bug here is the comments in the default Values.yaml (specifically line 7):
ball-hayden
on 31 May 2018
Really appreciate @ball-hayden . You've just saved my life. This bug frustrated me for whole 2 weeks.
I changed that to http and my new Prometheus can finally use the existing Alertmanager.
So is this a bug ? Why http ? We might need your wise @brancz @gianrubio
kyledakid
on 31 May 2018
Excellent. If nothing else, I'll get a PR together to update that comment!
ball-hayden
on 31 May 2018
Thanks a lot for taking the time to look into this, we appreciate it greatly! Honestly I was assuming web as that's that it is in the kube-prometheus manifests which the helm charts are based off of, my mistake. Glad it worked out! It's just a naming thing so I think at least in the near term we can fix the documentation and think about how we can in the long term have the two sets of manifests be consistent.
Again, thanks a ton for investigating and solving this!
brancz
on 31 May 2018
Not so much taking the time to investigate as banging into the same problem and getting lucky!
It would be great if it could become more consistent, or if port could be renamed to avoid confusion - a port number seems like the expected value to me, so I definitely overlooked that as the possible source of the issue.
ball-hayden
on 31 May 2018
Related issues
 emas80
·
30Comments
emas80
·
30Comments
 Capitrium
·
43Comments
Capitrium
·
43Comments
 galexrt
·
32Comments
brancz
·
44Comments
galexrt
·
32Comments
brancz
·
44Comments
 simox-83
·
47Comments
simox-83
·
47Comments
Most helpful comment
Wait. Gotcha.
That default config has "port: http".
The following Helm values worked for me @vielktus - maybe you've seen the same thing:
Quite why the port should be "http", not "9093" nor "web" as suggested above, I don't know...