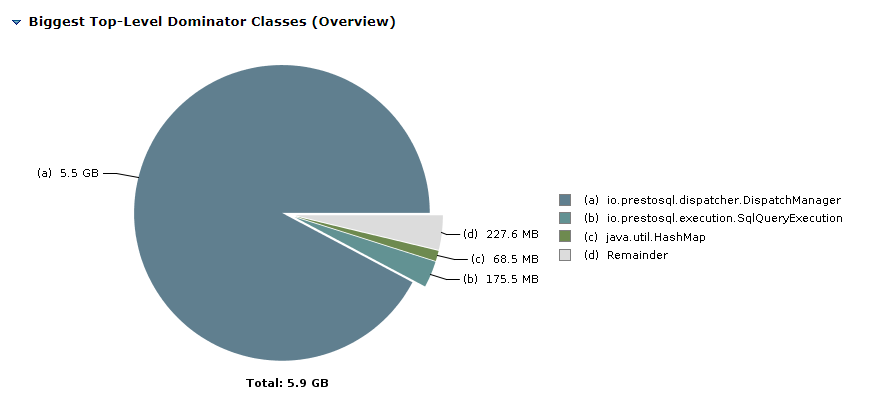
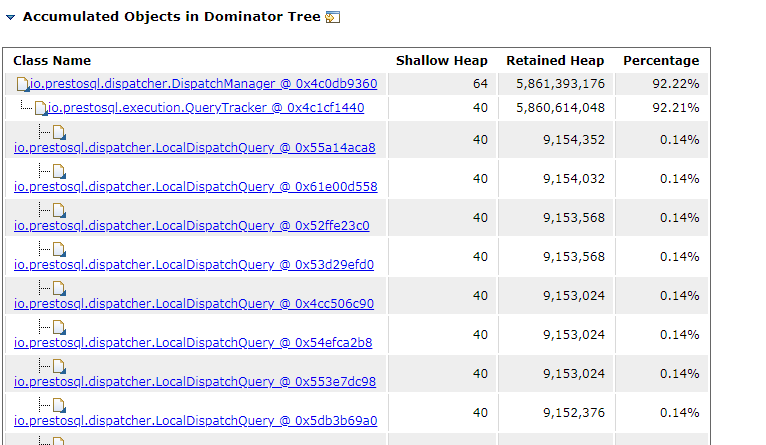
Presto: There are 5.5 GB more LocalDispatchQuery objects In coordinator's GC stack after a lone time pressure test.
There are more and more LocalDispatchQuery object in coordinator's GC stack after a long time pressure test(6 more hours).
Then the performance of presto will be very low.
So I dumped the hprof file of jvm and I found that there are 5.5 GB more LocalDispatchQuery object.
I am using a presto-hbase connector to fetch data from HBase.
What should I do? Is this a bug of presto?
 Crossoverrr
All 10 comments
My presto version is prestosql-312.
Crossoverrr
on 4 Jul 2019
@Crossoverrr there was a know memory leak in 312. Could you please redo your test in 315?
 findepi
on 4 Jul 2019
findepi
on 4 Jul 2019
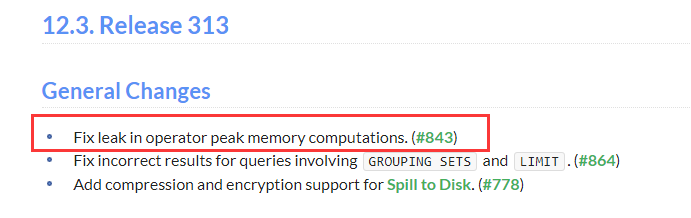
Do you mean the #843 "Fix leak in operator peak memory computations" in prestosql-313?
Thank you very much @findepi , I will try that 315.
Crossoverrr
on 4 Jul 2019
@Crossoverrr no, not this one. I don't remember which exactly, but you should be good with 315 anyway.
Let me close the issue for now. If you still experience _the same_ memory leak in 315, please reopen.
If you experience some other problem, please create a new issue.
Also, I recommend you join the #troubleshooting channel on Presto Slack (https://prestosql.io/community.html) if you haven't yet joined.
Thanks!
findepi
on 4 Jul 2019
Thanks again!
According to our pressure test results, most of the query scenarios showed a 10% to 20% improvement in performance, which made us very excited!
Crossoverrr
on 5 Jul 2019
@Crossoverrr glad to hear that! This is huge! If you consider blogging about this, let us know (eg link here). We can tweet it further.
Also, I see you joined our slack. Welcome to the community! :)
findepi
on 5 Jul 2019
It's my pleasure to join the presto community ! :)
Yes, if the result is good I will spend some time to write a blog, hahaha.
Crossoverrr
on 5 Jul 2019
If you don’t have your own blog or would like to contribute the Presto community blog, its easy, just write some markdown for the post and send a pull request.
https://prestosql.io/blog/
https://github.com/prestosql/prestosql.io
 electrum
on 5 Jul 2019
electrum
on 5 Jul 2019
OK. I got it. I will try that as soon as I finished my test on prestosql-315. :)
Crossoverrr
on 5 Jul 2019
We didn't found this problem in prestosql-315, and the performance is as good as prestosql-312, thank you all. You are GREAT! lol
Crossoverrr
on 16 Jul 2019
Related issues
 tooptoop4
·
4Comments
tooptoop4
·
4Comments
 lxynov
·
4Comments
lxynov
·
4Comments
 jiangzhx
·
5Comments
findepi
·
4Comments
jiangzhx
·
5Comments
findepi
·
4Comments
 kokes
·
3Comments
kokes
·
3Comments
Most helpful comment
Thanks again!
According to our pressure test results, most of the query scenarios showed a 10% to 20% improvement in performance, which made us very excited!