Pptxgenjs: How to hide data label having value 0
Hii Brent,
Thanks for this awesome library.
I can generate presentations with graph. Below is an attached screenshot.
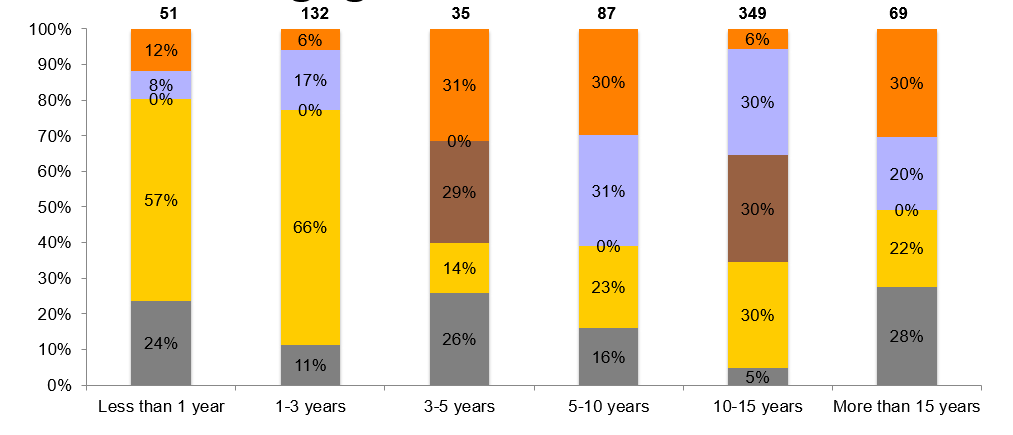
I want to hide the data values in the graph, those are displayed as 0%. Is it possible???
I use the following object as my chart options.
{
x: 0.25, y: 1, w: 9.5, h: 4.0, barDir: 'col', barGrouping: 'percentStacked', chartColors: ['808080', 'FFCC00', '986142', 'B3B3FF', 'FF8000'], barGapWidthPct: 150, showPercent: true, showValue: true, valGridLine: 'none', valAxisLabelFormatCode: '0%', dataLabelFormatCode: '0%'
}
 belall-shaikh
All 13 comments
Hi @skbelalmd,
Thanks for the suggestion, I'll log it as an enhancement request.
 gitbrent
on 8 Feb 2018
gitbrent
on 8 Feb 2018
@gitbrent no enhancement necessary. This is already supported using appropriate number format codes as per https://support.office.com/en-us/article/Number-format-codes-5026bbd6-04bc-48cd-bf33-80f18b4eae68
@skbelalmd you can achieve this by modifying your dataLabelFormatCode option to say don't show anything for zero numbers.
Change from:
dataLabelFormatCode: '0%'
to:
dataLabelFormatCode: '0%\;\;\;'
I'm assuming your you're chart only has positive numbers, otherwise you could use the following to have negative numbers not hidden:
dataLabelFormatCode: '0%\;0%\;\;'
 ReimaFrgos
on 13 Jun 2018
ReimaFrgos
on 13 Jun 2018
Thanks @ReimaFrgos !
gitbrent
on 14 Jun 2018
Added section to Chart API regarding hiding of zero values.
API Chart: Note
gitbrent
on 14 Jun 2018
Thanks @ReimaFrgos
belall-shaikh
on 3 Aug 2018
Thanks @ReimaFrgos
 jefersonla
on 14 Sep 2018
jefersonla
on 14 Sep 2018
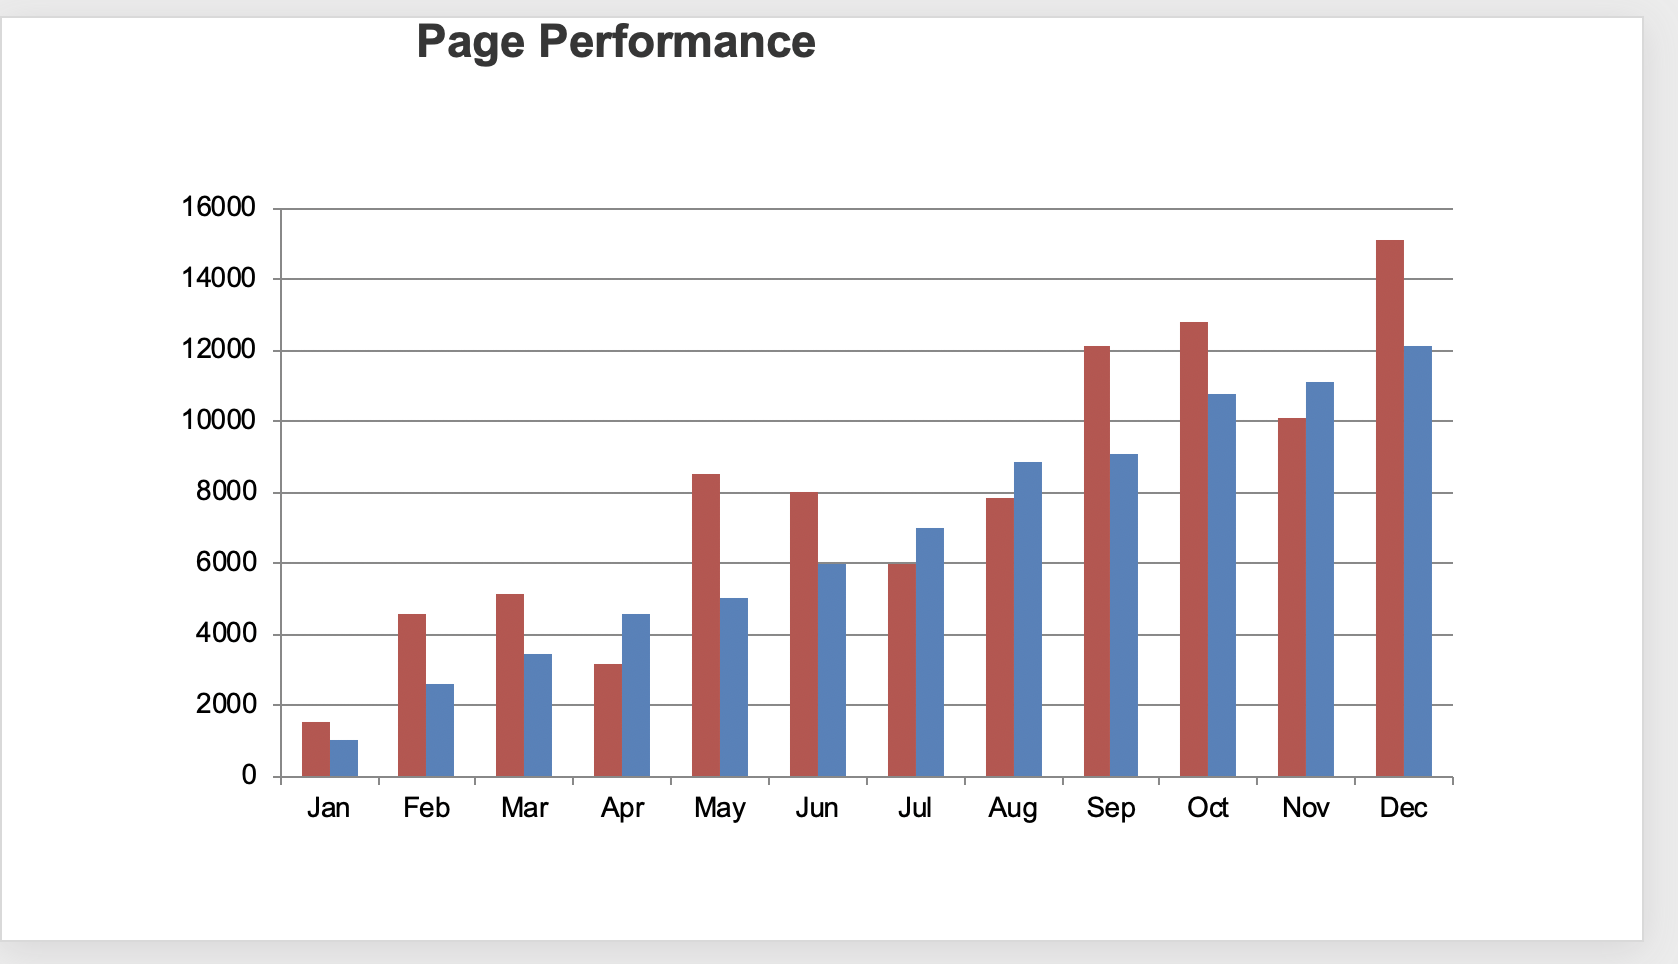
@gitbrent text:"pptgen",options:{align:'center',fontSize:20,color:"326fa8",bullet:{type:'number'}} using this am not able to align text in centre of slide, i tried x, y coordinates as well http://gitbrent.github.io/PptxGenJS/docs/api-text.html can you please suggest. i need text to be aligned in centre of slide.
 shalini1228
on 5 Feb 2020
shalini1228
on 5 Feb 2020
@skbelalmd - have you looked at the browser demo under /demos?
There is a ton of code in /demos/common/demos.js
gitbrent
on 6 Feb 2020
@gitbrent yea i have tried couple methods mentioned in that file but somehow i couldn’t get header in center of slide even though by using x,y,w,h coordinates, can you please help on this.
shalini1228
on 6 Feb 2020
@shalini1228
you need to mention width as 100%
Check this link: https://jsfiddle.net/skbelal/q3k6wazf/14/
belall-shaikh
on 6 Feb 2020
@skbelalmd thanks for above link, even by using w: '100%' , i still don t see header in middle of slide, is there anything else i can use?
shalini1228
on 6 Feb 2020
slide3.addText([
{
text:"Page Performance", options:{ align:'center',w: '100%',margin:100, color: "363636",fontFace:'Arial',fontSize:20,bold:true}
}
]); @skbelalmd
shalini1228
on 6 Feb 2020
Hi,
As per the documentation, margin value should be between 0 to 99.
Can you share a fiddle or demo of the issue you are facing.
belall-shaikh
on 7 Feb 2020
Related issues
 pimlottc-gov
·
3Comments
pimlottc-gov
·
3Comments
 kevinresol
·
3Comments
kevinresol
·
3Comments
 jobnte
·
5Comments
jobnte
·
5Comments
 bestis
·
6Comments
bestis
·
6Comments
 luism-s
·
3Comments
luism-s
·
3Comments
Most helpful comment
@gitbrent no enhancement necessary. This is already supported using appropriate number format codes as per https://support.office.com/en-us/article/Number-format-codes-5026bbd6-04bc-48cd-bf33-80f18b4eae68
@skbelalmd you can achieve this by modifying your dataLabelFormatCode option to say don't show anything for zero numbers.
Change from:
dataLabelFormatCode: '0%'to:
dataLabelFormatCode: '0%\;\;\;'I'm assuming your you're chart only has positive numbers, otherwise you could use the following to have negative numbers not hidden:
dataLabelFormatCode: '0%\;0%\;\;'