Postprocessing: SSAO broken on windows
This is how it looks on my machine:

And this happens on windows:

the first one runs 60fps, the other 2fps, it seems to really struggle for some reason.
do you know what it could be? i have it online here: http://warm-vessel.surge.sh and here's a codesandbox: https://codesandbox.io/s/lllt8?file=/src/App.js
the AO config:
<EffectComposer multisampling={0}>
  <SSAO samples={25} intensity={60} luminanceInfluence={0.5} radius={10} scale={0.5} bias={0.5} />
  <SMAA edgeDetectionMode={EdgeDetectionMode.DEPTH} />
</EffectComposer>
These props will overwrite the following default props:
new SSAOEffect(camera, normalPass.renderTarget.texture, {
  blendFunction: BlendFunction.MULTIPLY,
  samples: 30,
  rings: 4,
  distanceThreshold: 1.0,
  distanceFalloff: 0.0,
  rangeThreshold: 0.5,
  rangeFalloff: 0.1,
  luminanceInfluence: 0.9,
  radius: 20,
  scale: 0.5,
  bias: 0.5,
  ...props,
}),
the high intensity is intentional, im going for a pixelated raytraced look emulating soft shadows with AO.
 drcmda
All 36 comments
do you know what it could be?
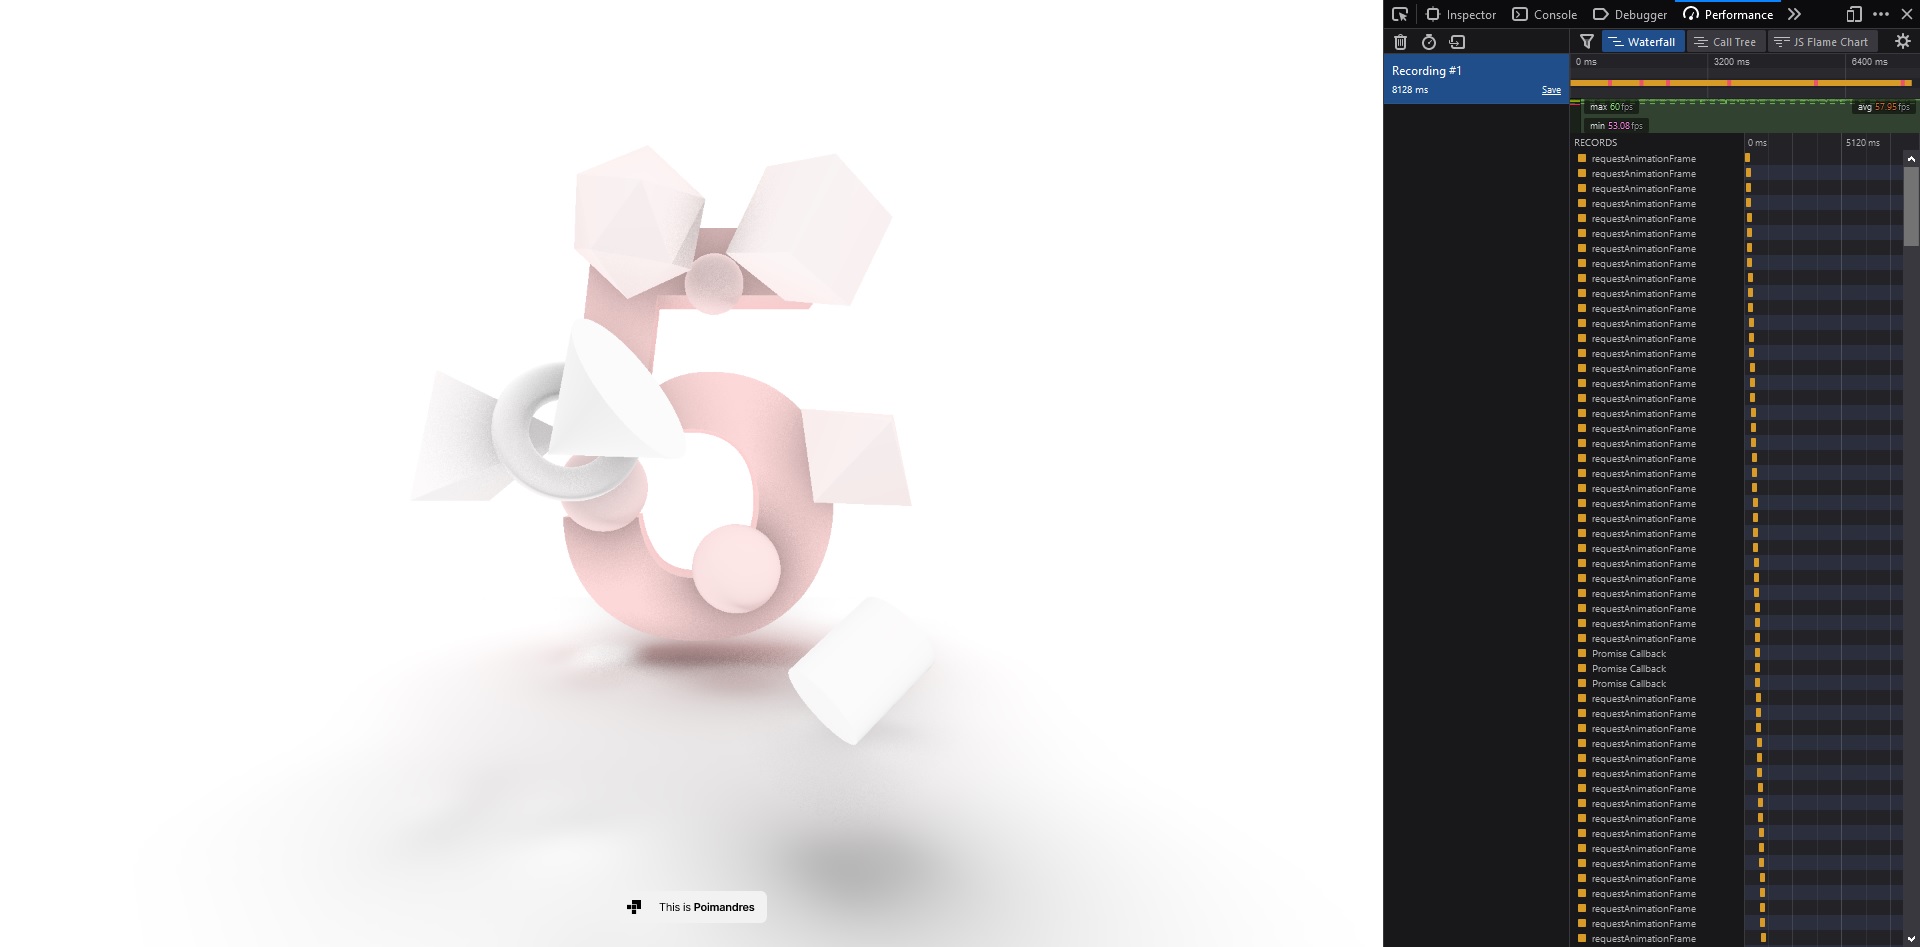
No idea, sorry. I get 60 FPS on my Windows 10 machine with both Firefox (81.0) and Chrome (85.0.4183.121):
 vanruesc
on 23 Sep 2020
vanruesc
on 23 Sep 2020
strange, i use mac so i can't test but 2 of 2 people using windows i sent it to had that issue. i think ive seen the inverted AO before, could it be caused by wrong config somehow?
or can they send me some data that could track down the issue?
drcmda
on 23 Sep 2020
or can they send me some data that could track down the issue?
Check if there are any console messages. Also make sure that they don't have hardware-acceleration disabled. Get their WebGL report for both WebGL 1 and WebGL 2. Check if "Major Performance Caveat" says "yes".
Massive performance drops are usually caused by too many polygons, too many draw calls, too much overdraw, repeated shader recompilations or frequent frame buffer changes, but none of these issues seem to be present in your app.
could it be caused by wrong config somehow
The only parameters that directly affect performance are samples and width,height or resolutionScale. I noticed that you're setting scale to 0.5, but the SSAOEffect doesn't have a scale parameter. You probably meant to use resolutionScale.
vanruesc
on 24 Sep 2020
he sent me this @vanruesc
Hey, I think I found the problem
My laptop has two graphics mode
- Hybrid (switching between Intel graphics and Nvidia depending on load)
- Discrete GPU (using RTX2070 for everything)
So in this case I think because it was on hybrid mode and I was just using "browser" it must have thought I don't need GPU for it
Also maybe that AO thing isn't supported with Intel graphics?
Because I switched to discreet GPU mode, getting full fps and background isn't greyI'm not 100% sure, but seems likely to be the case
so, it seems to be related to hardware acc, if isn't on ao won't function correctly?
drcmda
on 24 Sep 2020
if isn't on pp won't function correctly?
Post processing filters are executed in addition to the normal rendering pipeline and inherently require lots of graphics processing power. Integrated graphics usually don't have the pixel throughput to process fullscreen effects efficiently.
The WebGL setting powerPreference: 'high-performance' is supposed to tell the browser to use the discrete GPU, but apparently Windows doesn't want to comply.
vanruesc
on 24 Sep 2020
is there something that would allow me to detect this so that i can serve them a scene without effects?
drcmda
on 24 Sep 2020
I don't know of a standard way to detect this. This might be relevant: https://stackoverflow.com/questions/37323690/how-to-detect-dedicated-or-integrated-graphics-card-used-for-webgl
vanruesc
on 24 Sep 2020
You could also try to adjust SSAO parameters based on measured FPS. If you lower the sample count and/or resolution, the integrated graphics might be able to render the effect at a reasonable framerate.
vanruesc
on 24 Sep 2020
I think I found the reason why the powerPreference setting is ignored in your app: https://www.khronos.org/webgl/public-mailing-list/public_webgl/1703/msg00022.php explains that the canvas needs to have event listeners for webglcontextlost and webglcontextrestored set prior to the WebGL context creation or else the powerPreference setting will be ignored. Your app appears to create a Canvas without setting these listeners.
ThreeJS sets the listeners correctly if you don't provide your own canvas. See https://github.com/mrdoob/three.js/blob/33acbbef6b7cd6afa98e1cf6f02d3f23aaf5bfa0/src/renderers/WebGLRenderer.js#L200-L203 and https://github.com/mrdoob/three.js/pull/12753 for details.
vanruesc
on 24 Sep 2020
yes, turns out i do call getcontext before these two events, never knew that was wrong
const temp = new WebGLRenderer({
  powerPreference: 'high-performance',
  canvas: canvasRef.current,
  context: props.gl2 ? (canvasRef.current.getContext('webgl2', params) as WebGLRenderingContext) : undefined,
  ...params,
})
i think i have a repro: https://codesandbox.io/s/react-three-fiber-v5-forked-lns84?file=/src/App.js it shows that gray bg even on my mac.
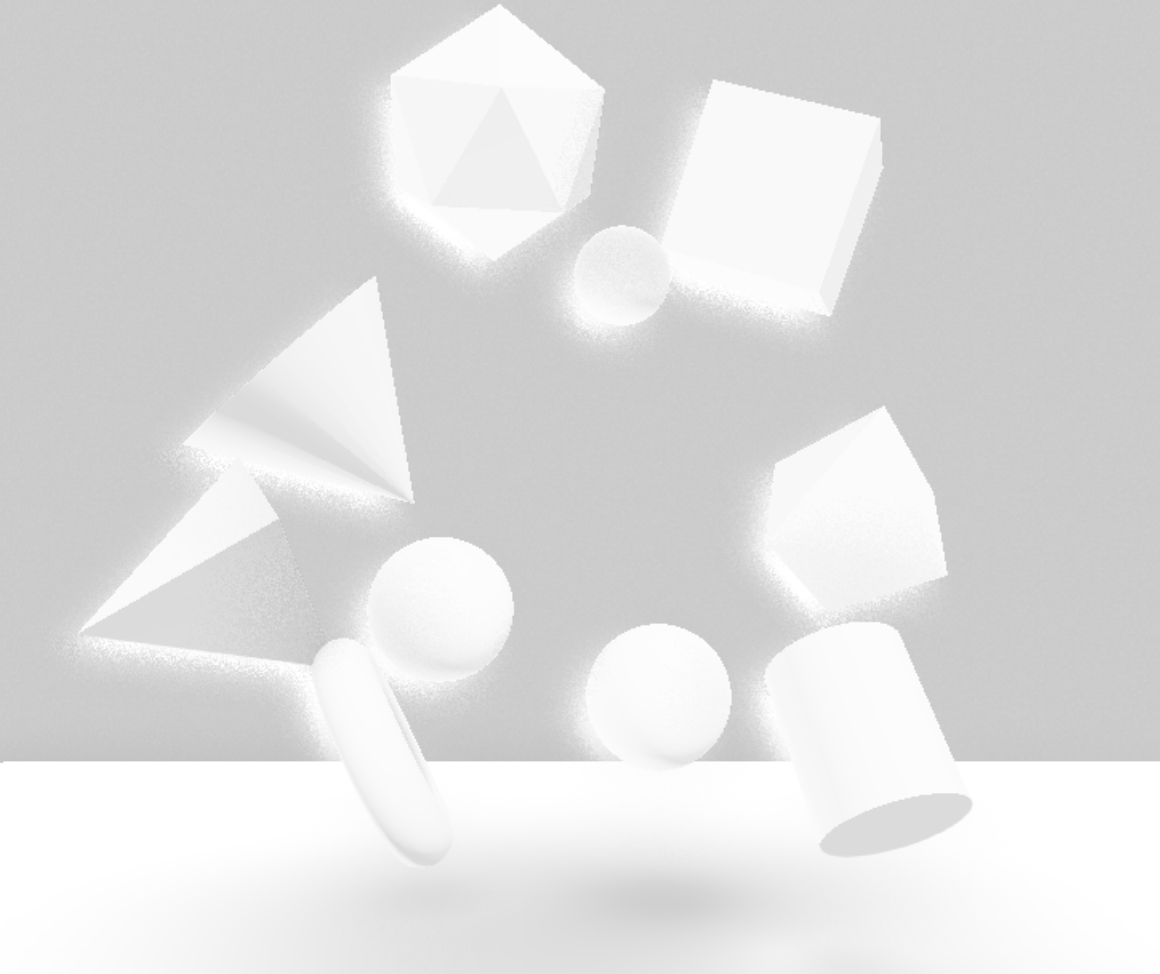
this is using powerPref high and doesnt access the canvas context before having these listeners. i included the full react-postprocessing set up in the SSAO component that that it's more clear which parameters it sets.
drcmda
on 27 Sep 2020
That setup works fine on my system (Win10, NVIDIA GTX 1060, driver version 456.38):

The screenshot you posted looks like there's something wrong with either the depth texture or the normal texture. Can you check what those textures look like on your system? I think you can use <Depth> to render depth, but I don't know how to render normals with react-postprocessing.
I've also tweaked the SSAO parameters a little bit in this fork, but I couldn't reproduce the bug.
vanruesc
on 27 Sep 2020
@drcmda any update on this? It would help to see what the scene depth & normals look like on your system.
vanruesc
on 9 Oct 2020
I had the same issue in a project even though the SSAO demo worked fine for me. I found out that you can replicate that issue when you pass a value like null as the normal texture to the SSAO effect instead of the actual normal pass rendertarget texture and don't use a normalDepthBuffer in the SSAO effect. In my case I used a normal pass and passed its rendertarget texture but had it still give me that wrong gray AO. It turns out I forgot to add the normal pass to the composer. Since the normal pass wasn't updated then a plain white texture was used in the SSAO shader which is probably the reason why the shader then gave these distorted results (due to an incorrect normal texture). So make sure the normal pass updates and that the normal pass's rendertarget texture is correct (e.g. not plain white).
 0beqz
on 10 Oct 2020
0beqz
on 10 Oct 2020
the weird thing is, that demo now runs fine again. it seems to be related by my computer switching gfx cards. similar to the reports i got. sometimes my system gets really slow and it switches from dedicated to integrated. i dont think it does anything out of the ordinary with normal textures.
it creates the composer, adds a render pass and then a normal pass
        // Initialize composer
        const effectComposer = new EffectComposer(gl, {
          depthBuffer,
          stencilBuffer,
          multisampling: isWebGL2Available() ? multisampling : 0,
          frameBufferType,
        })
        // Add render pass
        effectComposer.addPass(new RenderPass(scene, camera))
        // Create normal pass
        const pass = new NormalPass(scene, camera)
        effectComposer.addPass(pass)
which it keeps and forwards it to effects that may need it
new SSAOEffect(camera, normalPass.renderTarget.texture, {
        blendFunction: BlendFunction.MULTIPLY,
        samples: 30,
i am looking for something now that would allow me to switch between gfx cards manually to see if it's really that.
drcmda
on 10 Oct 2020
@0beqz exactly, that's also why I wanted to see depth & normals on the failing system.
@drcmda alright, let me know if you find out more.
vanruesc
on 10 Oct 2020
@vanruesc so, today it decided to look weird again for some reason and i took the opportunity to export depth and normals. i also changed the demo back to pure postprocessing: https://codesandbox.io/s/react-three-fiber-v5-forked-lns84?file=/src/Post.js
the is how it renders:

normals:

depth:

GPU info:
tier: "2"
type: "BENCHMARK - intel hd graphics p630"
drcmda
on 21 Oct 2020
the crazy thing is, if i click fullscreen in codesandbox it looks ok. it then uses the dedicated gpu:
tier: "2"
type: "BENCHMARK - amd radeon pro 555"
drcmda
on 21 Oct 2020
Your normals and depth values look fine so these shouldn't be causing problems. The normals only appear to overlap incorrectly because they are being rendered to the screen which doesn't have a depth buffer in this setup. I was hoping for at least one of these textures to give us some hints as to why the effect is failing.
Just to confirm: are there any messages in the console when the effect is failing?
I've looked through the SSAO shaders again, but couldn't find anything sticking out as potentially dangerous. This seems to be either a hardware/driver bug or a browser issue. What browser are you using and what's your Intel Graphics driver version?
Unlikely to be the cause, but possibly related: https://www.khronos.org/webgl/wiki/BlacklistsAndWhitelists & https://bugzilla.mozilla.org/show_bug.cgi?id=628129
vanruesc
on 21 Oct 2020
the console is empty, nothing unusual, no errors or warnings. i am on the latest stable chrome Version 87.0.4280.20 (Official Build) beta (x86_64),
Intel UHD Graphics 630:

  Chipset Model:    Intel UHD Graphics 630
  Type: GPU
  Bus:  Built-In
  VRAM (Dynamic, Max):  1536 MB
  Vendor:   Intel
  Device ID:    0x3e9b
  Revision ID:  0x0000
  Automatic Graphics Switching: Supported
  gMux Version: 5.0.0
  Metal:    Supported, feature set macOS GPUFamily2 v1
  Displays:
Colour LCD:
  Display Type: Built-In Retina LCD
  Resolution:   2880x1800 Retina
  Framebuffer Depth:    24-Bit Colour (ARGB8888)
  Main Display: Yes
  Mirror:   Off
  Online:   Yes
  Automatically Adjust Brightness:  No
  Connection Type:  Internal
but it seems to be a more generic issue since i was first made aware of it by windows users. they confirmed as well that their integrated gpu's couldn't handle the ao.
drcmda
on 21 Oct 2020
maybe look at chrome://gpu/ for GPU0 info what GPU is used, with the power preference high-performance in webgl the decided GPU should be used, maybe this is a chrome bug only set this in the fullscreen mode?
 arpu
on 21 Oct 2020
arpu
on 21 Oct 2020
Please also check the GPU memory usage via Chrome's task manager.
vanruesc
on 21 Oct 2020
gpu memory
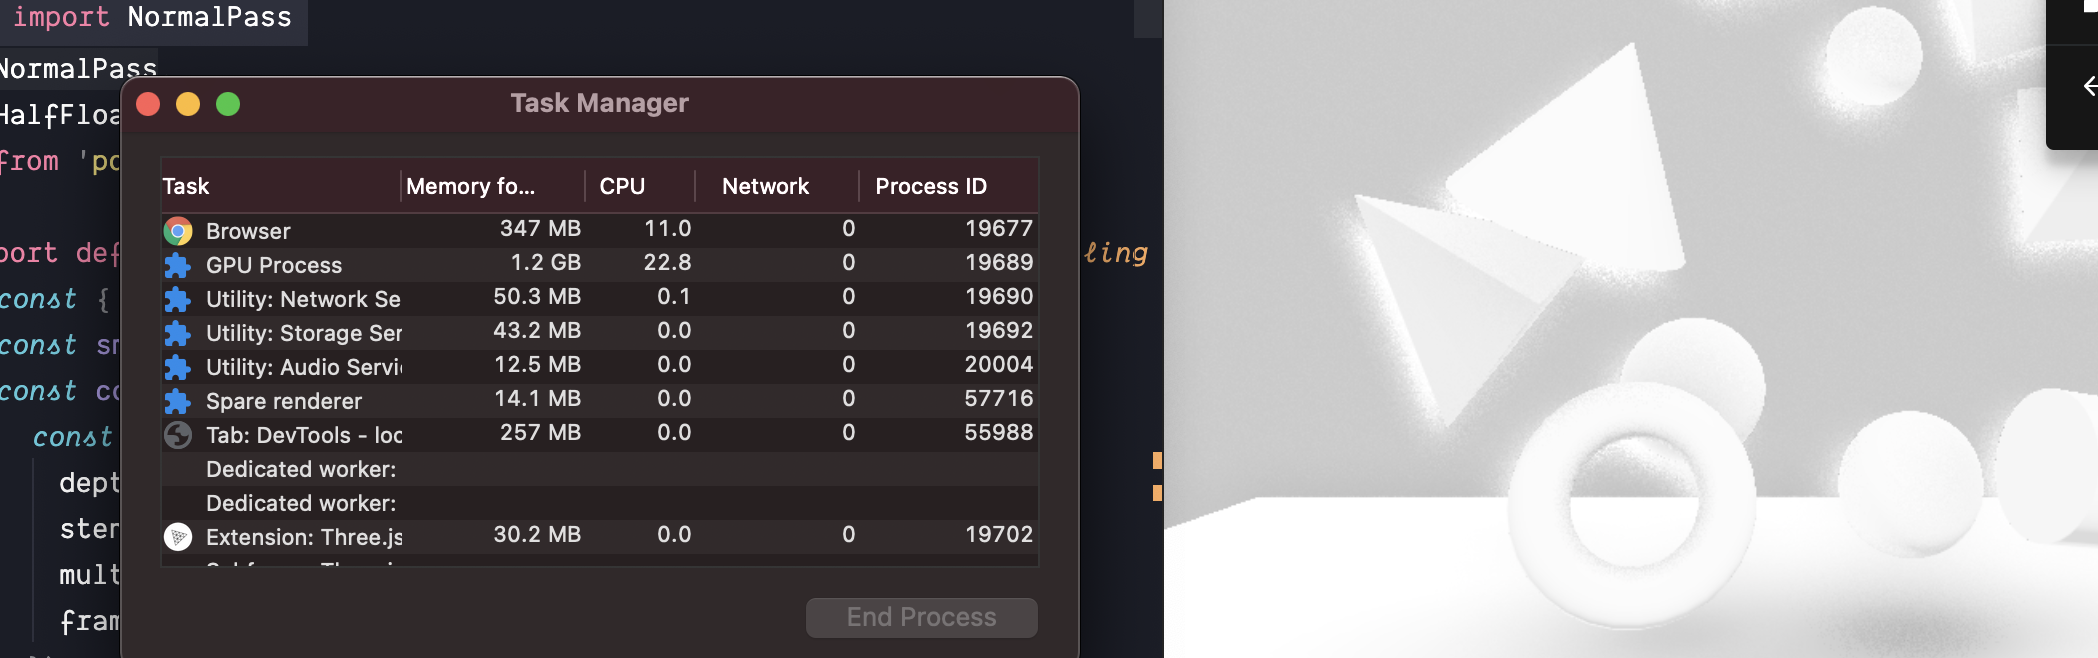
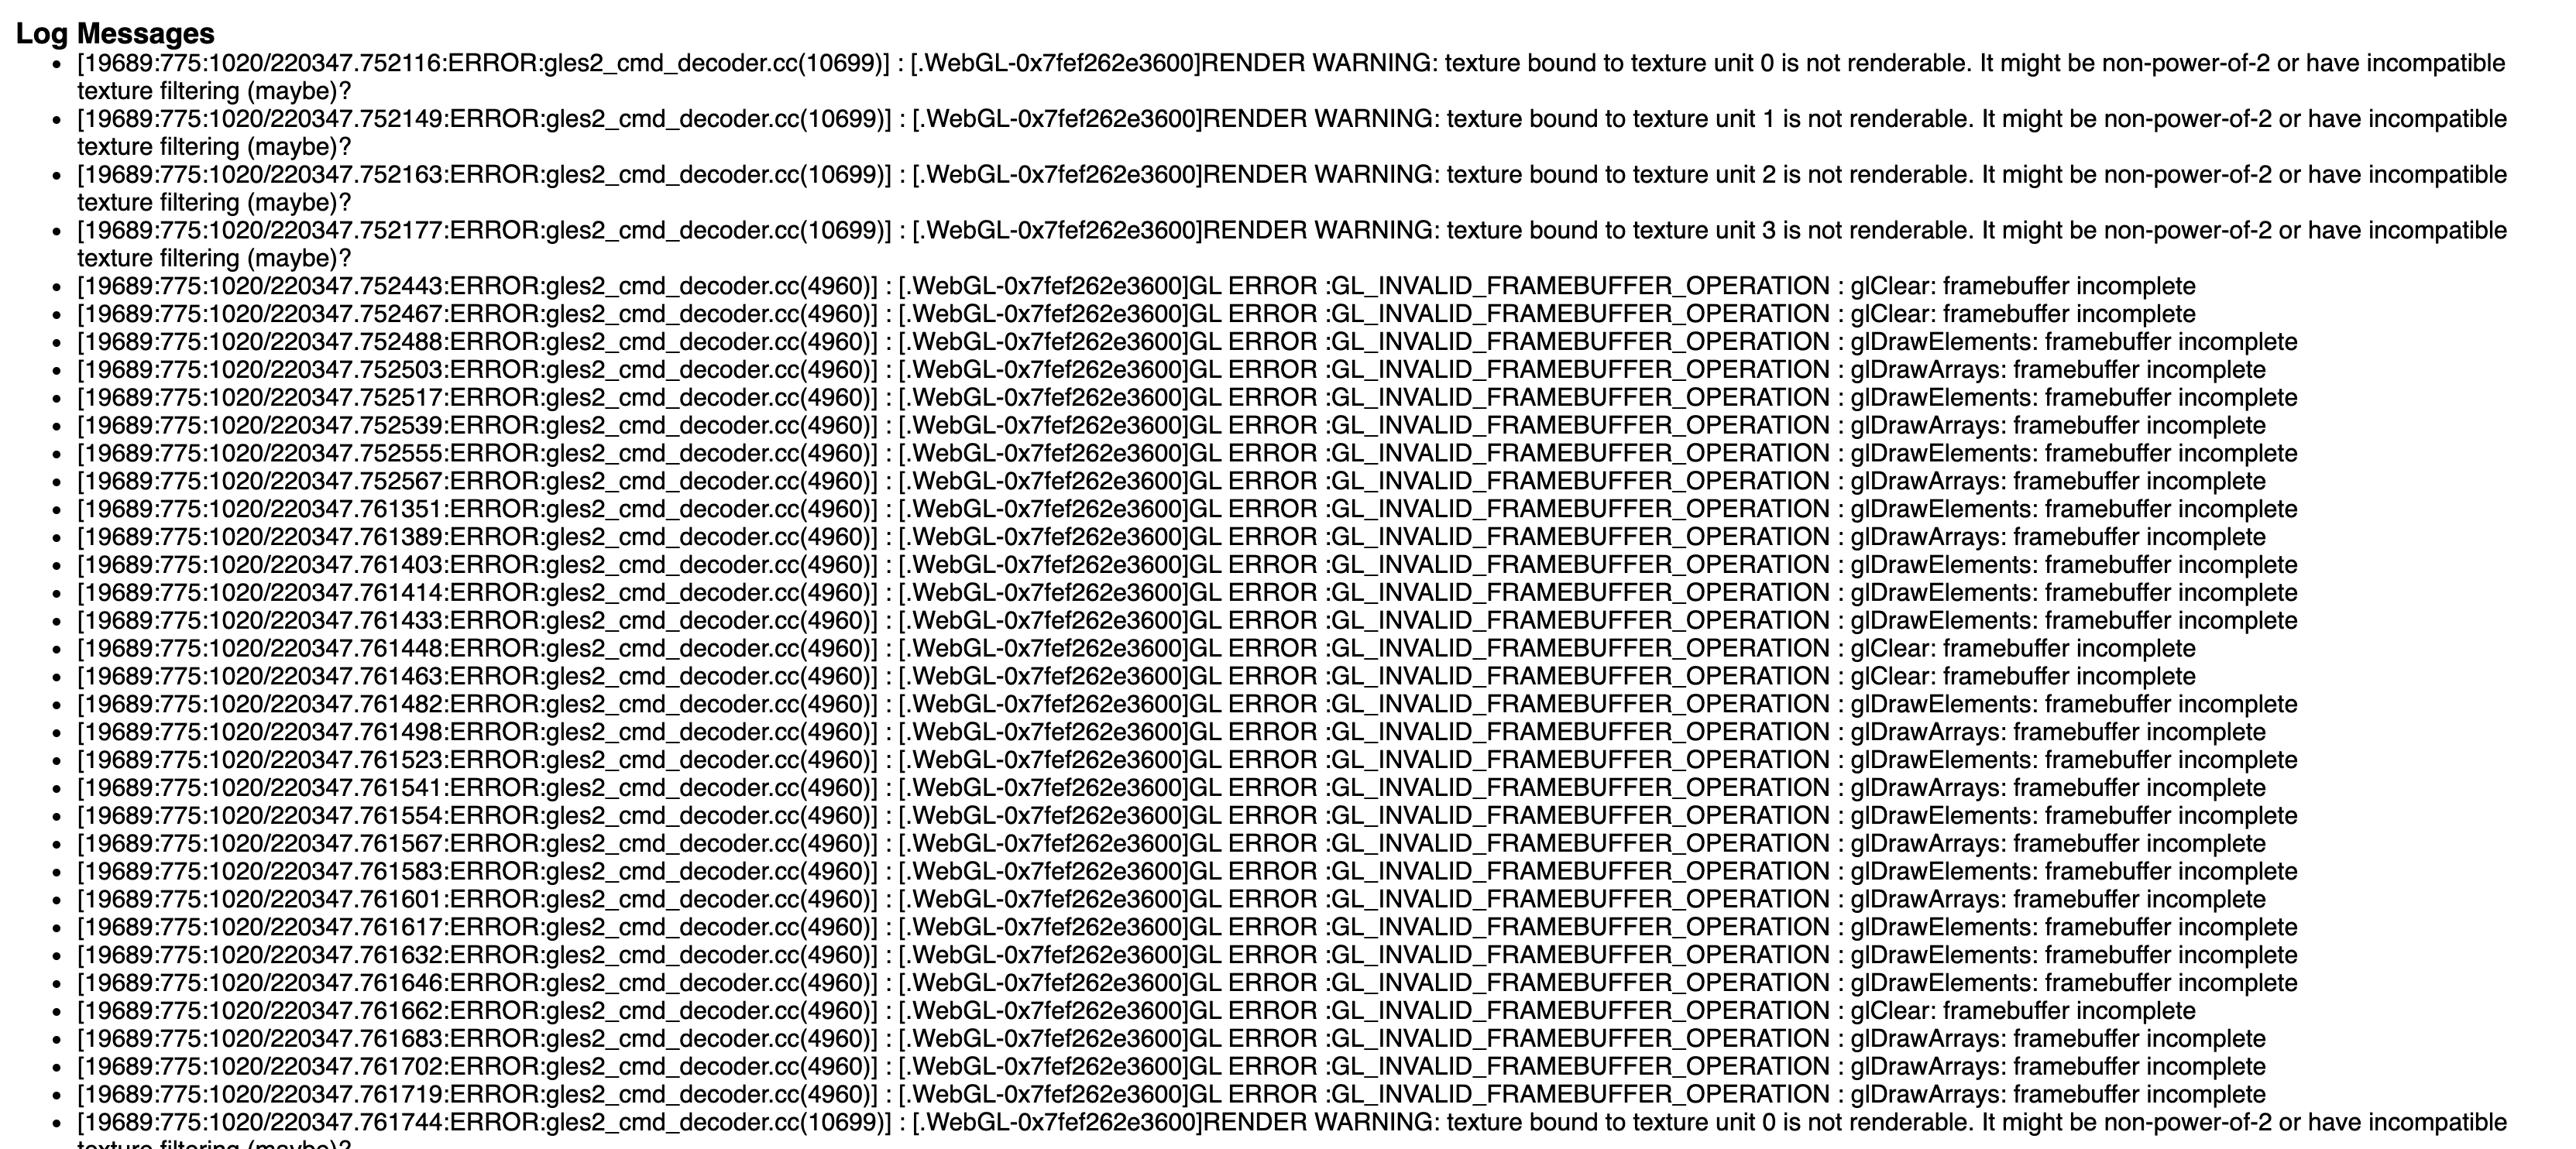
webgl log messages
gpu status
GPU0 | VENDOR= 0x1002, DEVICE=0x67ef
-- | --
GPU1 | VENDOR= 0x8086, DEVICE=0x3e9b ACTIVE
i don't normally have any gpu troubles. it usually takes the dedicated gpu. but even if it uses the integrated one, it shouldn't cause problem imo. there's just something going on that seems to flip textures for some reason.
drcmda
on 21 Oct 2020
Does the problem disappear when you disable MSAA by setting multisampling to 0?
vanruesc
on 21 Oct 2020
looks like chrome still use the Intel VENDOR= 0x8086, DEVICE=0x3e9b ACTIVE
arpu
on 21 Oct 2020
see the ACTIVE flag at the end
arpu
on 21 Oct 2020
@arpu true, but even then the effect shouldn't fail like this since the driver is up-to-date and the hardware supports WebGL.
The error messages indicate that four different textures are not renderable for some reason. These textures are non-power-of-2 but they don't use mipmapping so this shouldn't be a problem. I wonder why it's possible to render normals and depth, but not SSAO. My current guess is that the GPU is running out of memory due to MSAA and the frame buffers can't be created.
vanruesc
on 21 Oct 2020
multisampling has no effect unfortunately, should have been 0 anyway since it's using MSAA.
i noticed something really strange, it seems to be related to the background color. the scene is configured like so:
      <Canvas
        gl={{ antialias: false, stencil: false, depth: false, alpha: false }}
        camera={{ position: [0, 0, 15], near: 5, far: 40 }}>
        <color attach="background" args={['white']} />
        <fog attach="fog" args={['white', 10, 40]} />
gl.alpha is set to false, and scene.background is set to white.
if i do this (setClearColor instead of scene.background):
      <Canvas
        concurrent
        gl={{ antialias: false, stencil: false, depth: false, alpha: false }}
        pixelRatio={1.25}
        camera={{ position: [0, 0, 15], near: 5, far: 40 }}
        onCreated={state => state.gl.setClearColor("white")}>
        <fog attach="fog" args={['white', 10, 40]} />
then it works!
i never really understood the difference between clearcolor and scene.background, but can that, someone, affect how pp works?
drcmda
on 21 Oct 2020
i was excited too early. this happens when it switches to intel:

the plane draws AO artifacts. doesn't happen with radeon. seems like another problem but related.
drcmda
on 21 Oct 2020
difference between clearcolor and scene.background
It would seem that scene.background and gl.setClearColor() do the same thing, but setClearColor supports strings as input. I don't think you can set scene.background to a string. Only Texture, Color, CubeTexture and WebGLCubeRenderTarget are supported.
Postprocessing disables auto clear and the ClearPass simply uses the clear color and clear alpha of the renderer. Other passes such as the NormalPass use override clear colors to clear the normal texture to specific default values like 0x7777ff. I don't know how this would cause render targets to blow up, though.
vanruesc
on 21 Oct 2020
the plane draws AO artifacts
Could you please show me the normals and depth again? Maybe they look different now.
vanruesc
on 21 Oct 2020
I didn't notice this before, but the first normal texture screenshot you posted has a white background color which is wrong. The SSAO demo also sets a background color, but this doesn't seem to cause any issues there. Anyway, the NormalPass as well as other passes that use override clear colors should probably disable scene.background temporarily to produce correct results.
vanruesc
on 21 Oct 2020


depth looks quite ok, normals look off for the plane.
I don't think you can set scene.background to a string.
<color attach="background" args={["white"]} />
is the same as:
parent.background = new THREE.Color("white")
the parent is the default scene.
drcmda
on 21 Oct 2020
Thanks for the screenshots and info.
normals look off for the plane
That's because the screen has no depth buffer (gl={{ ..., depth: false, ... }). The actual normal render target has a depth buffer so this is nothing to worry about.
Are the error messages about incomplete frame buffers still appearing after switching to state.gl.setClearColor('white')?
vanruesc
on 21 Oct 2020
To provide another data point: the example works on my phone (Android 9, ARM Mali G72 MP3):

vanruesc
on 4 Nov 2020
Unfortunately, it seems that we can't fix this in the library. Tagging as driver issue and closing due to inactivity.
If you find out anything that could resolve this, feel free to reopen.
vanruesc
on 3 Jan 2021
Related issues
 dghez
·
4Comments
arpu
·
3Comments
dghez
·
4Comments
arpu
·
3Comments
 KholofeloMoyaba
·
3Comments
KholofeloMoyaba
·
3Comments
 lhamadopagode
·
4Comments
dghez
·
4Comments
lhamadopagode
·
4Comments
dghez
·
4Comments
Most helpful comment
I think I found the reason why the
powerPreferencesetting is ignored in your app: https://www.khronos.org/webgl/public-mailing-list/public_webgl/1703/msg00022.php explains that the canvas needs to have event listeners forwebglcontextlostandwebglcontextrestoredset prior to the WebGL context creation or else thepowerPreferencesetting will be ignored. Your app appears to create aCanvaswithout setting these listeners.ThreeJS sets the listeners correctly if you don't provide your own canvas. See https://github.com/mrdoob/three.js/blob/33acbbef6b7cd6afa98e1cf6f02d3f23aaf5bfa0/src/renderers/WebGLRenderer.js#L200-L203 and https://github.com/mrdoob/three.js/pull/12753 for details.