Poliastro: successive periods of orbit track should not fall on top of one another
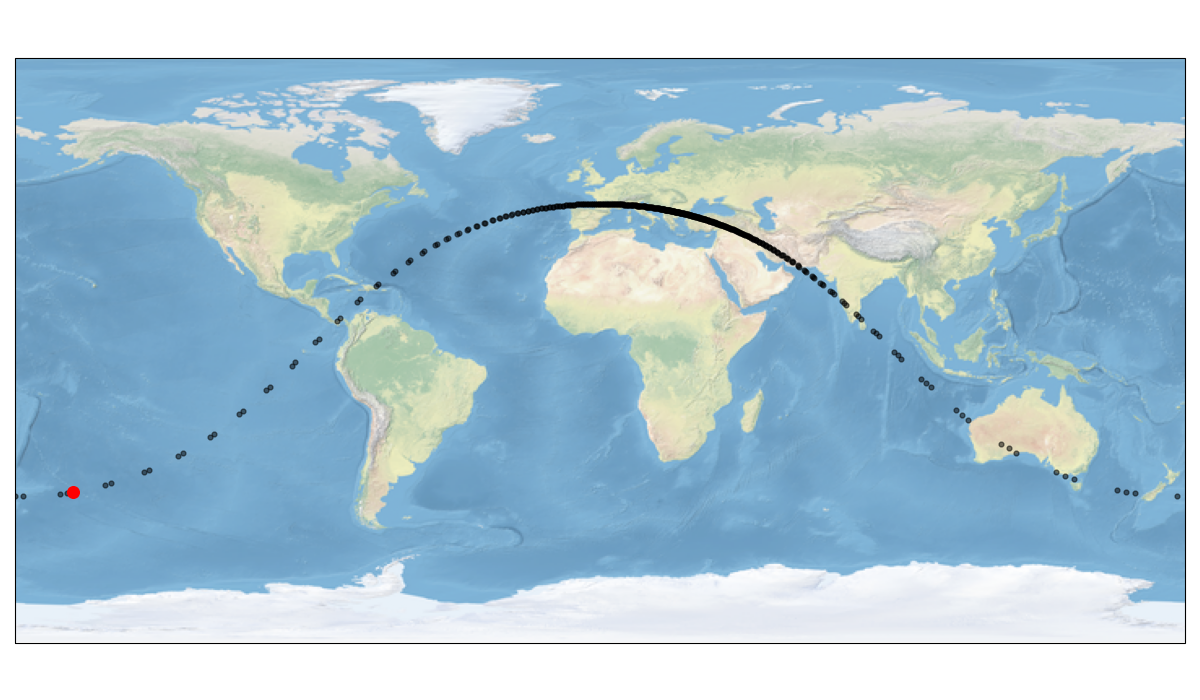
I'm generating an orbit and plotting the ground track on a map. Because the orbit period is an unusual number, I would expect successive periods of the orbit track to fall at different positions on the map. But, this isn't the behavior that I'm seeing. Is this a problem with poliastro or (more likely) am I doing something wrong?
# Section 1: Preliminaries.

# Section 1.1: Import from Python standard library.

import os, pickle, sys
from datetime import datetime
from numpy import arange, pi


# Section 1.2: Import from packages in the Anaconda distribution.

import matplotlib.pyplot as plt

from pytz import timezone, utc

import cartopy.crs as ccrs

from astropy import coordinates, time, units as u
from poliastro.bodies import Earth, Moon, Sun
from poliastro.twobody import Orbit, propagation


# Section 1.3: Global variables and constants.

RAD2DEG= 180 / pi

tz= utc


# Section 2:

epoch= [2020, 12, 7, 20, 38]

# Naive datetime is datetime with no timezone information.  Here we 'localize' the naive
# datetime, i.e., convert it to a timezone-specific time:
datetime_local= tz.localize(datetime(*epoch))

# Convert localized datetime to UTC:
datetime_UTC= datetime_local.astimezone(utc)

# Convert to Astropy time on UTC scale:
t= time.Time(datetime_UTC, scale='utc')


# Section 3: Simulate orbit.

a  = 23000       * u.km  # semi-major axis # 26600
ecc= 0.74        * u.one # eccentricity
inc= 63.4        * u.deg # inclination of the orbit plane

raan= 49.562     * u.deg # right ascension of the ascending node
argp= 270        * u.deg # argument of perigee
nu  = 0          * u.deg # true anomaly at epoch

T_sim_hrs= 24
T_step_min= 3

orbit= Orbit.from_classical(Earth, a, ecc, inc, raan, argp, nu, epoch=t)

print(f"Orbit period: {orbit.period.to(u.min):.3f}")

# Create time steps covering the duration of the simulation:
times= arange(0, 60*T_sim_hrs+1, T_step_min) * u.min

xyz= propagation.propagate(
  orbit,
  time.TimeDelta(times),
  method=propagation.cowell,
  rtol=1e-10,
)

# Convert positions from Cartesian to spherical coordinates:
d_lat_lon= coordinates.cartesian_to_spherical(xyz.z, xyz.y, xyz.z)


# Section 4: Generate plot.

fig= plt.figure(figsize=(12, 7))
ax= fig.add_subplot(1, 1, 1, projection=ccrs.PlateCarree())

ax.stock_img()

                      # longitude             # latitude
plt.scatter(x=RAD2DEG*d_lat_lon[2], y=RAD2DEG*d_lat_lon[1],
  color="black", s=12, alpha=0.5, transform=ccrs.PlateCarree())

# Mark the first point, corresponding to epoch, with a special symbol:
plt.scatter(x=RAD2DEG*d_lat_lon[2][:1], y=RAD2DEG*d_lat_lon[1][:1],
  color="red", s=70, marker='o', alpha=1.0, transform=ccrs.PlateCarree())

plt.tight_layout()
plt.show()
 Phillip-M-Feldman
All 4 comments
Hi @Phillip-M-Feldman, thanks for using poliastro. Let me explain what you obtained those results...
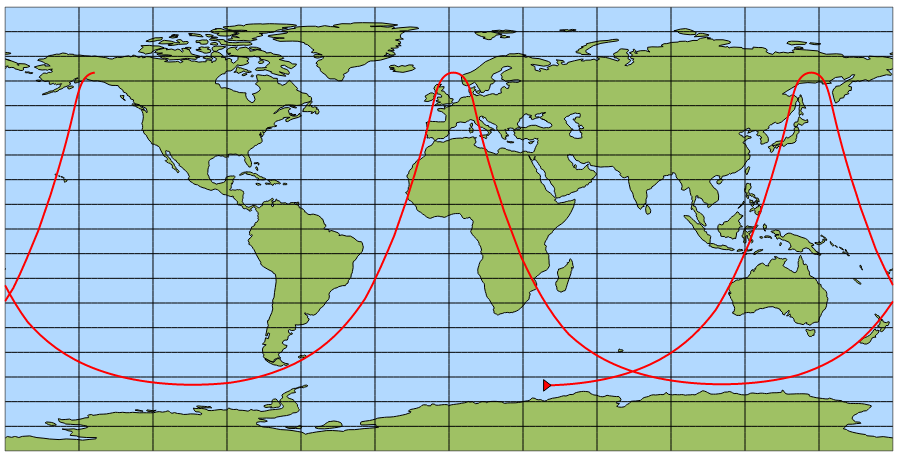
The orbit you created around Earth is making use of GCRF frame, who's origin is at Earth's center. This frame is an inertial one, meaning that it does not rotate with the Earth. Therefore, no shift in orbit's groundtrack is seen, which is what you obtained in your figure.
If you want to consider Earth rotation, you must use the ITRF frame, which again is an Earth centered frame but it rotates with the planet, being non-inertial thus. To do this, you can apply the same as poliastro's groundtrack plotting tool:
from poliastro.frames.fixed import ITRS
from poliastro.frames.equatorial import GCRS
from astropy.coordinates import CartesianRepresentation

epoch_times = t + times

gcrs_xyz = GCRS(
    xyz, obstime=epoch_times, representation_type=CartesianRepresentation
)
itrs_xyz = gcrs_xyz.transform_to(ITRS(obstime=epoch_times))
You can proceed with those coordinates the same way you did, getting their spherical representation and associated lat/lon values.
As cited before, you can make use of the Groundtrack utility available in poliastro too. This tutorial explains how to use it. At the moment it is only available within developers version, but in a couple of days will be available in the stable 0.15 one! Using this utility, the orbit you considered shows the following groundtrack for a 24h timelapse:
Click to see source code for previous figure...
from astropy import units as u

from poliastro.earth import EarthSatellite
from poliastro.earth.plotting import GroundtrackPlotter
from poliastro.bodies import Earth
from poliastro.twobody import Orbit
from poliastro.util import time_range

# Build spacecraft instance
a, ecc, inc, raan, argp, nu = (
    23000 * u.km,
    0.74 * u.one,
    63.4 * u.deg,
    49.562 * u.deg,
    270 * u.deg,
    0 * u.deg,
)
ss = Orbit.from_classical(Earth, a, ecc, inc, raan, argp, nu)
ss_earth = EarthSatellite(ss, None)
t_span = time_range(ss.epoch, periods=150, end=ss.epoch + 24 * u.h)

# Generate an instance of the plotter, add title and show latlon grid
gp = GroundtrackPlotter()
gp.update_layout(title="Orbit groundtrack")

# Plot previously defined EarthSatellite object
fig = gp.plot(
    ss_earth,
    t_span,
    label="ss-orbit",
    color="red",
    marker={
        "size": 10,
        "symbol": "triangle-right",
        "line": {"width": 1, "color": "black"},
    },
)

fig.show()
 jorgepiloto
on 3 May 2021
jorgepiloto
on 3 May 2021
This is tremendous. Thanks so much!
On Mon, May 3, 2021 at 2:41 PM Jorge M.G. @.*> wrote:
Hi @Phillip-M-Feldman https://github.com/Phillip-M-Feldman, thanks for
using poliastro. Let me explain what you obtained those results...The orbit you created around Earth is making use of GCRF frame, who's
origin is at Earth's center. This frame is an inertial one, meaning that it
does not rotate with the Earth. Therefore, no shift in orbit's groundtrack
is seen, which is what you obtained in your figure.If you want to consider Earth rotation, you must use the ITRF frame,
which again is an Earth centered frame but it rotates with the planet,
being non-inertial thus. To do this, you can apply the same as poliastro's
groundtrack plotting tool
https://github.com/poliastro/poliastro/blob/main/src/poliastro/earth/plotting/groundtrack.py
:from poliastro.frames.fixed import ITRSfrom poliastro.frames.equatorial import GCRSfrom astropy.coordinates import CartesianRepresentation
epoch_times = t + times
gcrs_xyz = GCRS(
xyz, obstime=epoch_times, representation_type=CartesianRepresentation
)itrs_xyz = gcrs_xyz.transform_to(ITRS(obstime=epoch_times))You can proceed with those coordinates the same way you did, getting their
spherical representation and associated lat/lon values.As cited before, you can make use of the Groundtrack utility available in
poliastro too. This tutorial
https://docs.poliastro.space/en/latest/examples/Generating%20orbit%20groundtracks.html
explains how to use it. At the moment it is only available within
developers version, but in a couple of days will be available in the stable
0.15 one! Using this utility, the orbit you considered shows the following
groundtrack for a 24h timelapse:[image: gtk]
https://user-images.githubusercontent.com/28702884/116936599-5ce4b200-ac68-11eb-8de4-1317cd69a17d.png
Click to see source code for previous figure...from astropy import units as u
from poliastro.earth import EarthSatellitefrom poliastro.earth.plotting import GroundtrackPlotterfrom poliastro.bodies import Earthfrom poliastro.twobody import Orbitfrom poliastro.util import time_rangeBuild spacecraft instancea, ecc, inc, raan, argp, nu = (
23000 * u.km,
0.74 * u.one,
63.4 * u.deg,
49.562 * u.deg,
270 * u.deg,
0 * u.deg,
)ss = Orbit.from_classical(Earth, a, ecc, inc, raan, argp, nu)ss_earth = EarthSatellite(ss, None)t_span = time_range(ss.epoch, periods=150, end=ss.epoch + 24 * u.h)
Generate an instance of the plotter, add title and show latlon gridgp = GroundtrackPlotter()gp.update_layout(title="Orbit groundtrack")
Plot previously defined EarthSatellite objectfig = gp.plot(
ss_earth,
t_span,
label="ss-orbit",
color="red",
marker={
    "size": 10,
    "symbol": "triangle-right",
    "line": {"width": 1, "color": "black"},
},
)
fig.show()—
You are receiving this because you were mentioned.
Reply to this email directly, view it on GitHub
https://github.com/poliastro/poliastro/issues/1203#issuecomment-831553209,
or unsubscribe
https://github.com/notifications/unsubscribe-auth/AAIEDRAJXIIFO2RFPYHTWDLTL4J7BANCNFSM44BPZRHA
.
Phillip-M-Feldman
on 4 May 2021
Therefore, closing this 🎉
jorgepiloto
on 4 May 2021
Excellent answer @jorgepiloto 👏🏽 I'm so happy it's so easy to do this in poliastro!
 astrojuanlu
on 8 May 2021
astrojuanlu
on 8 May 2021
Related issues
 noc0lour
·
3Comments
astrojuanlu
·
5Comments
noc0lour
·
3Comments
astrojuanlu
·
5Comments
 cpbridges
·
7Comments
astrojuanlu
·
4Comments
cpbridges
·
7Comments
astrojuanlu
·
4Comments
 DhruvSondhi
·
6Comments
DhruvSondhi
·
6Comments
Most helpful comment
Hi @Phillip-M-Feldman, thanks for using poliastro. Let me explain what you obtained those results...
The orbit you created around Earth is making use of
GCRFframe, who's origin is at Earth's center. This frame is an inertial one, meaning that it does not rotate with the Earth. Therefore, no shift in orbit's groundtrack is seen, which is what you obtained in your figure.If you want to consider Earth rotation, you must use the
ITRFframe, which again is an Earth centered frame but it rotates with the planet, being non-inertial thus. To do this, you can apply the same as poliastro's groundtrack plotting tool:You can proceed with those coordinates the same way you did, getting their spherical representation and associated lat/lon values.
As cited before, you can make use of the Groundtrack utility available in poliastro too. This tutorial explains how to use it. At the moment it is only available within developers version, but in a couple of days will be available in the stable 0.15 one! Using this utility, the orbit you considered shows the following groundtrack for a 24h timelapse:
Click to see source code for previous figure...