What's going wrong?
I'm seeing a memory leak.
How could we reproduce this issue?
Create index.js with this content.
process.title = 'graphql-api';
setTimeout(() => {}, 1000000000);
Run node index.js and it'll show 30MB of RAM used in top.
Create a ecosystem.config.js file with this content.
const common = {
        name: 'graphql-api',
        script: './index.js',
        watch: false,
        wait_ready: true,
        listen_timeout: 3000,
        exp_backoff_restart_delay: 100,
        max_memory_restart: '200M'
};

const envs = {
        env_production: {
                NODE_ENV: 'production'
        }
};

module.exports = {
        apps: [{
                ...common,
                ...envs
        }]
};
Run pm2 start ecosystem.config.js and it'll show 35MB+ of RAM used in top. The RAM also keeps going up every few seconds. After about 10 minutes I've seen it hit as high as 100MB
Supporting information
I'm only using 3.2.2 as per https://github.com/Unitech/pm2/issues/4256 and it change anything. I also tried this with 3.5.0 and the latest 4.1.2 with the same results.
root@unmini:/usr/local/node/graphql-api# pm2 report
===============================================================================
--- PM2 REPORT (Fri Nov 15 2019 20:36:02 GMT-0800 (Pacific Standard Time)) ----
===============================================================================
--- Daemon -------------------------------------------------
pm2d version         : 3.2.2
node version         : 10.16.3
node path            : /usr/bin/pm2
argv                 : /usr/bin/node,/usr/lib/node_modules/pm2/lib/Daemon.js
argv0                : node
user                 : root
uid                  : 0
gid                  : 0
uptime               : 74min
===============================================================================
--- CLI ----------------------------------------------------
local pm2            : 3.2.2
node version         : 10.16.3
node path            : /usr/bin/pm2
argv                 : /usr/bin/node,/usr/bin/pm2,report
argv0                : node
user                 : root
uid                  : 0
gid                  : 0
===============================================================================
--- System info --------------------------------------------
arch                 : x64
platform             : linux
type                 : Linux
cpus                 : Intel(R) Celeron(R) CPU 1037U @ 1.80GHz
cpus nb              : 2
freemem              : 6961848320
totalmem             : 8283369472
home                 : /root
===============================================================================
--- PM2 list -----------------------------------------------
┌─────────────┬────┬─────────┬──────┬───────┬────────┬─────────┬────────┬─────┬───────────┬──────┬──────────┐
│ App name    │ id │ version │ mode │ pid   │ status │ restart │ uptime │ cpu │ mem       │ user │ watching │
├─────────────┼────┼─────────┼──────┼───────┼────────┼─────────┼────────┼─────┼───────────┼──────┼──────────┤
│ graphql-api │ 0  │ 2.1.4   │ fork │ 16343 │ online │ 0       │ 2m     │ 0%  │ 36.2 MB   │ root │ disabled │
└─────────────┴────┴─────────┴──────┴───────┴────────┴─────────┴────────┴─────┴───────────┴──────┴──────────┘
===============================================================================
--- Daemon logs --------------------------------------------
┌─────────────┬────┬─────────┬──────┬───────┬────────┬─────────┬────────┬─────┬───────────┬──────┬──────────┐
│ App name    │ id │ version │ mode │ pid   │ status │ restart │ uptime │ cpu │ mem       │ user │ watching │
├─────────────┼────┼─────────┼──────┼───────┼────────┼─────────┼────────┼─────┼───────────┼──────┼──────────┤
│ graphql-api │ 0  │ 2.1.4   │ fork │ 16343 │ online │ 0       │ 2m     │ 0%  │ 36.2 MB   │ root │ disabled │
└─────────────┴────┴─────────┴──────┴───────┴────────┴─────────┴────────┴─────┴───────────┴──────┴──────────┘
 Use `pm2 show <id|name>` to get more details about an app
 OmgImAlexis
All 18 comments
That same app still running and you can see the memory has increased. Where as with nohup or just directly with node I don't see this issue at all.
--- PM2 report ----------------------------------------------------------------
Date                 : Fri Nov 15 2019 21:10:59 GMT-0800 (Pacific Standard Time)
===============================================================================
--- Daemon -------------------------------------------------
pm2d version         : 4.1.2
node version         : 10.16.3
node path            : /usr/bin/pm2
argv                 : /usr/bin/node,/usr/lib/node_modules/pm2/lib/Daemon.js
argv0                : node
user                 : root
uid                  : 0
gid                  : 0
uptime               : 32min
===============================================================================
--- CLI ----------------------------------------------------
local pm2            : 4.1.2
node version         : 10.16.3
node path            : /usr/bin/pm2
argv                 : /usr/bin/node,/usr/bin/pm2,report
argv0                : node
user                 : root
uid                  : 0
gid                  : 0
===============================================================================
--- System info --------------------------------------------
arch                 : x64
platform             : linux
type                 : Linux
cpus                 : Intel(R) Celeron(R) CPU 1037U @ 1.80GHz
cpus nb              : 2
freemem              : 6957559808
totalmem             : 8283369472
home                 : /root
===============================================================================
--- PM2 list -----------------------------------------------
┌────┬─────────────────────────┬─────────┬─────────┬──────────┬────────┬──────┬──────────┬──────────┬──────────┬──────────┬──────────┐
│ id │ name                    │ version │ mode    │ pid      │ uptime │ ↺    │ status   │ cpu      │ mem      │ user     │ watching │
├────┼─────────────────────────┼─────────┼─────────┼──────────┼────────┼──────┼──────────┼──────────┼──────────┼──────────┼──────────┤
│ 0  │ graphql-api             │ 2.1.4   │ fork    │ 16735    │ 31m    │ 0    │ online   │ 0.3%     │ 39.6mb   │ root     │ disabled │
└────┴─────────────────────────┴─────────┴─────────┴──────────┴────────┴──────┴──────────┴──────────┴──────────┴──────────┴──────────┘
===============================================================================
--- Daemon logs --------------------------------------------
/root/.pm2/pm2.log last 20 lines:
PM2        | 2019-11-15T20:37:24: PM2 log: pid=16343 msg=process killed
PM2        | 2019-11-15T20:37:52: PM2 log: [PM2][WORKER] Reset the restart delay, as app graphql-api is up for more than 30000
PM2        | 2019-11-15T20:38:47: PM2 log: PM2 successfully stopped
PM2        | 2019-11-15T20:38:48: PM2 log: ===============================================================================
PM2        | 2019-11-15T20:38:48: PM2 log: --- New PM2 Daemon started ----------------------------------------------------
PM2        | 2019-11-15T20:38:48: PM2 log: Time                 : Fri Nov 15 2019 20:38:48 GMT-0800 (Pacific Standard Time)
PM2        | 2019-11-15T20:38:48: PM2 log: PM2 version          : 4.1.2
PM2        | 2019-11-15T20:38:48: PM2 log: Node.js version      : 10.16.3
PM2        | 2019-11-15T20:38:48: PM2 log: Current arch         : x64
PM2        | 2019-11-15T20:38:48: PM2 log: PM2 home             : /root/.pm2
PM2        | 2019-11-15T20:38:48: PM2 log: PM2 PID file         : /root/.pm2/pm2.pid
PM2        | 2019-11-15T20:38:48: PM2 log: RPC socket file      : /root/.pm2/rpc.sock
PM2        | 2019-11-15T20:38:48: PM2 log: BUS socket file      : /root/.pm2/pub.sock
PM2        | 2019-11-15T20:38:48: PM2 log: Application log path : /root/.pm2/logs
PM2        | 2019-11-15T20:38:48: PM2 log: Process dump file    : /root/.pm2/dump.pm2
PM2        | 2019-11-15T20:38:48: PM2 log: Concurrent actions   : 2
PM2        | 2019-11-15T20:38:48: PM2 log: SIGTERM timeout      : 1600
PM2        | 2019-11-15T20:38:48: PM2 log: ===============================================================================
PM2        | 2019-11-15T20:39:00: PM2 log: App [graphql-api:0] starting in -fork mode-
PM2        | 2019-11-15T20:39:03: PM2 log: App [graphql-api:0] online
I noticed I still have wait_ready in the ecosystem.config.js.
Even if I add this section there's no difference.
if (process.send) {
    process.send('ready');
}
Same goes with removing the wait_ready.
OmgImAlexis
on 18 Nov 2019
Been ~6hours that I run your sample code and there is no leak at all
Are you using pm2.io by any chance? So I can check what is happening
 Unitech
on 18 Nov 2019
Unitech
on 18 Nov 2019
The leak starts seconds after I run this.
Are you checking top? I’ve seen this on every machine I’ve tried it on.
No this is an internal app.
OmgImAlexis
on 18 Nov 2019
Under Node v10.17.0
PM2 version 4.1.2
I started your sample app containing a setTimeout(() => {}, 1000000000);
The memory is stable over the long run, when the memory is not used actively we have to wait longer for garbage collections cycles.
Here us the memory usage of the app over 24h:
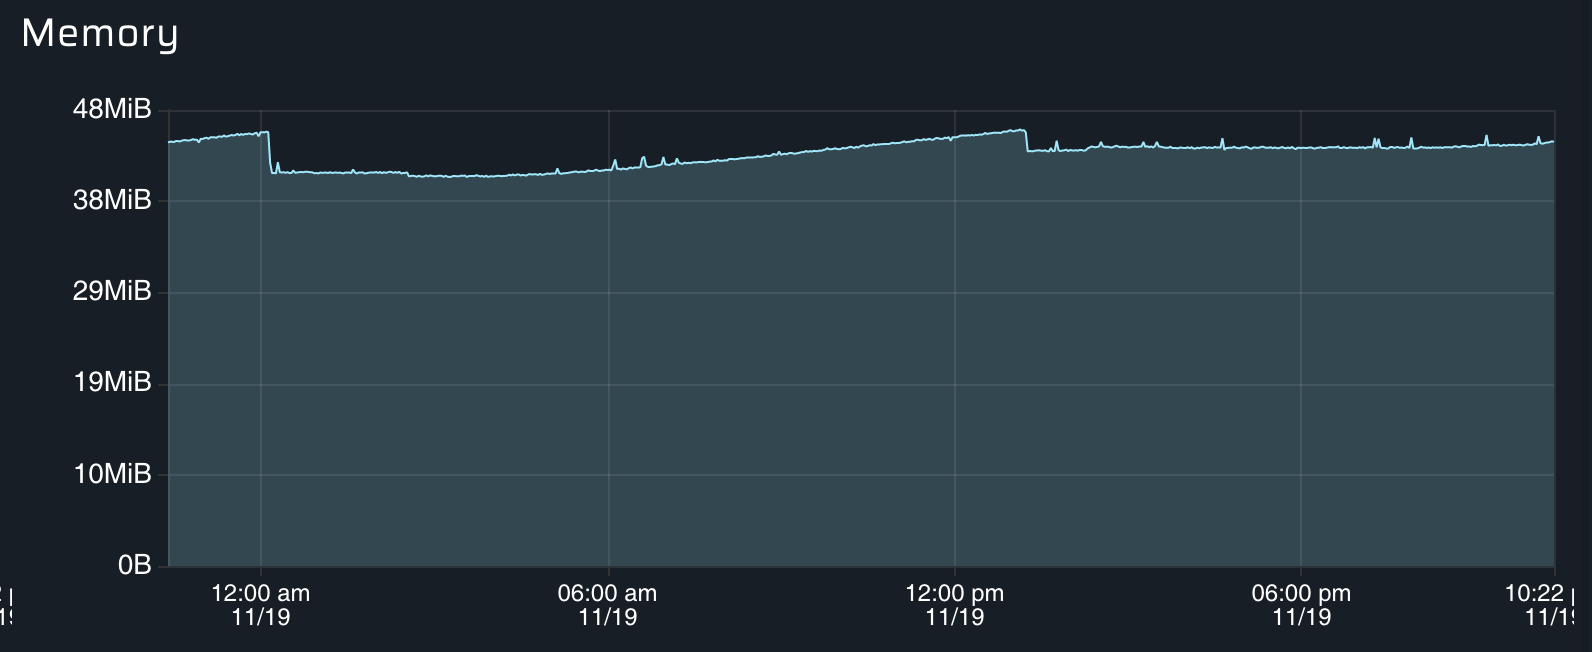
About PM2 memory usage itself it's also pretty stable over time (here we can see PM2 memory is actively used because of some periodic workers, but at the end the memory does not leak):

Unitech
on 19 Nov 2019
@Unitech again check top. The issue comes down the process itself. There shouldn't be any reason the process has any increase in memory. I get pm2's process may increase but that's the god process not my app.
OmgImAlexis
on 20 Nov 2019
If this issue just ends up being closed we'll just move away from pm2 as this is affecting most of our users.
OmgImAlexis
on 20 Nov 2019
The first chart I showed you is the app with the setTimeout[...].
If you prefer here is the screenshot of htop:

Memory usage of your graphql-api is STABLE over time.
Memory usage of PM2 God Daemon is STABLE over time.
I did not managed to reproduce your leak.
Unitech
on 20 Nov 2019
Is there anything else I can do to debug as I’m seeing the issue on all the machines I test this on.
OmgImAlexis
on 20 Nov 2019
Send me a screenshot over of your top screen
Unitech
on 21 Nov 2019
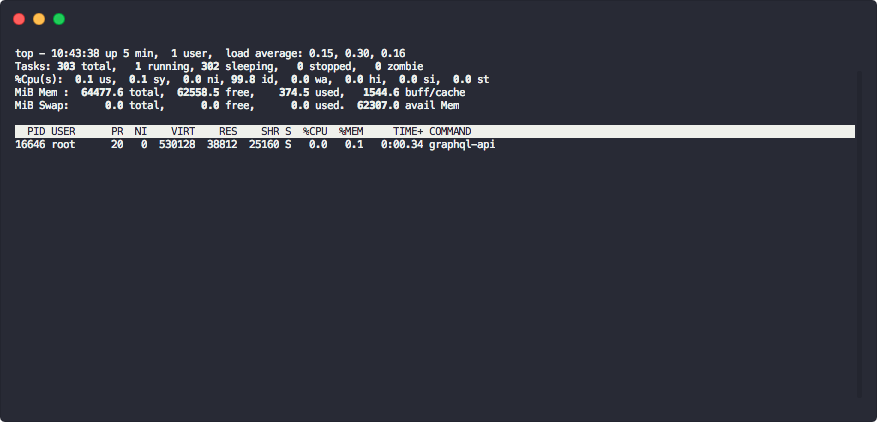
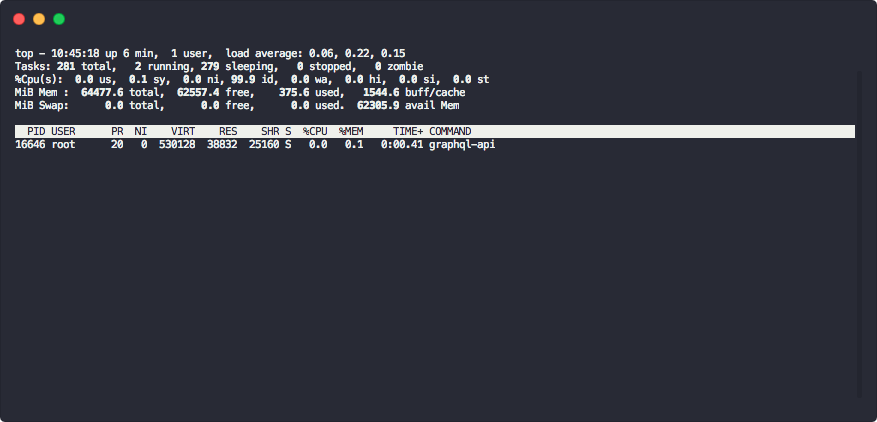
It keeps climbing. RES goes up slowly at the start but as time goes on it'll go up quicker and quicker.
OmgImAlexis
on 21 Nov 2019
Also noting I was seeing this going up quicker before. The screenshots above were just after a fresh boot so I'm not sure if that's affecting anything.
OmgImAlexis
on 21 Nov 2019
@Unitech is https://github.com/Unitech/pm2/issues/4256 related? That's the issue that made me look into this. Our main app is seeing a climb of 1MB/s or higher in same cases.
OmgImAlexis
on 21 Nov 2019
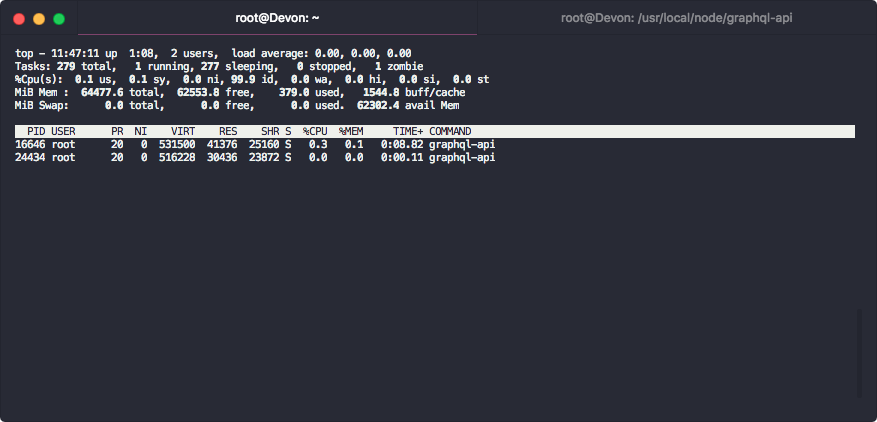
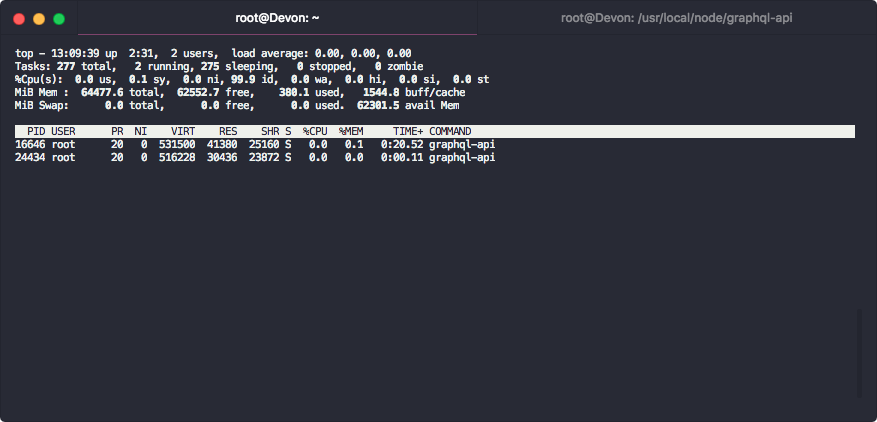
Here's a good example. The process with the smaller RES usage is one started with node index.js. Notice it doesn't increase at all.

OmgImAlexis
on 21 Nov 2019
Unless I'm missing something the process itself shouldn't be using any more memory than running directly against node.
OmgImAlexis
on 21 Nov 2019
OmgImAlexis
on 21 Nov 2019
It’s not leaking memory, memory is stable over time. If you don’t want process orchestration run ‘pm2 start app.js —no-pmx’
Unitech
on 22 Nov 2019
@Unitech what is process orchestration?
 adamalexander
on 20 Dec 2019
adamalexander
on 20 Dec 2019
Related issues
 phra
·
3Comments
phra
·
3Comments
 ghost
·
3Comments
ghost
·
3Comments
 chaos-git
·
3Comments
chaos-git
·
3Comments
 webchaz
·
3Comments
webchaz
·
3Comments
 ldarren
·
3Comments
ldarren
·
3Comments
Most helpful comment
That same app still running and you can see the memory has increased. Where as with
nohupor just directly withnodeI don't see this issue at all.