Actual behaviour
... pm2 monit consuming all available resources
Steps to reproduce
... pm2 monit
Software versions used
OS         : CentOS / CloudLinux  `3.10.0-427.36.1.lve1.4.40.el7.x86_64 `
node.js    : v7.7.4
PM2        : v2.4.2
PM2 Log output
Use the command: tail --lines 50 ~/.pm2/pm2.log
2017-03-25 23:30:34: ===============================================================================
2017-03-25 23:30:34: --- New PM2 Daemon started ----------------------------------------------------
2017-03-25 23:30:34: Time                 : Sat Mar 25 2017 23:30:34 GMT+0100 (CET)
2017-03-25 23:30:34: PM2 version          : 2.4.2
2017-03-25 23:30:34: Node.js version      : 7.7.4
2017-03-25 23:30:34: Current arch         : x64
2017-03-25 23:30:34: PM2 home             : /root/.pm2
2017-03-25 23:30:34: PM2 PID file         : /root/.pm2/pm2.pid
2017-03-25 23:30:34: RPC socket file      : /root/.pm2/rpc.sock
2017-03-25 23:30:34: BUS socket file      : /root/.pm2/pub.sock
2017-03-25 23:30:34: Application log path : /root/.pm2/logs
2017-03-25 23:30:34: Process dump file    : /root/.pm2/dump.pm2
2017-03-25 23:30:34: Concurrent actions   : 2
2017-03-25 23:30:34: SIGTERM timeout      : 1600
2017-03-25 23:30:34: ===============================================================================
2017-03-25 23:30:34: Starting execution sequence in -fork mode- for app name:SinonDiscordBot id:0
2017-03-25 23:30:34: App name:SinonDiscordBot id:0 online
2017-03-25 23:30:56: Starting execution sequence in -fork mode- for app name:SinonTwitchBot id:1
2017-03-25 23:30:56: App name:SinonTwitchBot id:1 online
2017-03-25 23:31:10: Starting execution sequence in -fork mode- for app name:SinonOsuBot id:2
2017-03-25 23:31:10: App name:SinonOsuBot id:2 online
2017-03-25 23:31:32: Starting execution sequence in -fork mode- for app name:SinonApiBot id:3
2017-03-25 23:31:32: App name:SinonApiBot id:3 online
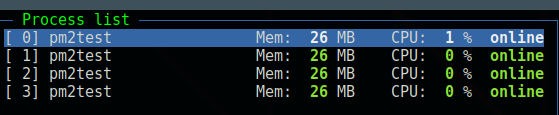
i have 4 node applications on monit, i also notice high CPU usage on my other server with 2 applications but this is causing a lockup of the system.
can provide more information on request
 killedWithFire9001
All 26 comments
I can confirm this bug, we are currently running ~80 node processes handled by PM2 on a large server and if I run pm2 monit it will start, almost freeze, and running htop on another terminal will show one CPU at 100% running pm2 monit.
pm2 monit in this situation is unusable (not possible to move around with arrow keys etc...)
We are running on a Debian 8 with node v7.3.0 and pm2 v2.4.4
 p-j
on 14 Apr 2017
p-j
on 14 Apr 2017
The PM2 consumes 100% CPU usage and apps gets disappeared from list.
We are running this in
PM2 version: 2.4.2
OS : Windows 7
RAM Memory: 8GB
Node: 4.1.1 (stable)
 shivahn
on 16 May 2017
shivahn
on 16 May 2017
For anyone having the problem while we are investigating, you can use the old one interface using pm2 imonit
 vmarchaud
on 21 May 2017
vmarchaud
on 21 May 2017
@vmarchaud thanks for that, that helps
just an update, im still getting this issue but much less impact-full bouncing between 10% and 80% usage on my dual core, im now using node v8.1.0
killedWithFire9001
on 15 Jun 2017
We were investigating the problem and didn't find a root cause, we need more time to make a decision on what to do to fix this issue.
vmarchaud
on 16 Jun 2017
Is it the monitor itself eating the cpu or the log that scrolls? I tend to think it's the log that scrolls and when it becomes large enough, it forces expensive redraws on the terminal graphics.
 dman777
on 8 Jul 2017
dman777
on 8 Jul 2017
@dman777 from my research it as a low impact on performance, it was basically eating CPU without any update rendered on the screen.
vmarchaud
on 8 Jul 2017
I did a test with pm2 monit:
1) overnight - app logs every 3 seconds.... morning time cpu was pegged at 14%
2) 2nd overnight - logging disabled. cpu was about 1%
dman777
on 8 Jul 2017
I can confirm this bug too.
OS Information
pm2 version: 2.5.0
nodejs version: 6.11.2
OS: Debian Jessie
Steps to reproduce
- Scale this script to 1 process per core
setInterval(() => {
    console.log('foo');
}, 250)
- Start pm2 monit.
- 6 processes which consumes around 18% CPU together

 mathewmeconry
on 7 Aug 2017
mathewmeconry
on 7 Aug 2017
this is no longer an issue for me, tho i do some times see large usage but normally clears after some time.
@dman777 logging quantity made no difference for me in the past, i print very minimal logs to console, the alternative suggested imonit is all i need anyways and i still use that tho the error has cleared for me
killedWithFire9001
on 20 Aug 2017
woke up this morning to the cpu usage of the machine slowly been creeping up over time, this issue has returned
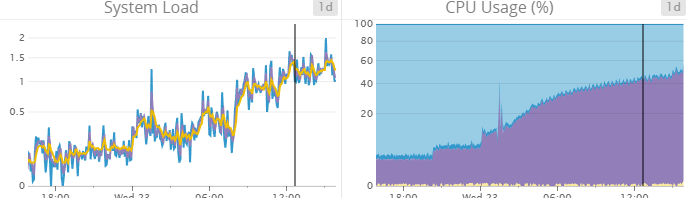
relaunching the pm2 monit cleared the issue but i still cant pin whats causing it, in that time gap around 100 lines was printed to the console with 6 active node applications
killedWithFire9001
on 23 Aug 2017
just updating server property's too as they have changed since original post
OS         : CentOS `3.10.0-514.26.2.el7.x86_64`
node.js    : v8.2.1
PM2        : v2.6.1
_pm2 monit_ is still reaching 100% of cpu, no logging, screen unresponsive.
What is found by the investigation?
My linux presents the same problem:
pm2 the latest: 2.6.1
Node v6.9.4
Distributor ID: Ubuntu
Description: Ubuntu 14.04.5 LTS
Release: 14.04
Codename: trusty
I think this is very common. And makes monit not usable in long run.
 paperab
on 7 Sep 2017
paperab
on 7 Sep 2017
confirm that
100% of CPU usage and ssh has been freezed

. Reconnection is required
 devjet
on 18 Sep 2017
devjet
on 18 Sep 2017
I confirm on our side too. PM2 2.7.1 and 2.7.2
On AWS servers and my own desktop too (Ubuntu 17.04).
 vcarel
on 22 Nov 2017
vcarel
on 22 Nov 2017
I confirm this on Windows server 2012.
 CineXMike
on 29 Nov 2017
CineXMike
on 29 Nov 2017
Can confirm in v2.8.0 still freezing. Ubuntu 16.
 bladefist
on 12 Dec 2017
bladefist
on 12 Dec 2017
can confirm in v2.8.0 on Debian Jessie fully patched.
freeze after 14m and average cpu consumption of 25% on a 4 core system with 5 processes
mathewmeconry
on 13 Dec 2017
Still on v2.9.1 Ubuntu 16. Any significant log rendering in monit hastens the crash
 adamkaplan
on 15 Dec 2017
adamkaplan
on 15 Dec 2017
We are aware of this problem, but we don't have time to handle this so if anyone want to make some research, here is the class that handle the pm2 monit command : https://github.com/Unitech/pm2/blob/master/lib/API/Dashboard.js
vmarchaud
on 15 Dec 2017
Totally understand! Do you have any ideas/hints for us to start with?
My initial guess is something about this code block might be overloading the rendering engine:
https://github.com/Unitech/pm2/blob/master/lib/API/Dashboard.js#L357-L365
I haven't coded with Blessed before, but a quick scan of the README showed an element made specifically for displaying infinite log data:
https://github.com/chjj/blessed#log-from-scrollabletext
At first glance, looks like the Dashboard logBox is a regular box text box. Changing to a Blessed Log instead might just fix the issue.
adamkaplan
on 15 Dec 2017
@adamkaplan I already inspected the problem few month ago but didn't found something in few dozens of minutes, if you can test and make a PR if its the right fix, we will merge it :)
vmarchaud
on 15 Dec 2017
I'm digging up this old issue to report that as March 12 2019 on a fresh ubuntu/node/npm/pm2 install this still happens, was a fix found in the meantime ?

 Antonhansel
on 12 Mar 2019
Antonhansel
on 12 Mar 2019
Definitely not fixed. I've just experienced this problem with both monit and log.
I accidentally left pm2 monit running overnight two days ago and yesterday morning the server was very slow and top showed pm2 using 96% CPU constantly. I killed it, back to normal.
Last night I accidentally left pm2 log running overnight and today the server was down. I don't think it was a crash but Google Compute Engine stopping it, as when I went to check I found it was stopped with the helpful notice "This instance has had high CPU and memory utilisation recently. Consider switching to the machine the type to X".
 dbonnell
on 21 Mar 2019
dbonnell
on 21 Mar 2019
fixed, now the logs stream array is fixed size, will be released soon
 Unitech
on 5 Apr 2019
Unitech
on 5 Apr 2019
I'm also facing the issue with pm2 is consuming 100% CPU.
Version Details:
pm2 ---> 4.4.0
node ---> v12.16.3
npm ---> 6.14.4
 smchinna
on 31 May 2020
smchinna
on 31 May 2020
Related issues
 jubairsaidi
·
3Comments
jubairsaidi
·
3Comments
 FujiHaruka
·
3Comments
FujiHaruka
·
3Comments
 rajendar38
·
3Comments
rajendar38
·
3Comments
 ldarren
·
3Comments
ldarren
·
3Comments
 webchaz
·
3Comments
webchaz
·
3Comments
Most helpful comment
For anyone having the problem while we are investigating, you can use the old one interface using
pm2 imonit