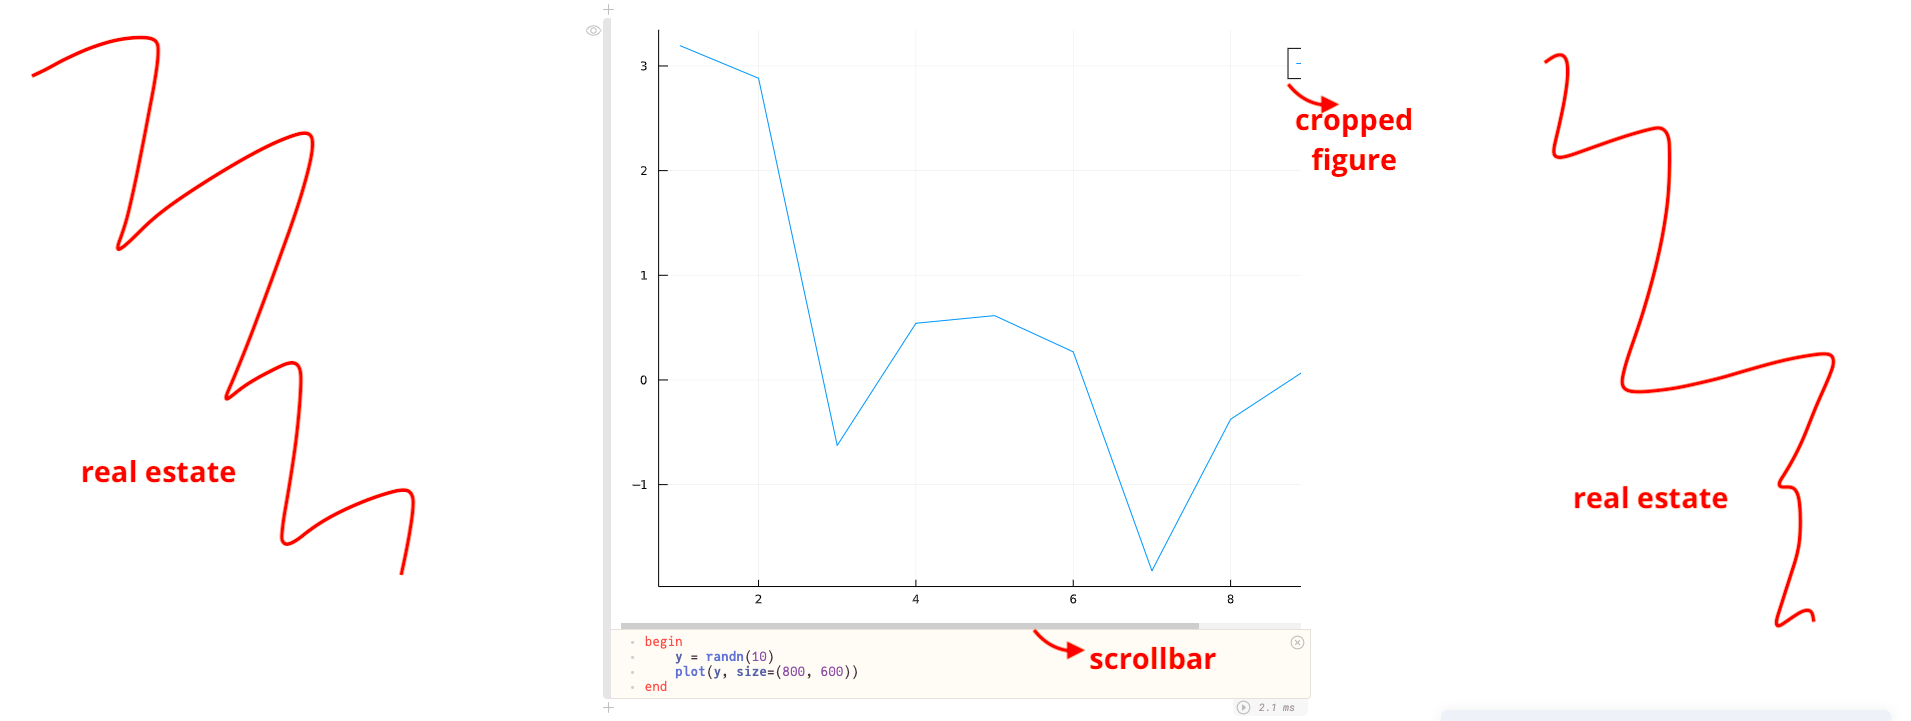
While displaying plots (with Plots, using the size=(w,h) argument) it seems that after about a value of 700 for the width, the figure gets cropped and a scrollbar is added. There is no such restriction on height, and I wish I could use more real estate on the screen for bigger plots, since most of the side bars in Pluto are blank anyway, but it seems that the maximum figure width allowed is the cell width. Can I change this behaviour?
 mlg556
All 4 comments
Hi! I can see two solutions from the top of my head:
1. Make all cells wider (respect plot size)
This will allow all cells to take up more space (which you might like, or not). The provided size parameter is respected.
html"""
<style>
  main {
    max-width: 900px;
  }
</style>
"""
2. Scale plot down (respect cell size)
This scales the plot down (while preserving its aspect ratio) to fit the cell. The provided size parameter is _not_ respected; the plot will be <= the provided size[1]!
html"""
<style>
  svg {
    width: 100%;
  }
</style>
"""
If one of these doesn't fit your needs, I can probably figure out another one (I'm thinking CSS grid style). Hope this helps!

 Pocket-titan
on 8 Oct 2020
Pocket-titan
on 8 Oct 2020
thanks @Pocket-titan seems like solution 1 is what I need. is there any documentation that missed on this? I did not know that cell configuration was possible using raw html. perhaps this should be explained in a "configuration" section or something ?
mlg556
on 8 Oct 2020
I don't think you missed anything, it's just something that happens to work because of the way html elements are handled & css selectors are scoped (for example on observable, any css you return will be applied to the cells only. In Pluto it's applied to the entire document, which enables cool things like this!)
You're right that this could be explained better! That would maybe also reduce the number of issues relating to specific css things, because users can just change it themselves and get on with their life. I'll see what I can do, thanks for your suggestion 😊
Pocket-titan
on 8 Oct 2020
Also note that we are looking at scoping css by default, and then having a separate type for global css.
Something like
PlutoUI.PlutoHTML"""
<style>
  svg {
    width: 100%;
  }
</style>
"""
 dralletje
on 8 Oct 2020
dralletje
on 8 Oct 2020
Related issues
 aramirezreyes
·
3Comments
aramirezreyes
·
3Comments
 enuit
·
3Comments
enuit
·
3Comments
 Roger-luo
·
7Comments
Roger-luo
·
7Comments
 FelixBenning
·
3Comments
FelixBenning
·
3Comments
 jarvist
·
6Comments
jarvist
·
6Comments
Most helpful comment
Hi! I can see two solutions from the top of my head:
1. Make all cells wider (respect plot size)
This will allow all cells to take up more space (which you might like, or not). The provided
sizeparameter is respected.2. Scale plot down (respect cell size)
This scales the plot down (while preserving its aspect ratio) to fit the cell. The provided
sizeparameter is _not_ respected; the plot will be<=the providedsize[1]!If one of these doesn't fit your needs, I can probably figure out another one (I'm thinking CSS grid style). Hope this helps!