Display the # of subscribers over time on tag stats pages like this: https://publiclab.org/tag/ui/stats
 cesswairimu
All 6 comments
@gauravano @jywarren @sagarpreet-chadha @SidharthBansal
This is what I have in mind for this graph.
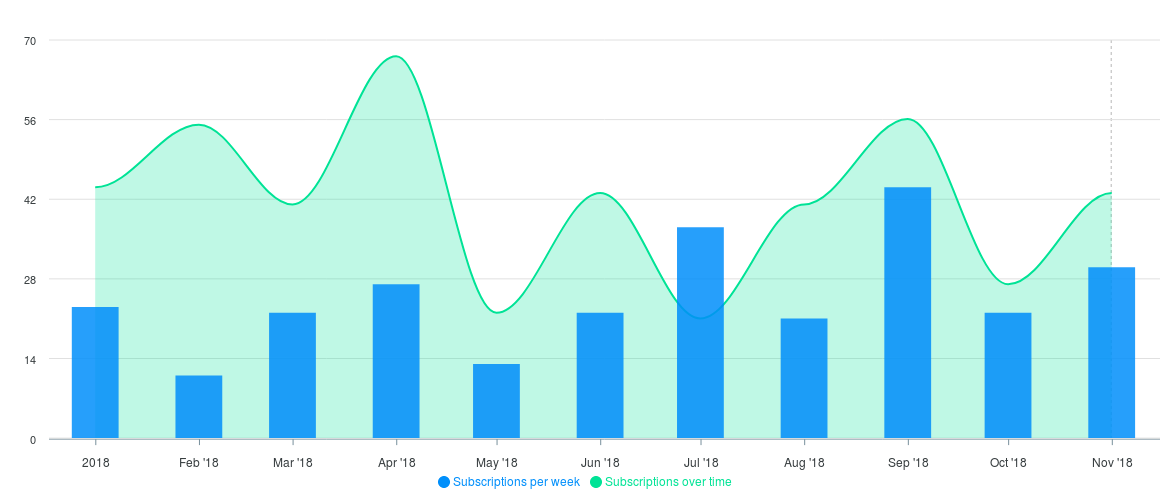
The bar graphs showing the number of subscribers subscribed during a period and the area graph showing the growth number of subscribers with time for each tag.
However I am blocked on how to fetch this data. The tag_selection model does not have a timestamp so I cannot use it to get the number of subscribers at a particular time or the number of subscribers who subscribed within a given range. Maybe I am missing something...any ideas on how I can query the number of subscribers against time.
Also how does the graph look? Thanks.
cesswairimu
on 21 Mar 2019
ahhhhhhh node_selection has no timestamp? wait, what about tag_selection?
If tag_selection has none, we may be stuck! I mean, we could start tracking
now, but we'd have no data from the past...
On Thu, Mar 21, 2019 at 12:33 PM Cess notifications@github.com wrote:
@gauravano https://github.com/gauravano @jywarren
https://github.com/jywarren @sagarpreet-chadha
https://github.com/sagarpreet-chadha @SidharthBansal
https://github.com/SidharthBansalThis is what I have in mind for this graph.
[image: sy59iglx]
https://user-images.githubusercontent.com/17081074/54767485-486f0800-4c0e-11e9-9ed0-d88c2d4b531c.pngThe bar graphs showing the number of subscribers subscribed during a
period and the area graph showing the growth number of subscribers with
time for each tag.However I am blocked on how to fetch this data. The node_selection model
does not have a timestamp so I cannot use it to get the number of
subscribers at a particular time or the number of subscribers who
subscribed within a given range. Maybe I am missing something...any ideas
on how I can query the number of subscribers against time.
Also how does the graph look? Thanks.—
You are receiving this because you were mentioned.
Reply to this email directly, view it on GitHub
https://github.com/publiclab/plots2/issues/4925#issuecomment-475305000,
or mute the thread
https://github.com/notifications/unsubscribe-auth/AABfJyubdnHBGWfWXH06u8jsApglKP2cks5vY7QugaJpZM4bgPRA
.
 jywarren
on 21 Mar 2019
jywarren
on 21 Mar 2019
Oh sorry I meant tag_selection
cesswairimu
on 22 Mar 2019
Okay I think I will add the timestamp and we can start tracking from now. Thanks @jywarren
cesswairimu
on 22 Mar 2019
OK, thank you Cess!
On Fri, Mar 22, 2019 at 12:27 PM Cess notifications@github.com wrote:
Okay I think I will add the timestamp and we can start tracking from now.
Thanks @jywarren https://github.com/jywarren—
You are receiving this because you were mentioned.
Reply to this email directly, view it on GitHub
https://github.com/publiclab/plots2/issues/4925#issuecomment-475686753,
or mute the thread
https://github.com/notifications/unsubscribe-auth/AABfJzLugzcC00gmXdUVYwgsCWdgjkFJks5vZQQ9gaJpZM4bgPRA
.
jywarren
on 22 Mar 2019
Active Record automatically timestamps create and update operations if the table has fields named created_at/created_on or updated_at/updated_on.
I think this'll be a very quick fix!
jywarren
on 20 May 2019
Related issues
![first-timers[bot] picture](https://avatars.githubusercontent.com/in/4832?v=4&s=40) first-timers[bot]
·
3Comments
first-timers[bot]
·
3Comments
first-timers[bot]
·
3Comments
first-timers[bot]
·
3Comments
 shapironick
·
3Comments
shapironick
·
3Comments
 bronwen9
·
3Comments
jywarren
·
3Comments
bronwen9
·
3Comments
jywarren
·
3Comments
Most helpful comment
@gauravano @jywarren @sagarpreet-chadha @SidharthBansal
This is what I have in mind for this graph.

The bar graphs showing the number of subscribers subscribed during a period and the area graph showing the growth number of subscribers with time for each tag.
However I am blocked on how to fetch this data. The
tag_selectionmodel does not have a timestamp so I cannot use it to get the number of subscribers at a particular time or the number of subscribers who subscribed within a given range. Maybe I am missing something...any ideas on how I can query the number of subscribers against time.Also how does the graph look? Thanks.