The new graph on stats page is quite awesome
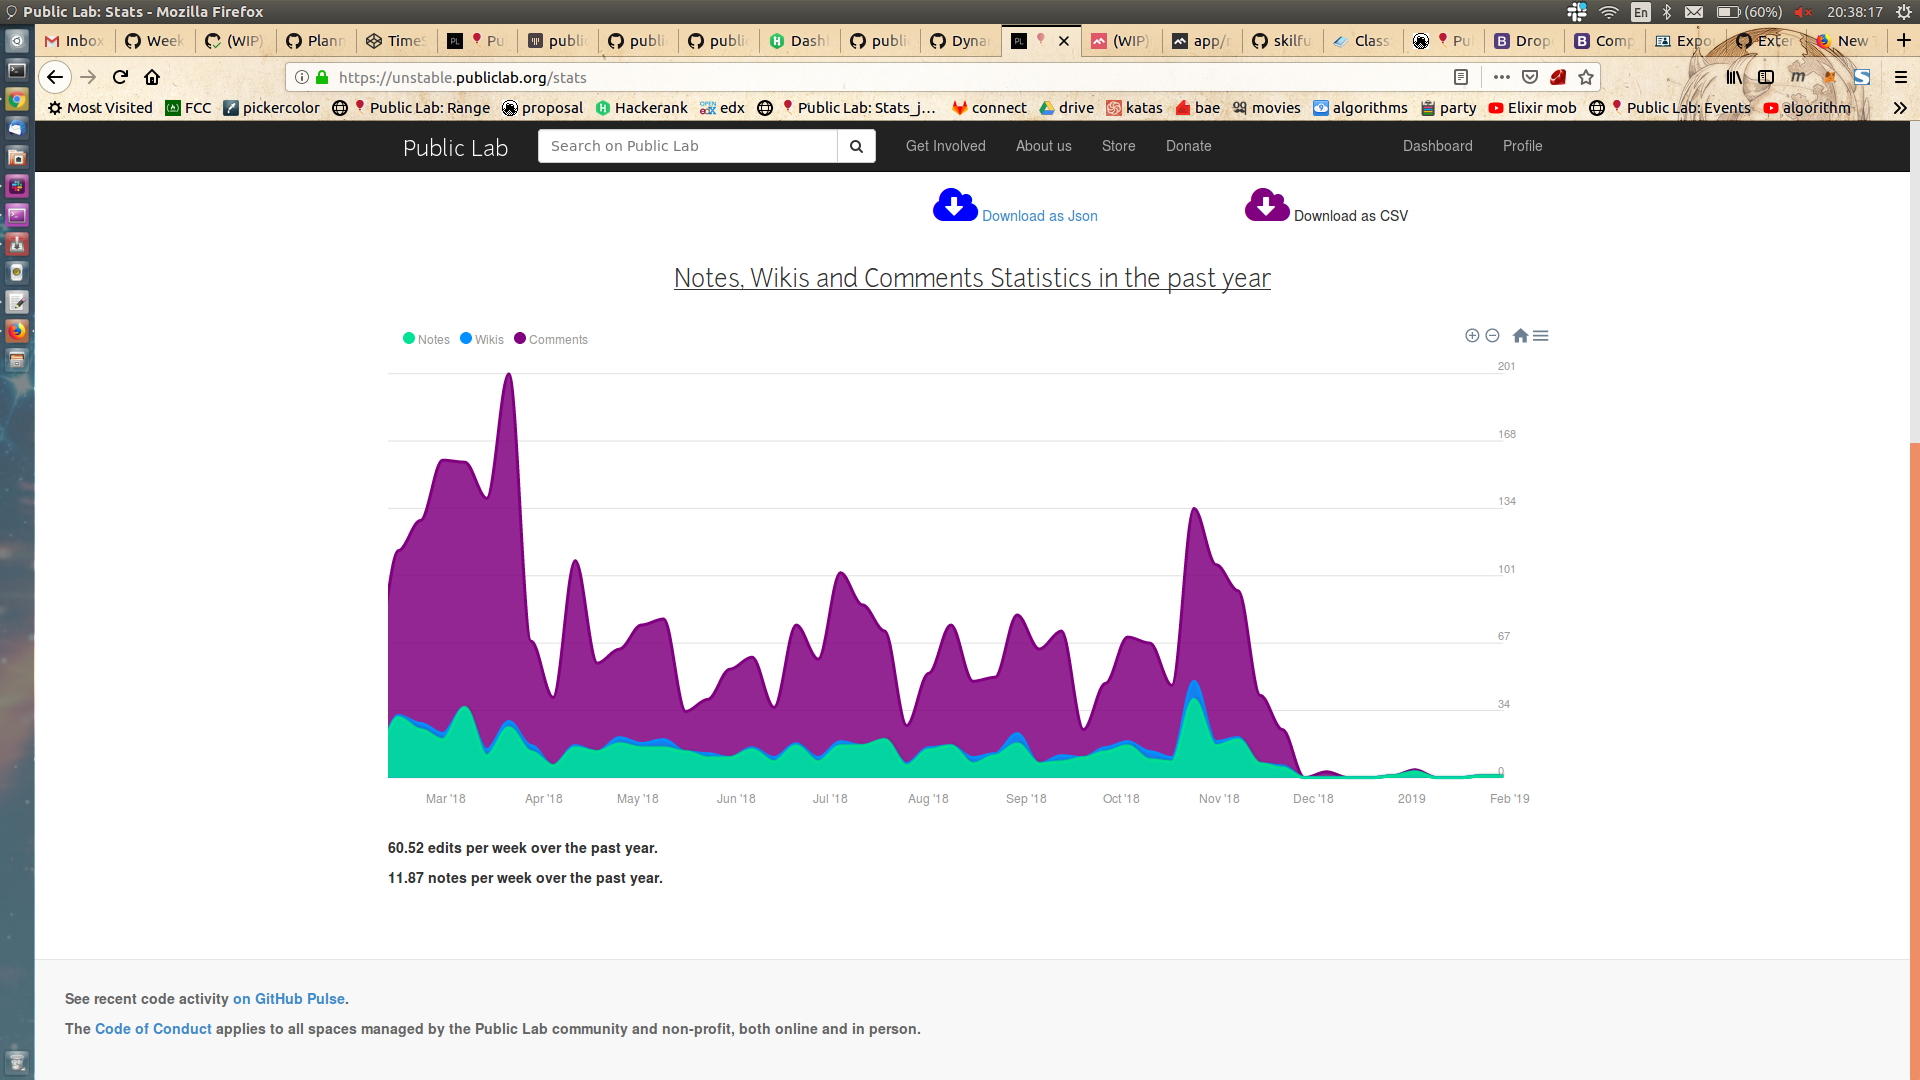
But it only covers 52 weeks from the start date and we now have zoom buttons. If you zoom out of the 52 weeks the graph does not expand
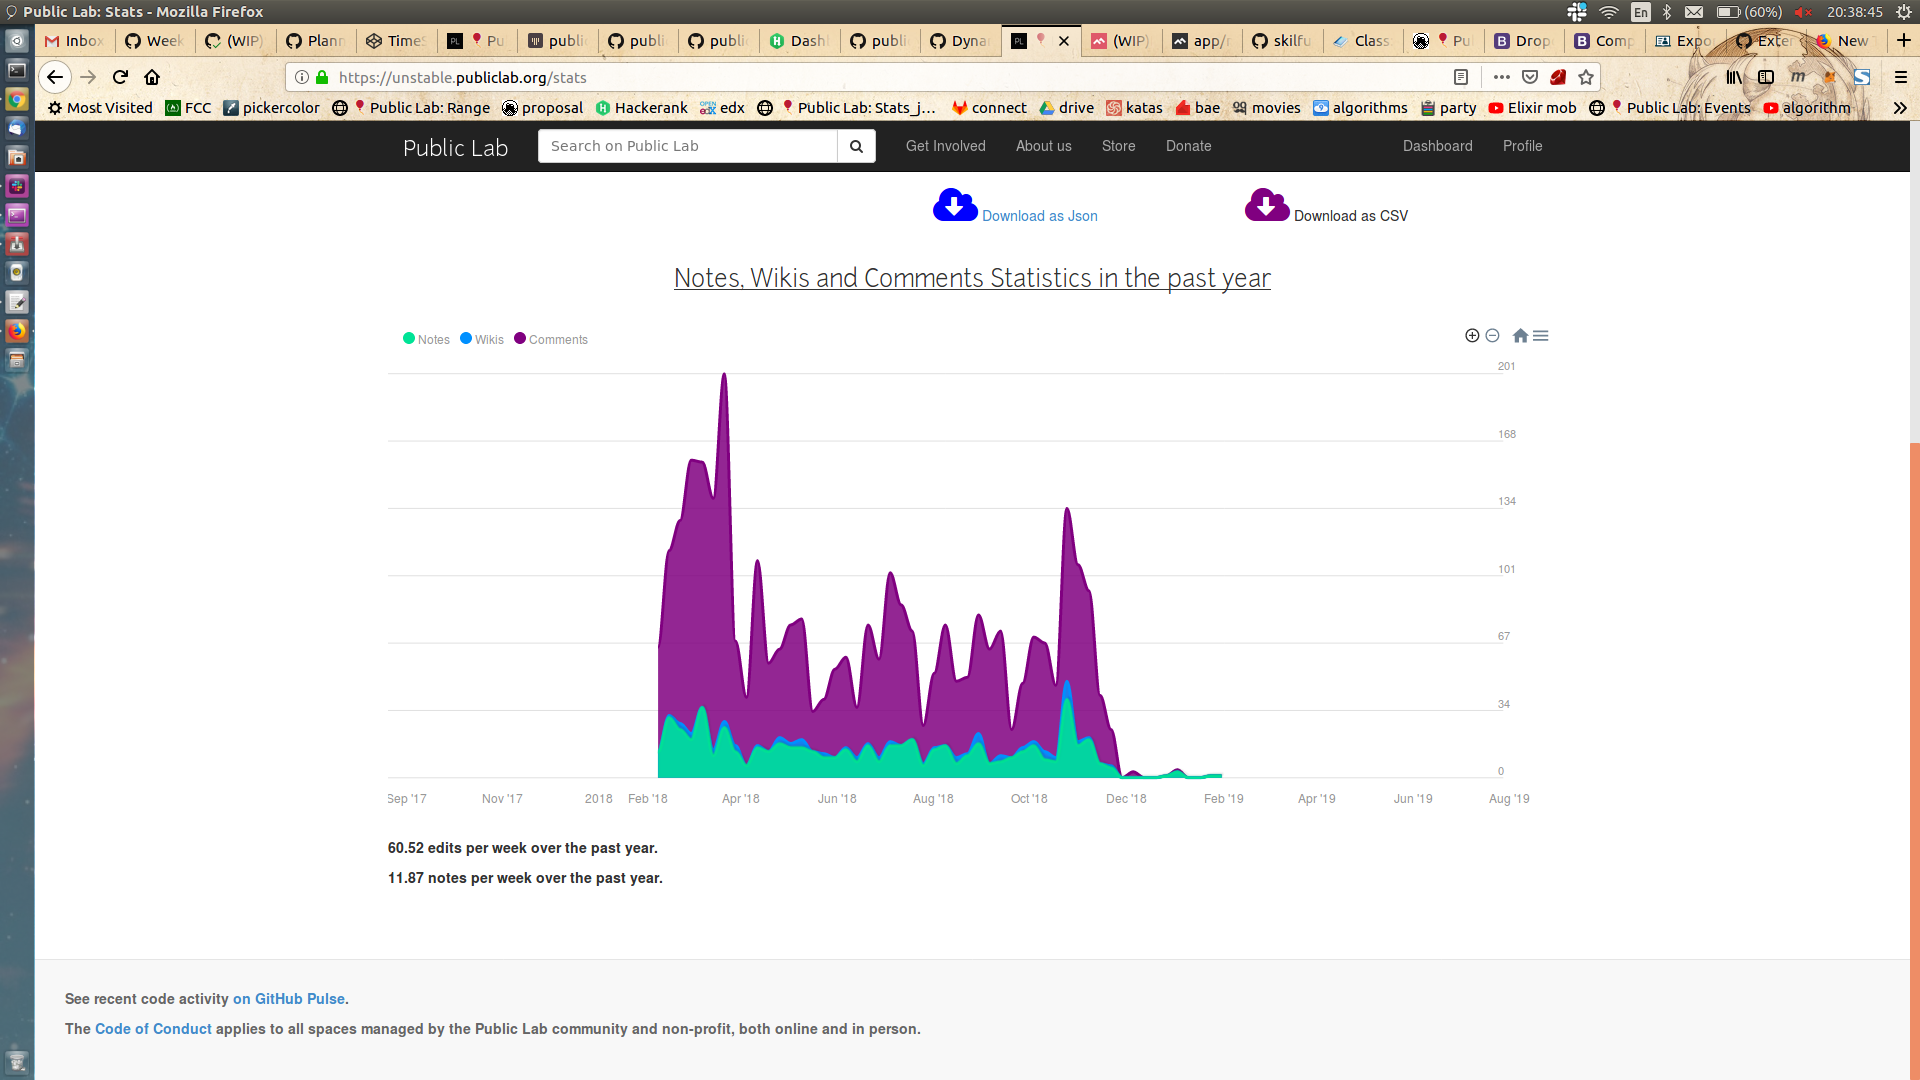
It should be able to have a expand beyond the 52 weeks
Or restructure the graph_making method on models e.g
https://github.com/publiclab/plots2/blob/master/app/models/node.rb#L190-#L210
 cesswairimu
All 2 comments
Yes, let's try to refactor graph_making to accept begin and end date
parameters, then it'll be easier to merge the /stats/range pages with
/stats pages!
On Tue, Feb 5, 2019 at 1:11 PM Cess notifications@github.com wrote:
The new graph on stats page is quite awesome
[image: ref1]
https://user-images.githubusercontent.com/17081074/52294208-b676ad00-2989-11e9-85b9-7ca0f7ab54e3.png
But it only covers 52 weeks from the start date and we now have zoom
buttons. If you zoom out of the 52 weeks the graph does not expand
[image: ref2]
https://user-images.githubusercontent.com/17081074/52294261-e45bf180-2989-11e9-8193-bdbe1c11a471.png
It should be able to have a expand beyond the 52 weeksOr restructure the graph_making method on models e.g
https://github.com/publiclab/plots2/blob/master/app/models/node.rb#L190-#L210—
You are receiving this because you are subscribed to this thread.
Reply to this email directly, view it on GitHub
https://github.com/publiclab/plots2/issues/4765, or mute the thread
https://github.com/notifications/unsubscribe-auth/AABfJ8Tu2Mg4WcRMe3me_eFxcaATl994ks5vKckYgaJpZM4ajxtJ
.
 jywarren
on 5 Feb 2019
jywarren
on 5 Feb 2019
Implemented the new contribution graph method on #4887
cesswairimu
on 5 Mar 2019
Related issues
jywarren
·
3Comments
 grvsachdeva
·
3Comments
grvsachdeva
·
3Comments
 milaaraujo
·
3Comments
milaaraujo
·
3Comments
grvsachdeva
·
3Comments
milaaraujo
·
3Comments
milaaraujo
·
3Comments
grvsachdeva
·
3Comments
Most helpful comment
Yes, let's try to refactor graph_making to accept begin and end date
parameters, then it'll be easier to merge the /stats/range pages with
/stats pages!
On Tue, Feb 5, 2019 at 1:11 PM Cess notifications@github.com wrote: