Plots2: Move graphs from tag pages (like /tag/soc) to tag stats pages
Dear @cesswairimu and other interested people,
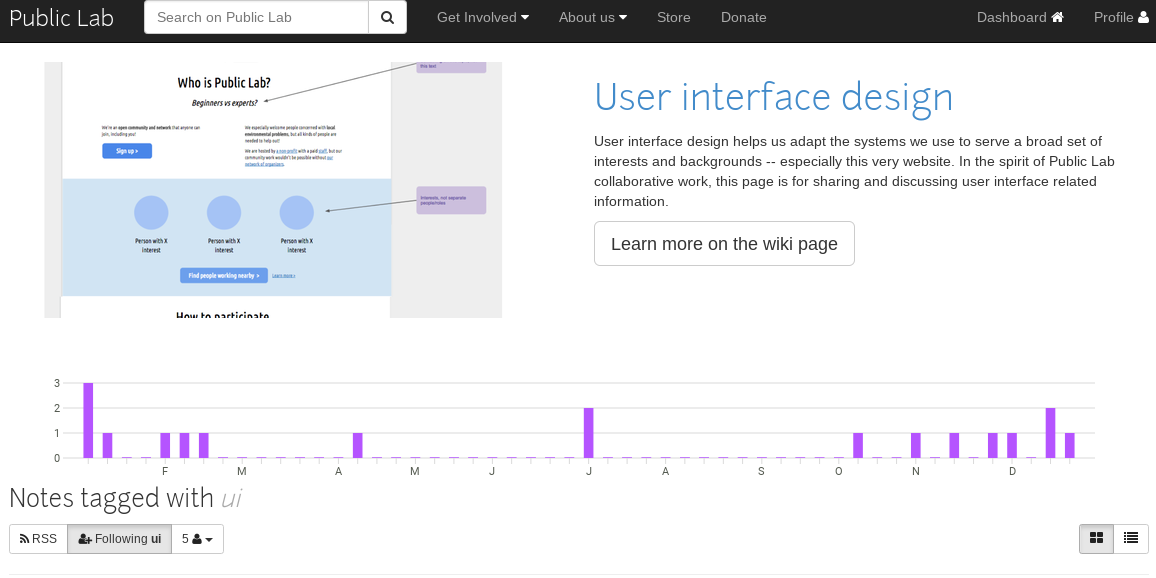
I've been sitting in on some of the user interviews, and the purple graphs are confusing people mostly because:
1) the axes are not labelled
2) that they are "above the fold" taking up a lot of room and pushing the actual content that people are looking for farther down.
While clearly many aspects of stats on publiclab.org are being revisited simultaneously probably including graphing, I'm creating this small issue hoping that we can:
a) make tag-specific stats pages (could be at /tag/stats/
b) move the graph there
c) add a "stats" link from one to the other
Thank you!
 ebarry
All 8 comments
@ebarry quick question just to be sure. Are you talking about the graphs on this page https://publiclab.org/stats ? Thanks
 cesswairimu
on 10 Jan 2019
cesswairimu
on 10 Jan 2019
Hi @cesswairimu :)!
Actually i'm not, thanks for asking! I'm talking about the purple graphs on pages https://publiclab.org/tag/_____, for instance https://publiclab.org/tag/oil
ebarry
on 10 Jan 2019
Could someone share a link to the tag page code here?
ebarry
on 11 Jan 2019
https://github.com/publiclab/plots2/tree/master/app/views/tag/show.html.erb
here you go!
On Fri, Jan 11, 2019 at 2:48 PM Liz Barry notifications@github.com wrote:
Could someone share a link to the tag page code here?
—
You are receiving this because you are subscribed to this thread.
Reply to this email directly, view it on GitHub
https://github.com/publiclab/plots2/issues/4593#issuecomment-453636348,
or mute the thread
https://github.com/notifications/unsubscribe-auth/AABfJy6h51Re5zfmh4Lxv-k6RX0oTGqYks5vCOp4gaJpZM4Z6O9t
.
 jywarren
on 11 Jan 2019
jywarren
on 11 Jan 2019
Thank you for providing the link to the code! I'm wondering if, for the time being, we can stop rendering the graphs on the tag pages? Here's a screenshot of what i would like to remove from the tag pages:
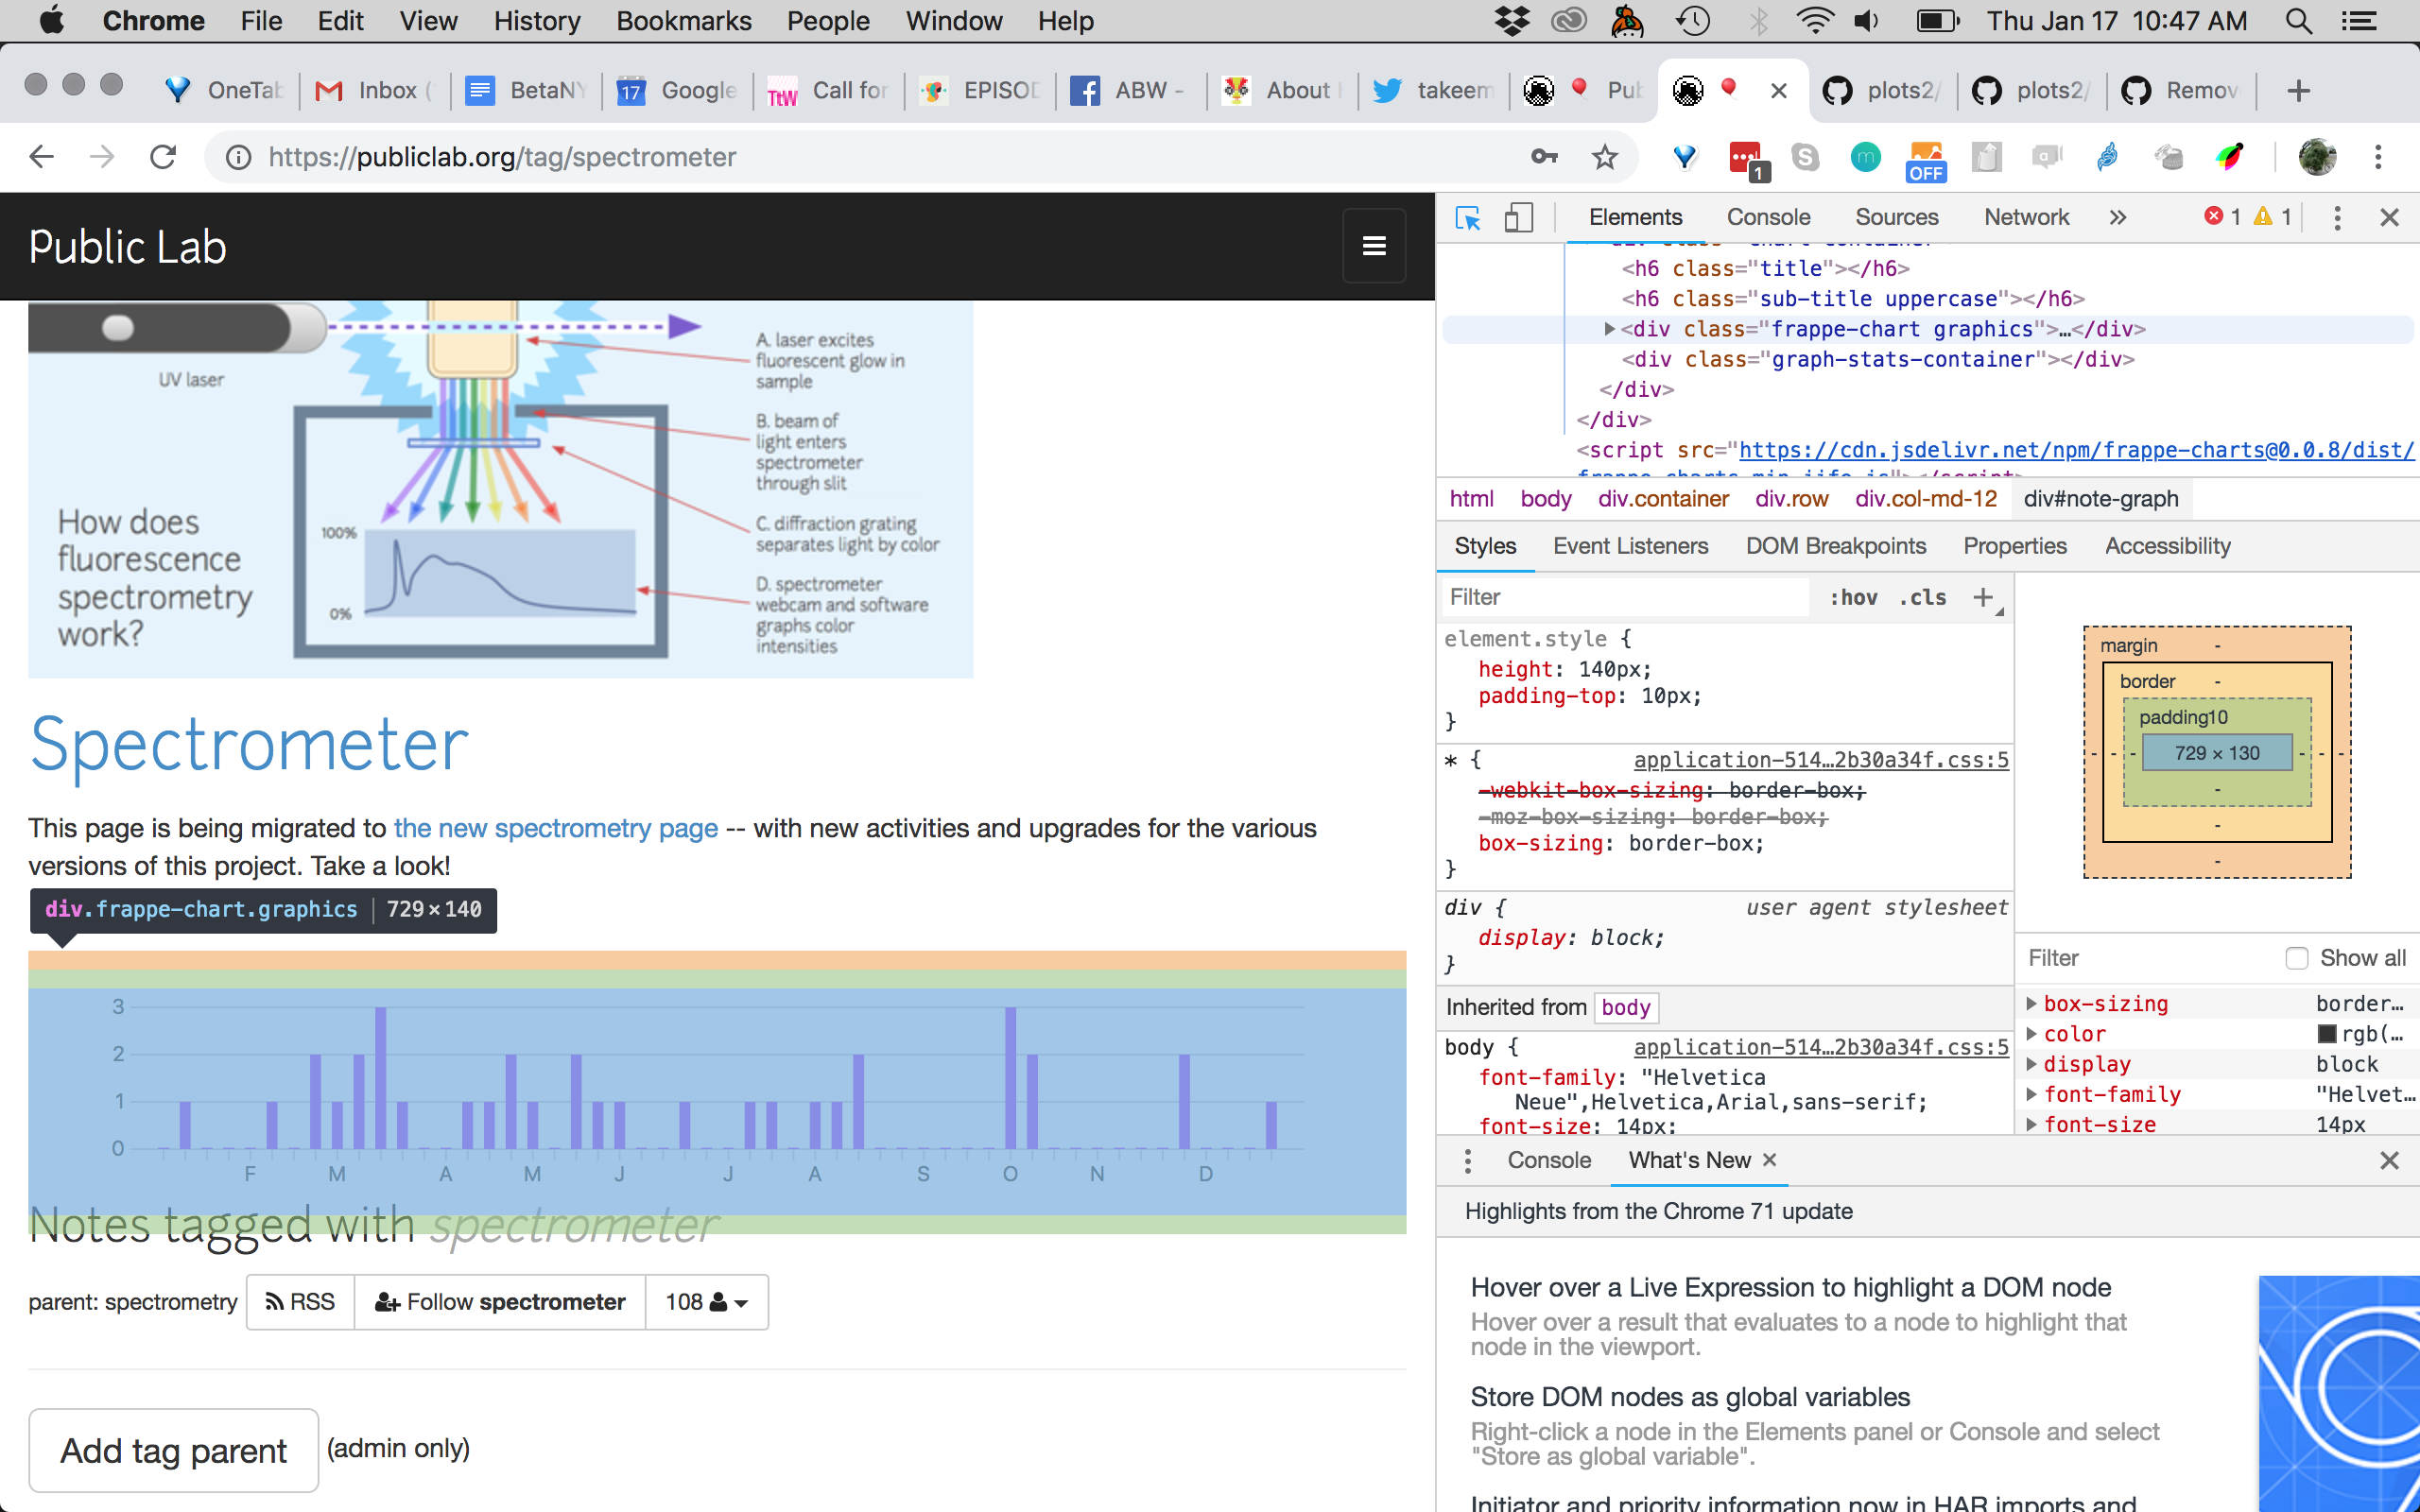
Seems to be perhaps partially related to https://github.com/publiclab/plots2/blob/master/app/views/tag/_graph.html.erb which the wonderful @Souravirus worked on last year. Please forgive me for any offense I unintentionally cause for asking this.
ebarry
on 17 Jan 2019
Hi, all, just to help this along, i changed the title a bit to reflect the move of this graph from the tag pages to the tag-specific stats pages in https://github.com/publiclab/plots2/issues/4140 (see overall milestone https://github.com/publiclab/plots2/milestone/20)
Also, i like Liz's idea of approaching this incrementally; I think the easiest way would be to "hide" the graph and make it display only when a "graph" icon is pressed, until such time as we have a new tag stats page to move it to. I'll note in #4140 that the tag graph could be the very first feature of that new page.
For now, I recommend adding it next to the RSS button:
That'll address 1) from Liz's comment above - for 2), i'll note that graph labels will be crucial, in #4140.
I'm going to make a candidate FTO that points out how we might do the toggle button. Once we have the tag stats page, that button could be the link to the other page, instead of just toggling the graph.
@edieblu just a heads up that these things are in motion!
And thanks to everyone here - @cesswairimu or @Souravirus if you're interested in recruiting for the FTO that'd be awesome! Also feel free to edit the issue I create.
jywarren
on 17 Jan 2019
Opened an FTO candidate here: https://github.com/publiclab/plots2/issues/4646
jywarren
on 17 Jan 2019
@cesswairimu if you want to finish formatting it, feel free to edit mine!
jywarren
on 17 Jan 2019
Related issues
 grvsachdeva
·
3Comments
grvsachdeva
·
3Comments
 RuthNjeri
·
3Comments
RuthNjeri
·
3Comments
 keshavsethi
·
3Comments
ebarry
·
3Comments
keshavsethi
·
3Comments
ebarry
·
3Comments
![first-timers[bot] picture](https://avatars.githubusercontent.com/in/4832?v=4&s=40) first-timers[bot]
·
3Comments
first-timers[bot]
·
3Comments