Plots2: Planning issue: Improve various graphs across site
Please describe the idea
Stats graphs appear in many places around the site, so improving these graphs will have a big impact on how people understand activity in Public Lab
Background on graphs
The graphs haven't been improved since they were first created some years ago. Stats and graphs of all kinds are important for how the community can see itself, and for the non-profit to do evaluation with.
Ideas for graphs on /tag/____ pages
like http://publiclab.org/tag/kite-making
- [x] Each graph on pages like
/tag/____ pagesshould be a link to http://publiclab.org/stats - [x] Each graph should have a labeled X and Y axis
- [x] Each graph should have a tooltip showing the data that is graphed
- [x] Each graph should _potentially_ have a label like "Activity", but perhaps this won't be needed with well-labeled axes or by using the tooltip (although that won't work on mobile)
- [ ] Determine how graphs should appear on mobile
Related graphing issues across the site
- [x] Heat maps on profile pages #2361
- [x] http://publiclab.org/stats page graph styling and features (incorporating above ideas): #2068
Examples of graphs on publiclab.org
- The home of graphs on publiclab.org: https://publiclab.org/stats
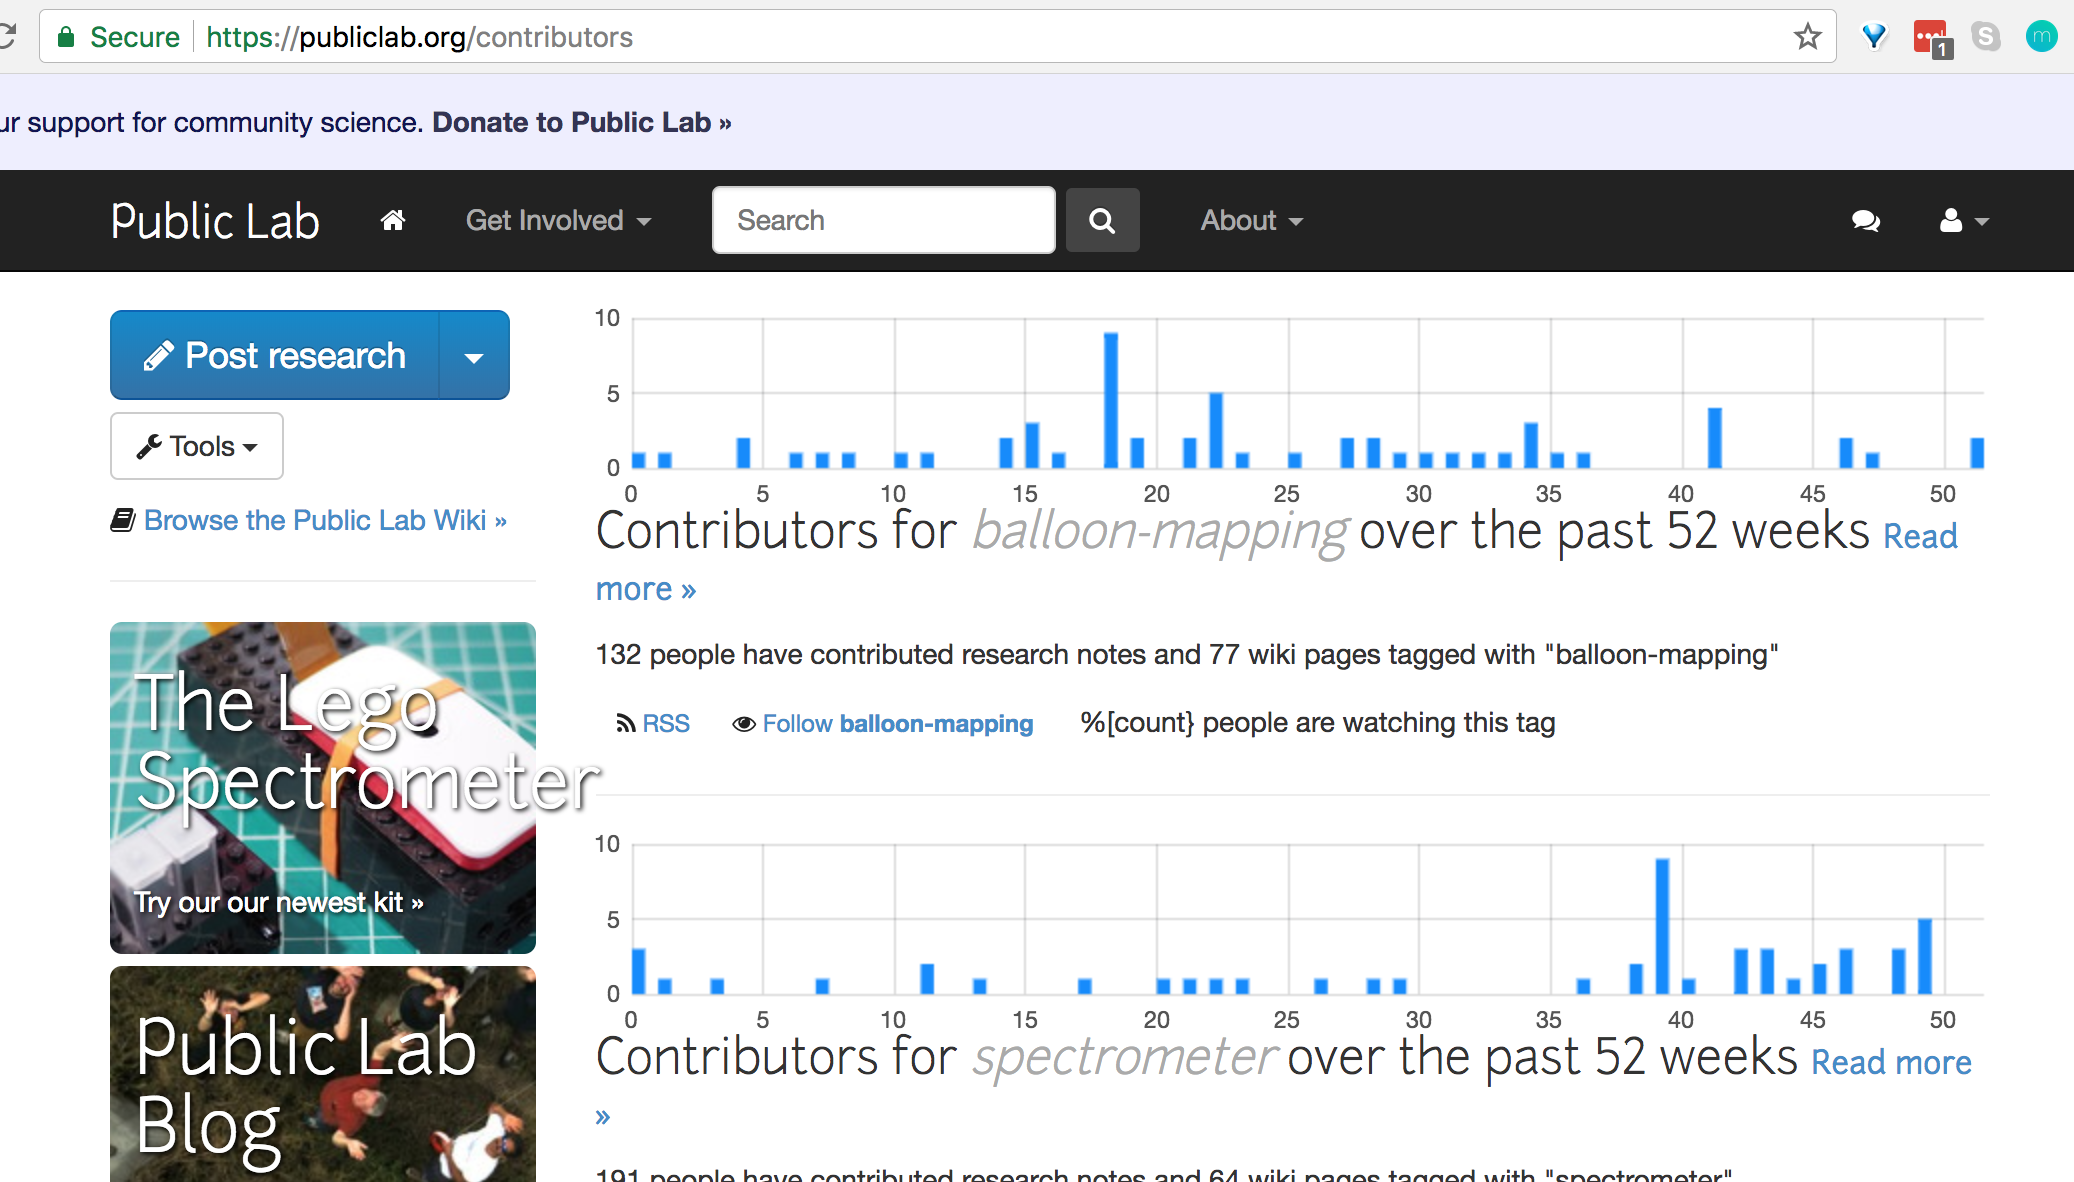
- all contributors https://publiclab.org/contributors
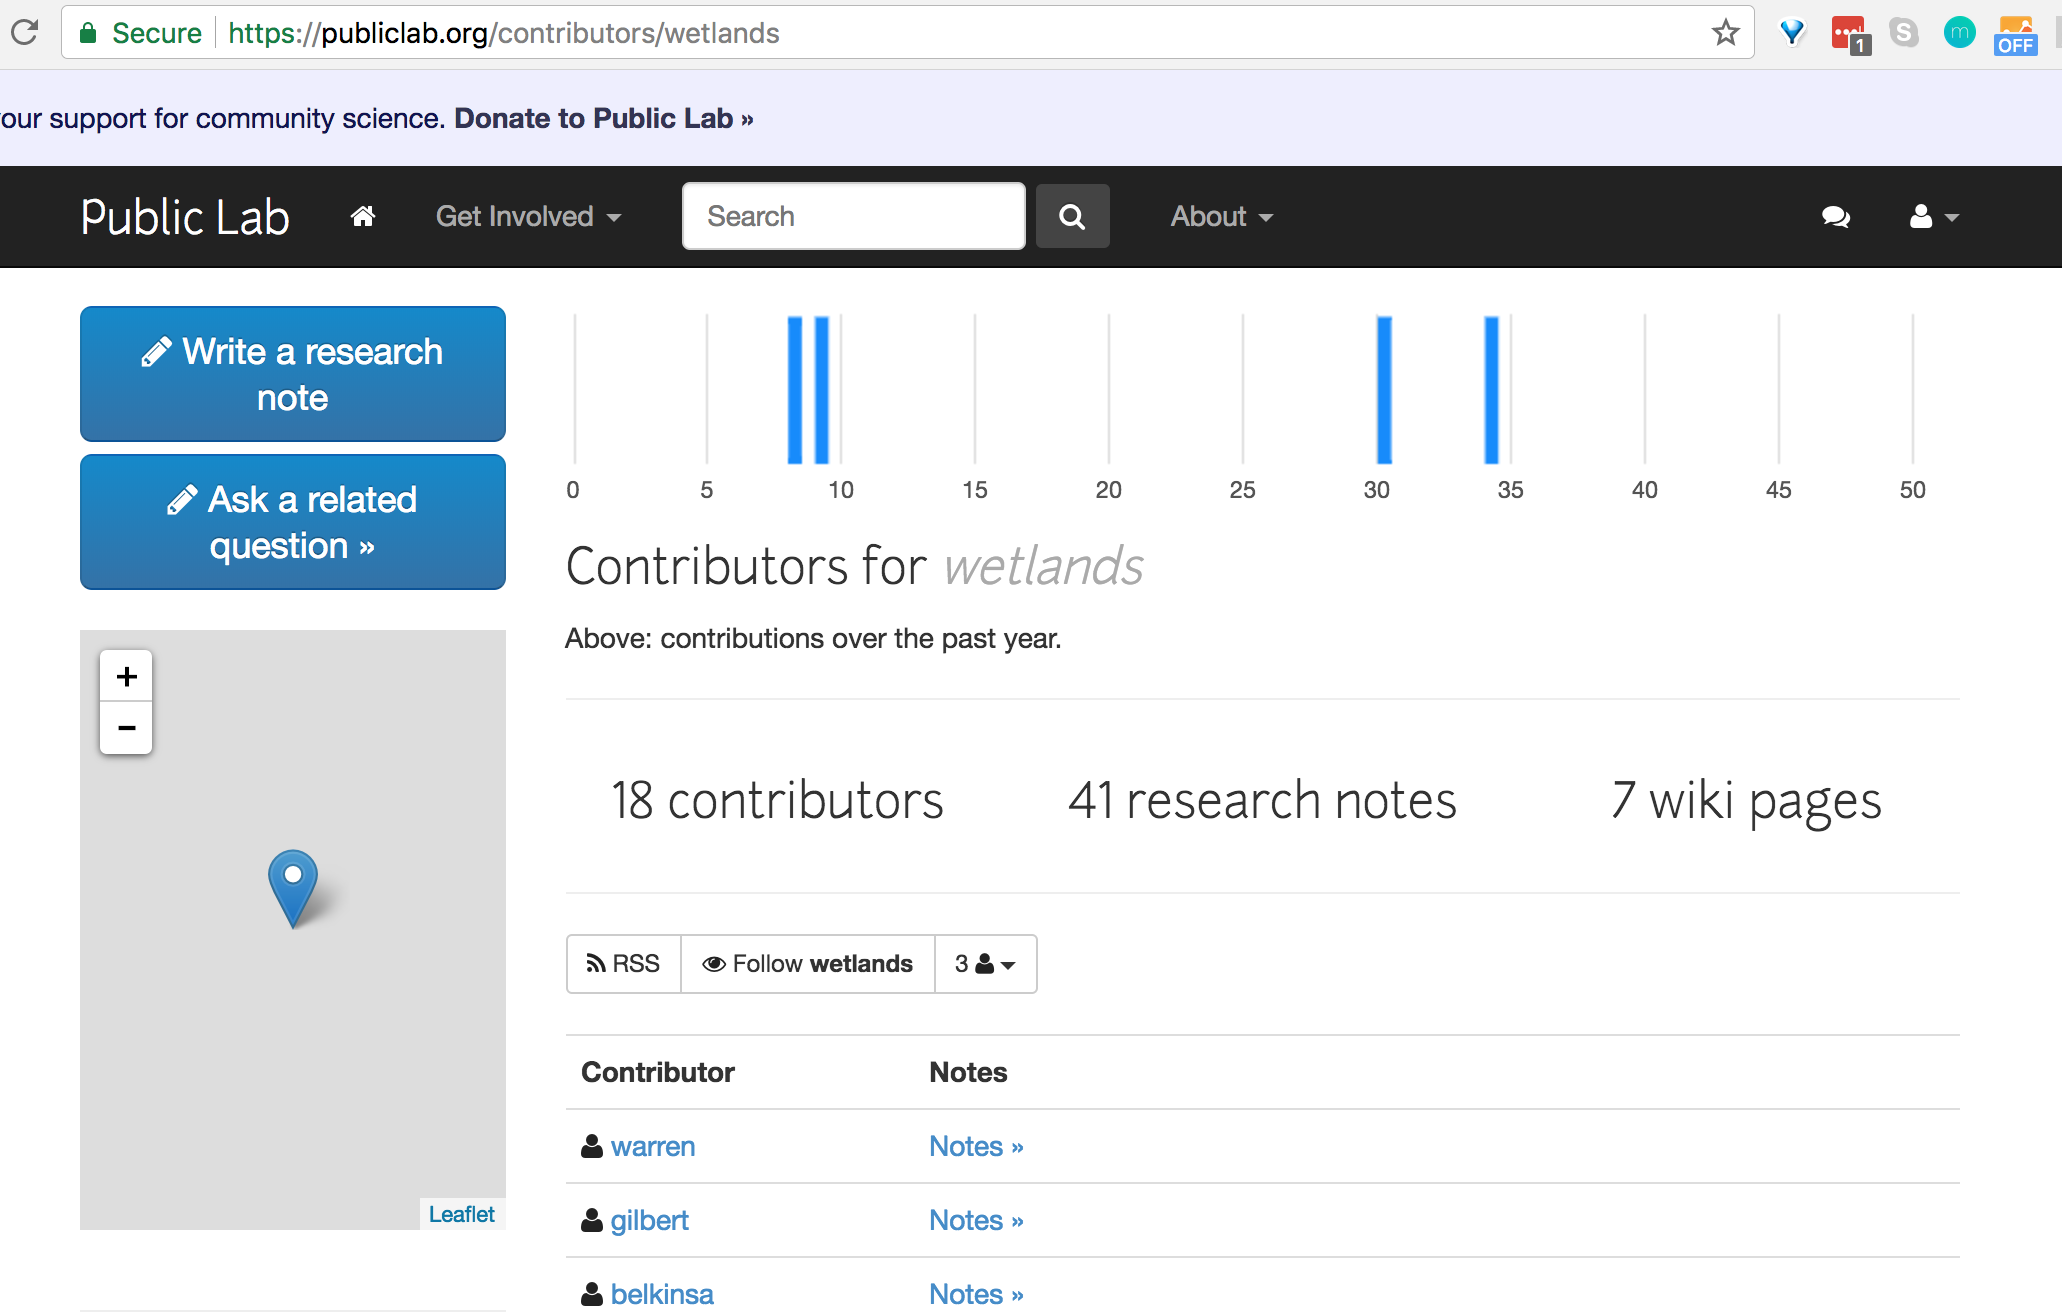
- views for contributors by tag such as https://publiclab.org/contributors/wetlands
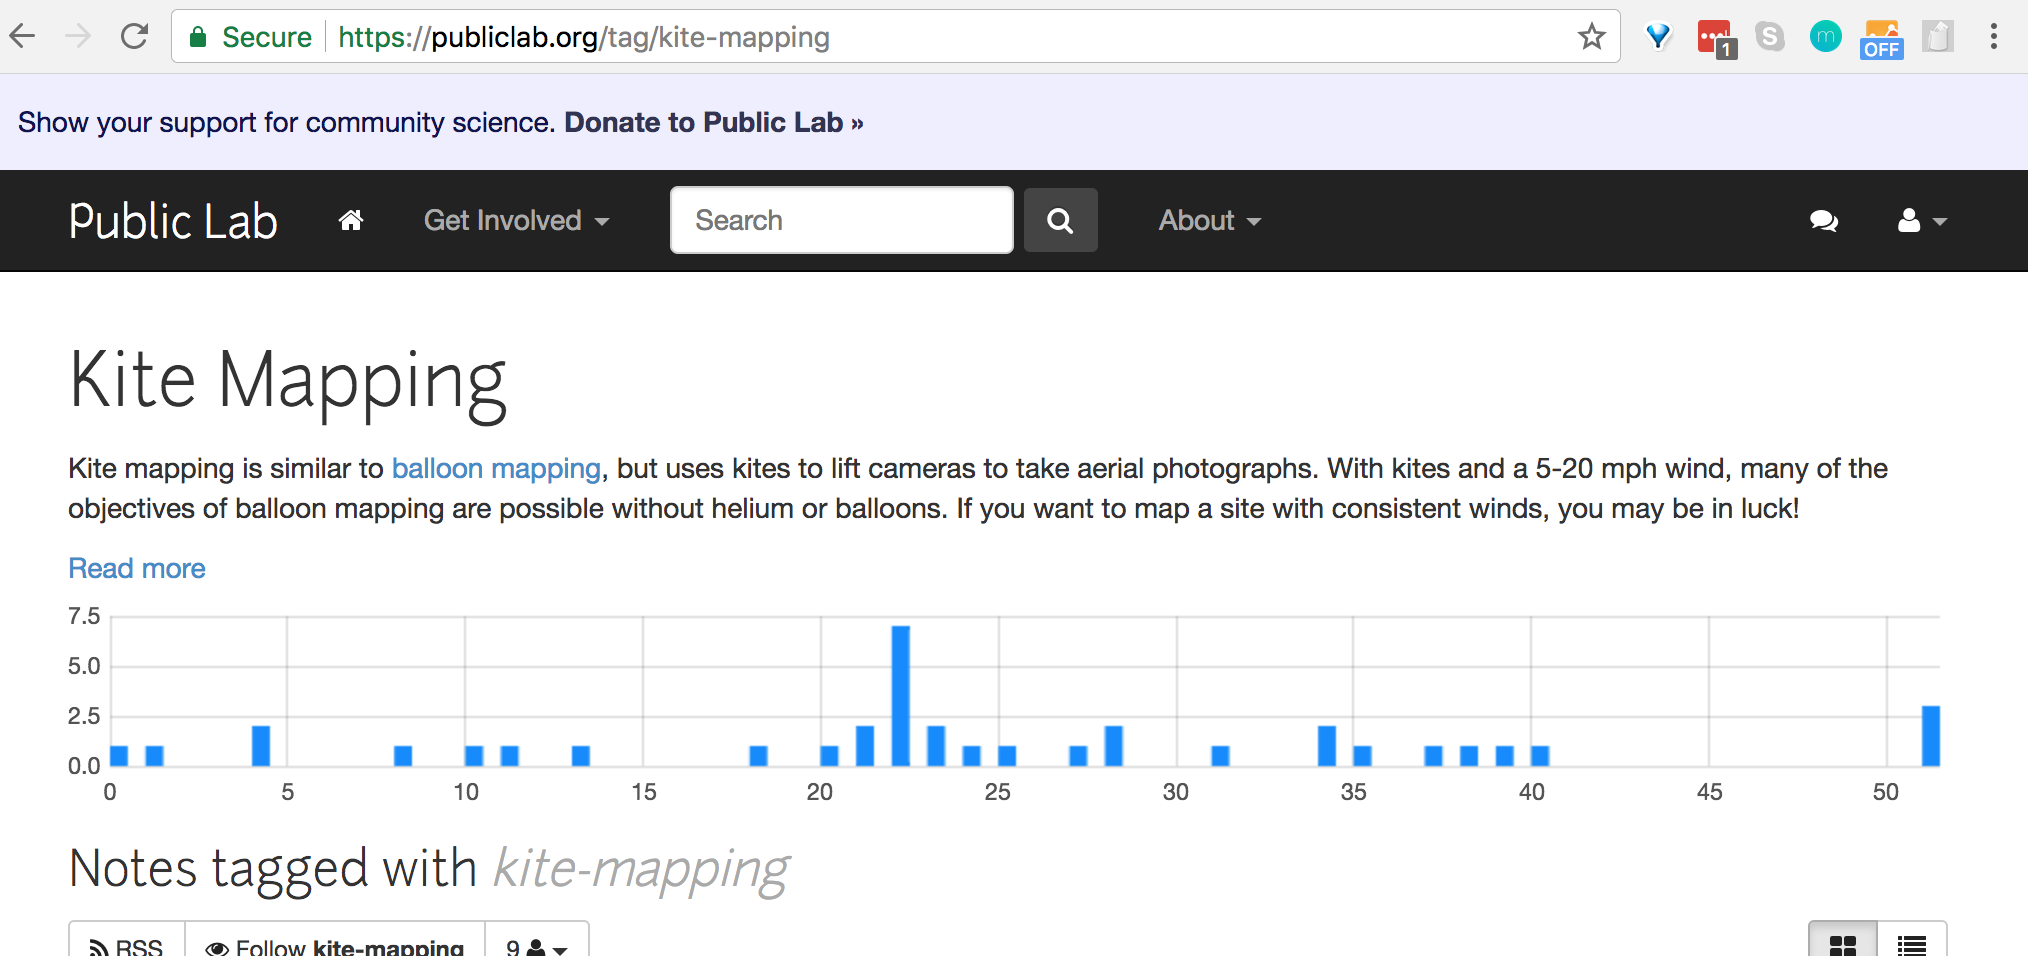
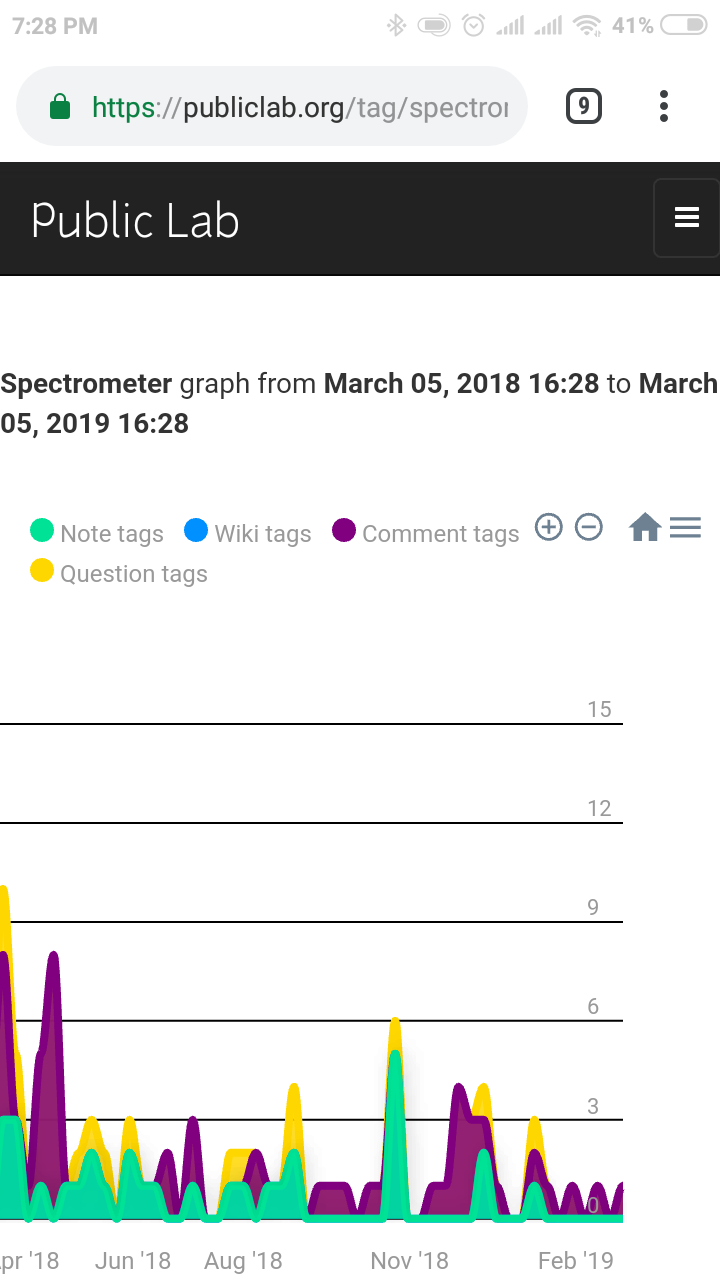
- https://publiclab.org/tag/kite-mapping
- individual profile pages: https://publiclab.org/people/liz
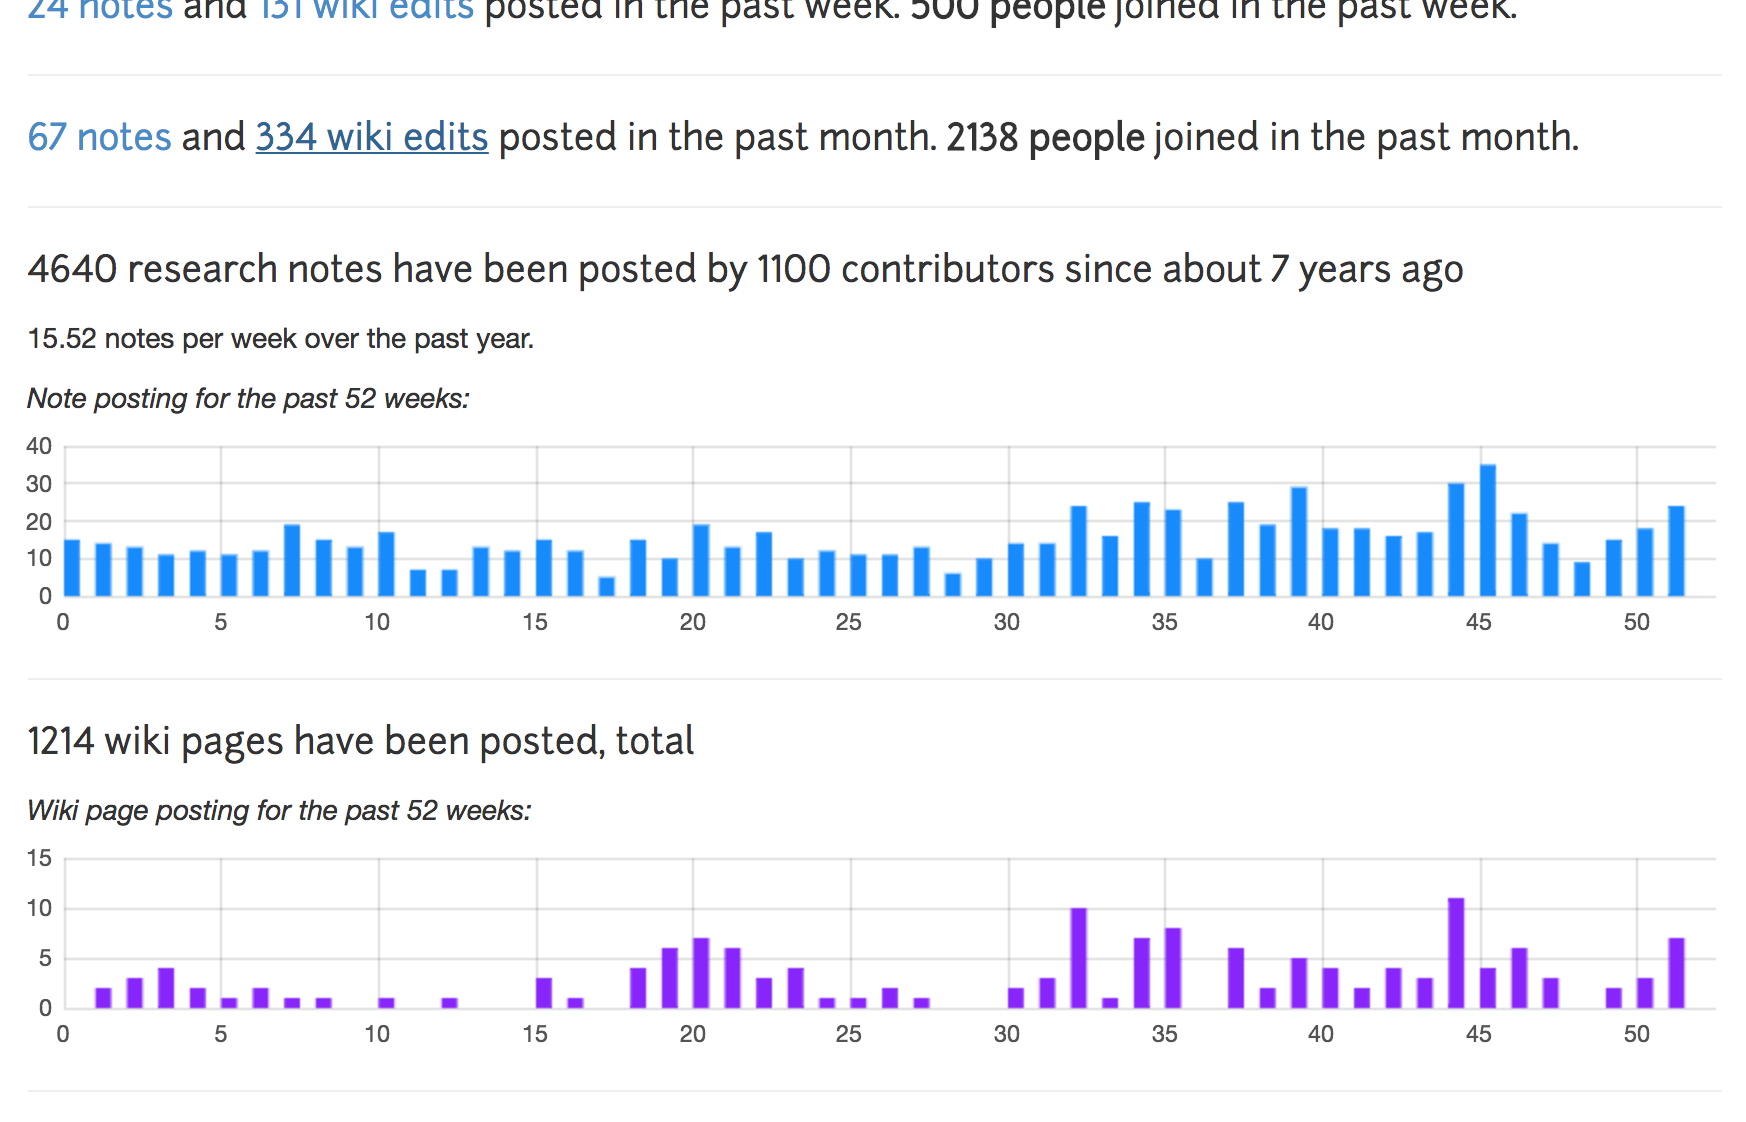
There are a lot of graphs on https://publiclab.org/stats:
There are a lot of graphs on https://publiclab.org/contributors:
....and views for contributors by tag such as https://publiclab.org/contributors/wetlands
You might arrive at the page above by beginning at a tag page, each of which has a graph, such as https://publiclab.org/tag/kite-mapping:
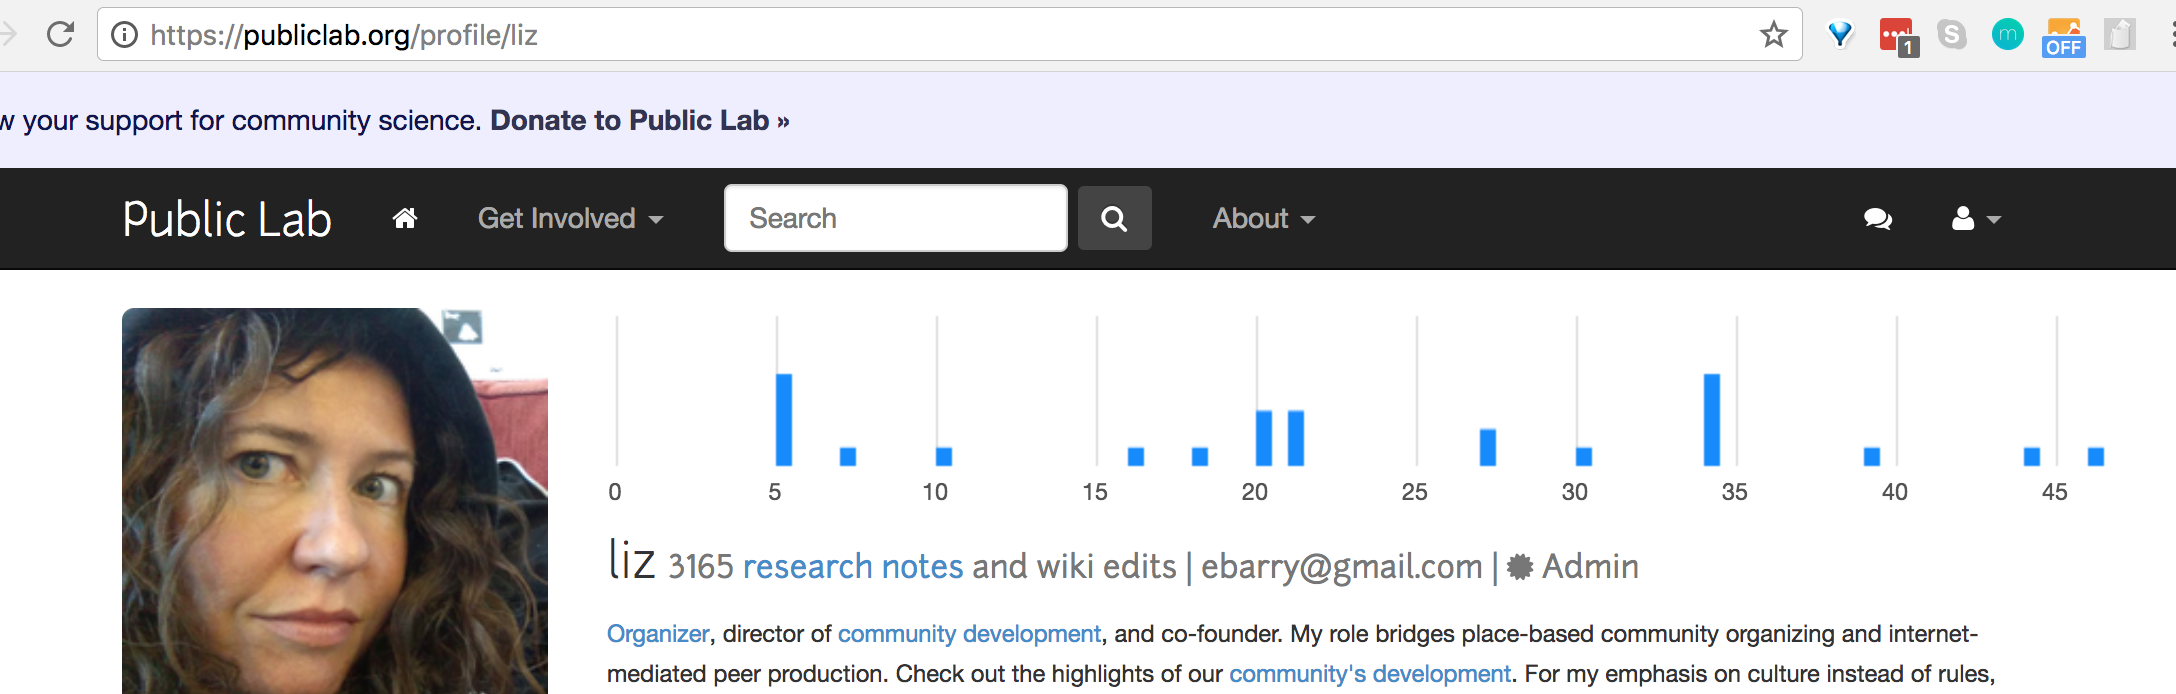
Each profile page has a graph, such as https://publiclab.org/people/liz:
There are probably other places where graphs appear. :D
 ebarry
All 11 comments
@ebarry See https://www.chartkick.com/ They have nice graphs. And they are also very easy to implement.
 namangupta01
on 22 Jan 2018
namangupta01
on 22 Jan 2018
https://plot.ly/javascript/line-charts/ they also have a nice interface and their graphs satisfy many ideas which you want @ebarry.
 grvsachdeva
on 22 Jan 2018
grvsachdeva
on 22 Jan 2018
Just pining in that this one seems related to issue #529 https://github.com/publiclab/plots2/issues/529
 steviepubliclab
on 23 Jan 2018
steviepubliclab
on 23 Jan 2018
https://frappe.github.io/charts/ is really nice and has several github type charts!
 jywarren
on 11 Feb 2018
jywarren
on 11 Feb 2018
@jywarren I want to work on this
 Souravirus
on 15 Feb 2018
Souravirus
on 15 Feb 2018
Yes, let's start with profile pages, what do you think?
jywarren
on 15 Feb 2018
Yeah I have started working on it
Souravirus
on 16 Feb 2018
@jywarren I'd be interested in this one!
 ViditChitkara
on 1 Aug 2018
ViditChitkara
on 1 Aug 2018
that'd be great!
On Wed, Aug 1, 2018 at 12:30 PM Vidit notifications@github.com wrote:
@jywarren https://github.com/jywarren I'd be interested in this one!
—
You are receiving this because you were mentioned.
Reply to this email directly, view it on GitHub
https://github.com/publiclab/plots2/issues/2068#issuecomment-409636178,
or mute the thread
https://github.com/notifications/unsubscribe-auth/AABfJ__dI9scNkM5xDR2rrhgYR3Cv2i9ks5uMdeHgaJpZM4RoeDd
.
jywarren
on 1 Aug 2018
Hello @ebarry , did you get a chance to look at the new graphs? If so kindly update on changes you would like to be made. Also I was testing the new graphs on mobile earlier today this is how they look.
Thanks
 cesswairimu
on 5 Mar 2019
cesswairimu
on 5 Mar 2019
Closing this!!!!
jywarren
on 7 May 2019
Related issues
 bronwen9
·
3Comments
bronwen9
·
3Comments
![first-timers[bot] picture](https://avatars.githubusercontent.com/in/4832?v=4&s=40) first-timers[bot]
·
3Comments
first-timers[bot]
·
3Comments
grvsachdeva
·
3Comments
jywarren
·
3Comments
first-timers[bot]
·
3Comments
first-timers[bot]
·
3Comments
grvsachdeva
·
3Comments
jywarren
·
3Comments
Most helpful comment
Yes, let's start with profile pages, what do you think?