Plots.jl: [FR] `legend = false` should not hide colorbar
Right now legend = false will also hide the colorbar, leading to the awkward legend = false, colorbar = true. I don't think we ever want the current behaviour. legend and colorbar should simply be separate IMHO
 mkborregaard
All 9 comments
At this point it has the default value colobar = :legend that copies the behavior of the legend. As per https://github.com/JuliaPlots/Plots.jl/blob/fff8f84acf62550f068810970e146e085264c9c5/src/arg_desc.jl#L107
I guess we should set the default value to be colorbar = :right should it be the case though?
 isentropic
on 4 Jun 2020
isentropic
on 4 Jun 2020
Personally, I think the current behavior is very much reasonable, I wonder what others think
isentropic
on 4 Jun 2020
The colorbar already has sensible defaults - it's being shown if you ask for it explicitly, if you have a heatmap or a surface, or if you have color encoding in a variable with line_z or marker_z. I don't see why legend should override those sensible defaults, to be honest.
mkborregaard
on 4 Jun 2020
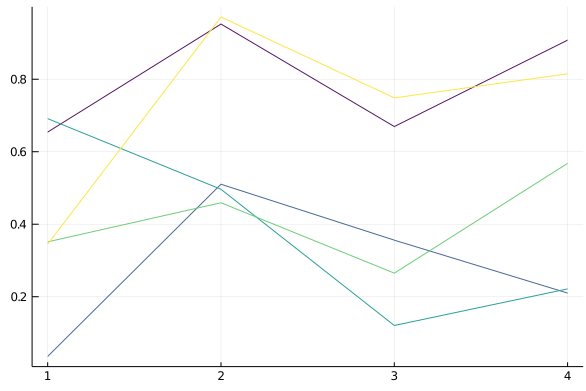
Consider this case:
plot(rand(4,5), line_z = (1:5)')
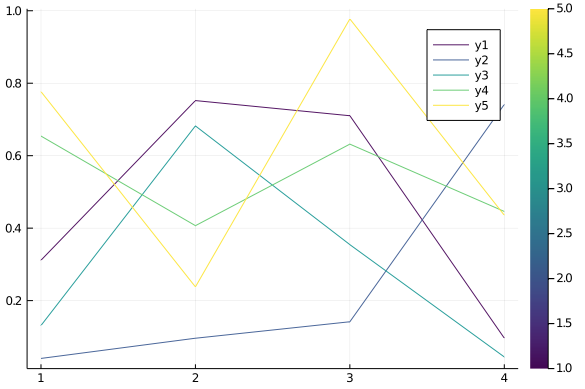
plot(rand(4,5), line_z = (1:5)', legend = false)
BTW I think maybe
┌ Warning: Multiple series with different color share a colorbar. Colorbar may not reflect all series correctly.
└ @ Plots ~/.julia/packages/Plots/JKY3H/src/backends/gr.jl:491
should have been an @info not a warning?
mkborregaard
on 4 Jun 2020
Good point, this is a very good example.
Additionally, would we want no legend if colorbar needs to be drawn?
That is, the default behaviour should be no legend in the presence of colorbar?
isentropic
on 4 Jun 2020
Additionally, would we want no legend if colorbar needs to be drawn?
That is, the default behaviour should be no legend in the presence of colorbar?
No, I don't think so. For heatmaps and contours legends are already suppressed automatically and for other cases (see Michael's first plot) it could make sense to have a legend. In that case I would leave removing the legend to the users.
 daschw
on 4 Jun 2020
daschw
on 4 Jun 2020
Agree with Daniel. The issue is also there with composite plots
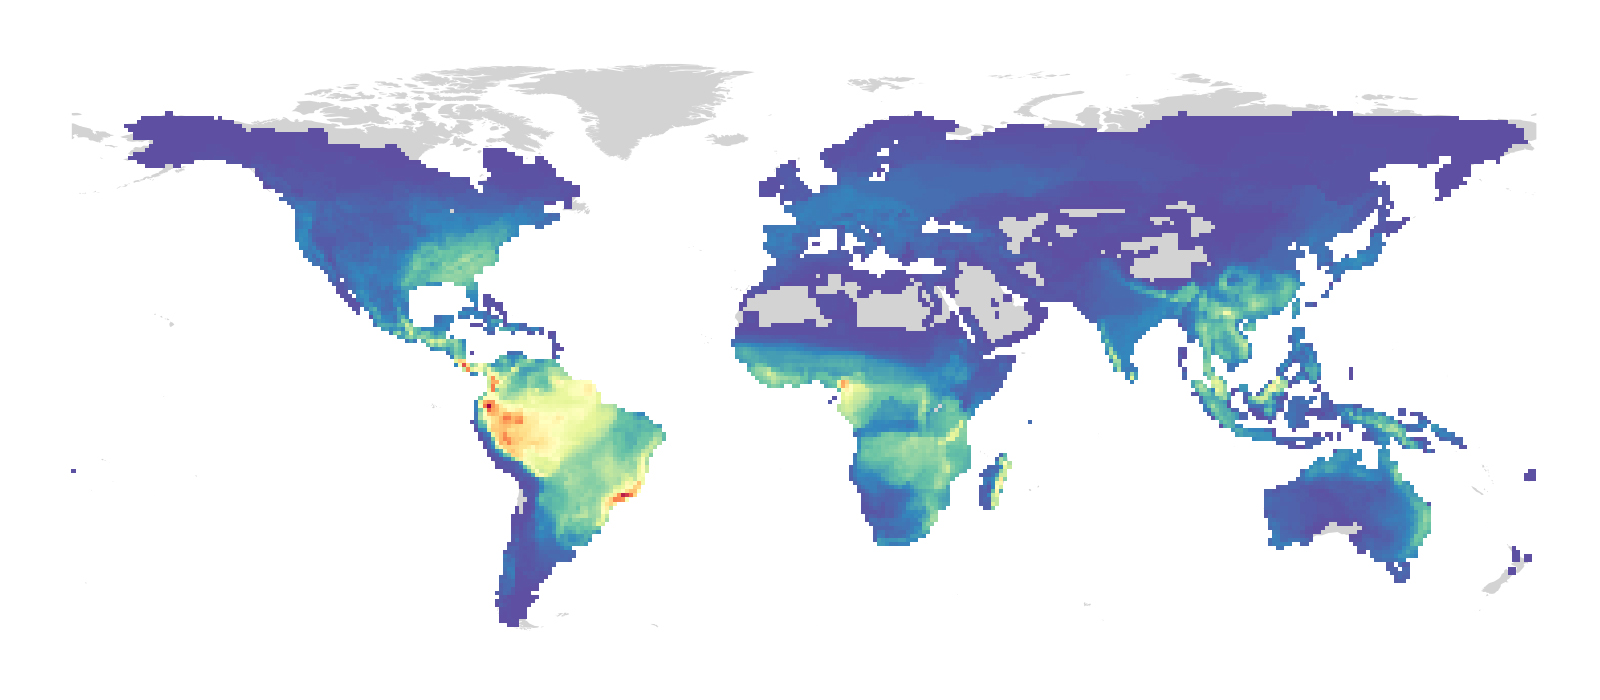
(e.g. if I want to combine a heatmap with a polygon such as in the below example), but that should also be solved by unlinking them.
mkborregaard
on 4 Jun 2020
Nice plot! What does it show?
daschw
on 4 Jun 2020
Species richness of the world's 6000 species of amphibians :-)
mkborregaard
on 4 Jun 2020
Related issues
 lstagner
·
5Comments
mkborregaard
·
3Comments
lstagner
·
5Comments
mkborregaard
·
3Comments
 pkofod
·
3Comments
pkofod
·
3Comments
 nebuta
·
3Comments
nebuta
·
3Comments
 asinghvi17
·
3Comments
asinghvi17
·
3Comments