Plots.jl: GR: legend text out of legend box bounds if legend placed in an "outer" position
Details
I noticed that, using the GR backend, whenever i place the legend in the outer area of the figure (i.e. :outertopright, outerbottomright etc.) AND at the same time have my axes labelled, the font size of the legend text is larger than normal without the legend box size being porperly adjusted, causing the legend text to stick out of the box.
all good without axes labels:
scatter(rand(100), label = "some label", legend = :outertopright)
but after adding axes labels (notice larger legend font size):
scatter(rand(100), xlabel = "x", ylabel = "y", label = "some label", legend = :outertopright)
interestingly, after moving the legend inside the plot area:
scatter(rand(100), xlabel = "x", ylabel = "y", label = "some label", legend = :topright)
Backends
This bug occurs on ( insert x below )
Backend | yes | no | untested
-------------|-----|-----|---------
gr (default) | x | |
pyplot | | x |
plotly | | x |
plotlyjs | | x |
pgfplotsx | | | x
inspectdr | | | x
Versions
Plots.jl version: 1.2.0
Backend version: 0.48.0
Output of versioninfo():
Julia Version 1.4.1
Commit 381693d3df* (2020-04-14 17:20 UTC)
Platform Info:
OS: Windows (x86_64-w64-mingw32)
CPU: Intel(R) Core(TM) i7-6700 CPU @ 3.40GHz
WORD_SIZE: 64
LIBM: libopenlibm
LLVM: libLLVM-8.0.1 (ORCJIT, skylake)
Environment:
JULIA_EDITOR = "D:\Program Files\Work\atom\app-1.45.0\atom.exe" -a
JULIA_NUM_THREADS = 4
 nbsmokee
All 5 comments
Did it happen again?
using Plots
gr()

 AhmedSalih3d
on 3 Oct 2020
AhmedSalih3d
on 3 Oct 2020
@AhmedSalih3d thanks for reporting! Could you provide the code to reproduce the issue?
 daschw
on 3 Oct 2020
daschw
on 3 Oct 2020
Hello!
It was quite a peculiar problem since it would only occure in some cases. Say I used the same strings as I just showed you but did "plot(rand(50))" I was not able to reproduce the problem (EDIT: I was, x and y = rand(50)). Here is the code I used:
using Plots
gr()
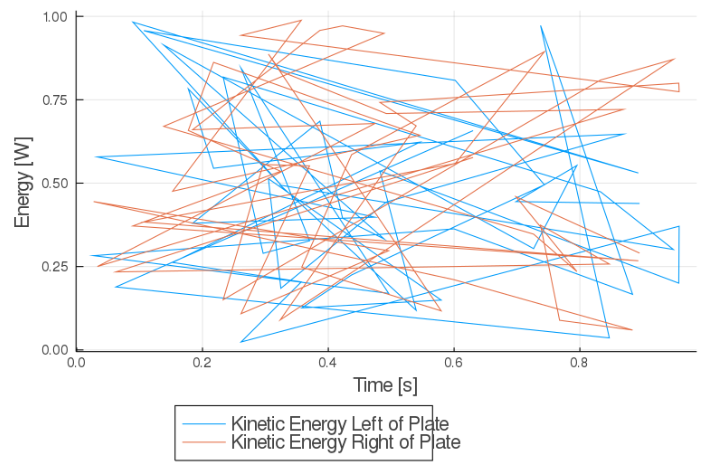
p1 = plot(legend=:outerbottom,foreground_color_legend = nothing,background_color_legend = nothing)
plot!(x,label="Kinetic Energy Left of Plate")
plot!(y,label="Kinetic Energy Right of Plate")
xlabel!("Time [s]")
ylabel!("Energy [W]")
title!("Kinetic Energy")
AhmedSalih3d
on 3 Oct 2020
Woops, my formatting is wrong and of course remove "foreground_color_legend" and same for background option.
Example here
AhmedSalih3d
on 3 Oct 2020
Thanks!
daschw
on 3 Oct 2020
Related issues
 tbreloff
·
75Comments
tbreloff
·
75Comments
 mkborregaard
·
35Comments
mkborregaard
·
35Comments
 diegozea
·
36Comments
mkborregaard
·
34Comments
diegozea
·
36Comments
mkborregaard
·
34Comments
 SimonDanisch
·
30Comments
SimonDanisch
·
30Comments