Plots.jl: Axis limits aligning with ticks
All 10 comments
I'm not sure this is a good idea in general. I think it is rather up to personal taste if that is an improvement or not.
I think you know that you can provide ticks and axis limits manually to ensure this.
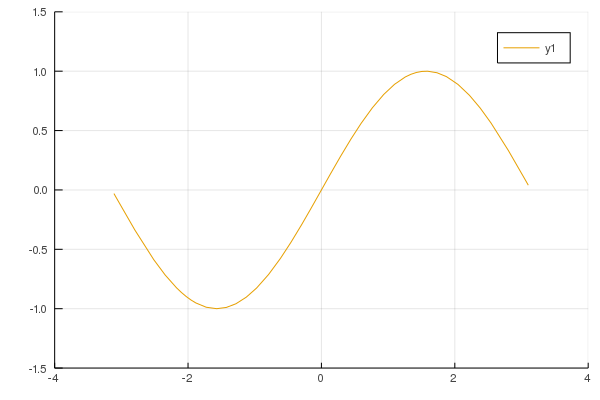
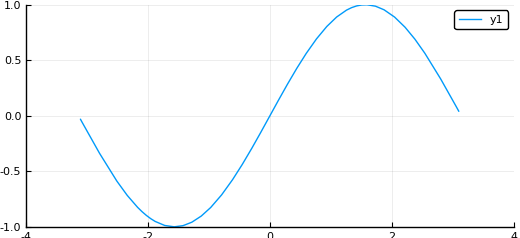
Alternatively you could also specifiy the number of desired ticks by passing an Int to ticks. In that case the axes limits always correspond to the last ticks:
plot(sin, -π, π, xticks = 5, yticks = 7)
 daschw
on 26 Aug 2019
daschw
on 26 Aug 2019
Interesting, I didn't know that. Considering that's already behaviour, would it be an idea to add a kwarg for it, or some kind of default placeholder like 0 or -1? My plot axis ticks and limits depend on the data being displayed.
 aahaselgrove
on 26 Aug 2019
aahaselgrove
on 26 Aug 2019
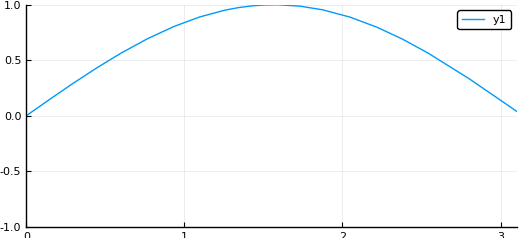
Also try
plot(sin, -π, π, lims=:round)
This will expand the axis limits to round values and the tick values will be calculated from these limits
 wfrgra
on 7 Oct 2019
wfrgra
on 7 Oct 2019
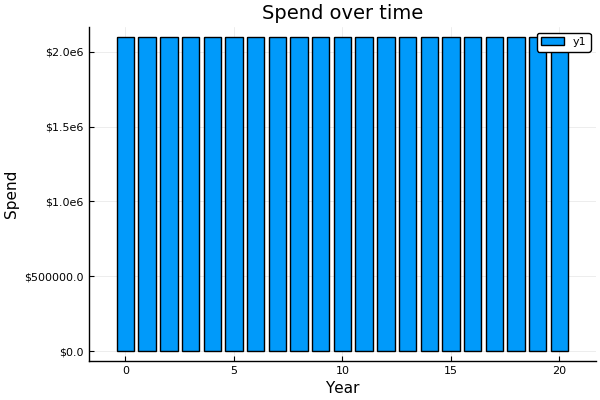
@wfrgra that seems to work to some extent, but possibly not for all magnitudes?
Eg.
````
using Plots
pyplot()
time = 0:20
spend = fill(2.19e6, 21)
bar(time, spend,
title="Spend over time",
xlabel="Year",
ylabel="Spend",
yformatter=y->"$$y",
lims=:round)
````
aahaselgrove
on 7 Oct 2019
You're missing lims=:round from your command there
wfrgra
on 7 Oct 2019
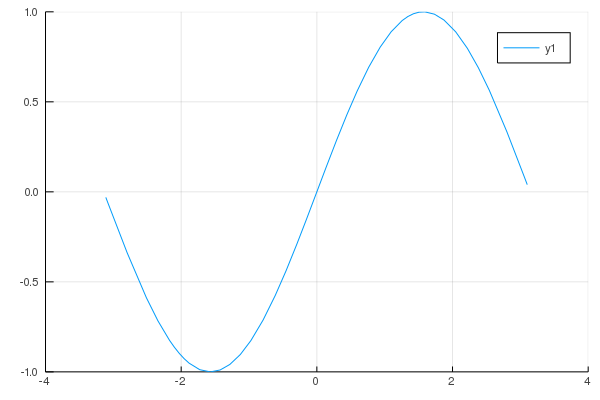
Not sure what's going on there then. I don't have pyplot installed, but the limits are set independently of the backend so it shouldn't affect anything. With GR and your code above I get:
wfrgra
on 7 Oct 2019
My mistake. I have other plots which it doesn’t quite seem to be working for, trying to reproduce.
aahaselgrove
on 7 Oct 2019
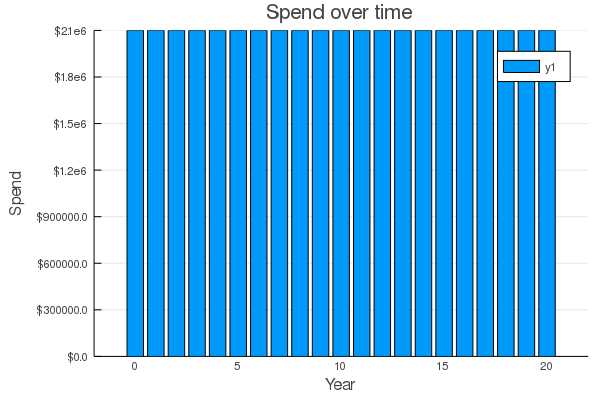
I've updated the example and believe it now demonstrates the issue.
aahaselgrove
on 7 Oct 2019
Also, feature request: specify :round for one limit and a value for the other. Currently I believe you can only get one or the other:
plot(sin, -π, π, xlims=(0, Inf), lims=:round)
plot(sin, -π, π, lims=:round, xlims=(0, Inf))
plot(sin, -π, π, xlims=(0, :round))
Error showing value of type Plots.Plot{Plots.PyPlotBackend}:
ERROR: MethodError: no method matching isfinite(::Symbol)
...
aahaselgrove
on 7 Oct 2019
You're right, the axis doesn't always round to a number that the tick generating algorithm likes. I'll have a go at improving the match and see about allowing an override of one limit
wfrgra
on 8 Oct 2019
Related issues
 SimonDanisch
·
30Comments
SimonDanisch
·
30Comments
 ChrisRackauckas
·
46Comments
ChrisRackauckas
·
46Comments
 juliohm
·
29Comments
juliohm
·
29Comments
 Godisemo
·
32Comments
Godisemo
·
32Comments
 rolfdstoll
·
36Comments
rolfdstoll
·
36Comments
Most helpful comment
I'm not sure this is a good idea in general. I think it is rather up to personal taste if that is an improvement or not.
I think you know that you can provide ticks and axis limits manually to ensure this.
Alternatively you could also specifiy the number of desired ticks by passing an
Intto ticks. In that case the axes limits always correspond to the last ticks: