Plots.jl: Plots slows down entire Jupyter notebook
I have 4 files that I load with readdlm, each about 5~6KB each. When I plot them using Plots (they plot successfully), it slows down the entire notebook. I can basically edit cells for 3 lines (exactly) just fine, and then any more lines are incredibly laggy. Has anyone else experienced this as well? I thought the problem might be readdlm, since that has some issues but only with very large data. My files are not that big and running a cell only loading the data works just fine. Additionally, plotting very simple things also don't cause much of a problem:
x = collect(0:0.01:2*pi)
y = sin.(x)
plot(x,y)
This doesn't cause any problems. So is it a problem of Plots struggling with larger data?
 Bebotron
All 22 comments
Does it help if you add default(fmt = :png) after using Plots?
 daschw
on 26 Jul 2019
daschw
on 26 Jul 2019
How interesting, it does fix the problem. However, I am using a dark theme on jupyter, and so I've been using theme(:juno). So if I do this:
using Plots
using PlotThemes
theme(:juno)
default(fmt = :png)
And this will fix any lag, but will now make the plot axes and labels dark, which makes them hard to read with the dark background. So if I switch the order around to:
using Plots
using PlotThemes
default(fmt = :png)
theme(:juno)
And now the axes coloring is correct, but the lag is still there. Might there be something in the juno theme that is setting the default formatting?
Bebotron
on 26 Jul 2019
theme(:juno, fmt = :png)?
daschw
on 26 Jul 2019
No that still makes the axes and labeling dark. I'm trying to find the theme files and see if there's something obvious there.
Bebotron
on 26 Jul 2019
Hm the issue here seems to be that setting a fontcolor does not work for GR:
plot(rand(10), xguide = "Hello", tickfontcolor = :blue, guidefontcolor = :blue)
daschw
on 26 Jul 2019
Yes, setting fmt = :png within the juno.jl specifications gives dark axes.
Bebotron
on 26 Jul 2019
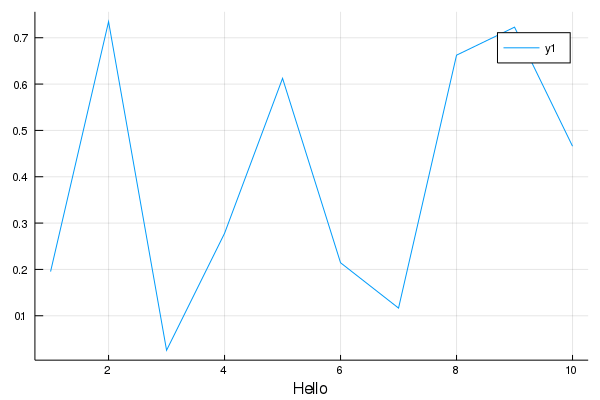
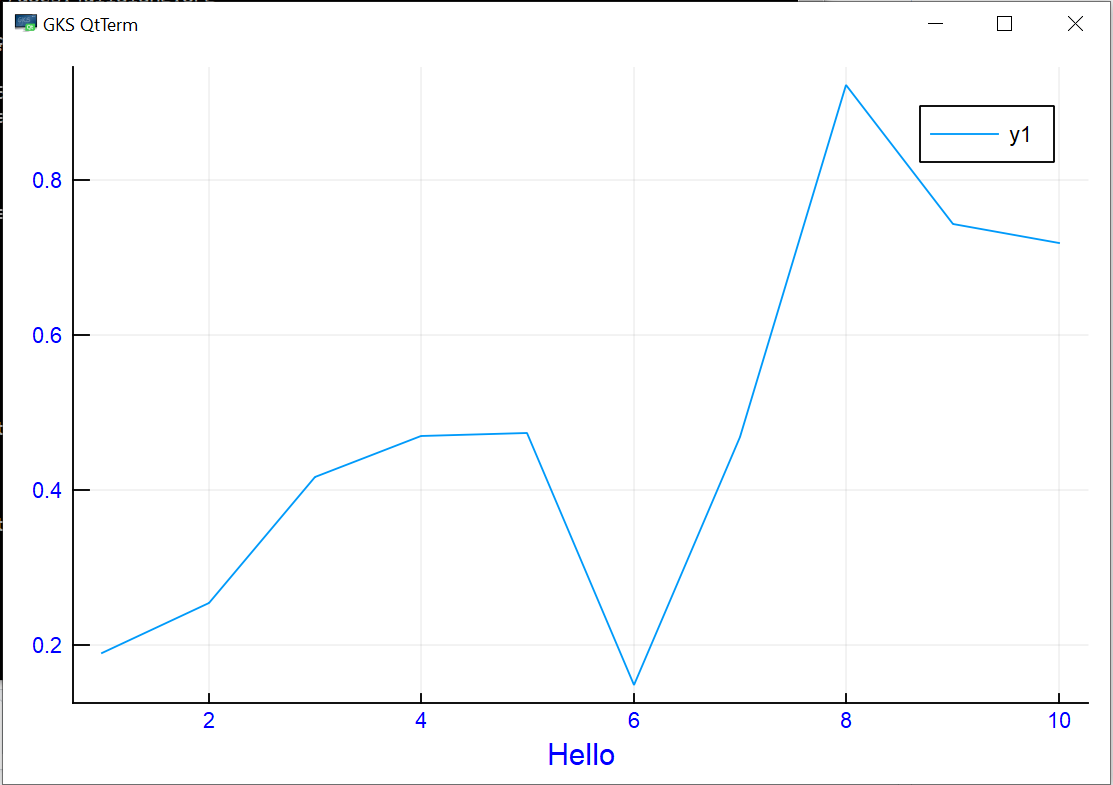
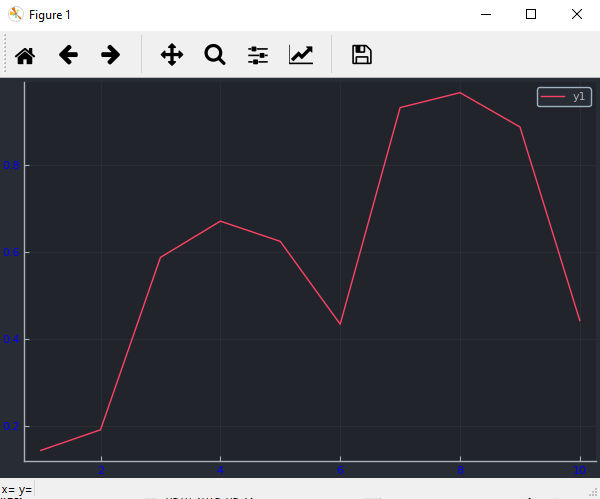
When I plot from the REPL setting the font color works:
plot(rand(10), xguide = "Hello", tickfontcolor = :blue, guidefontcolor = :blue)
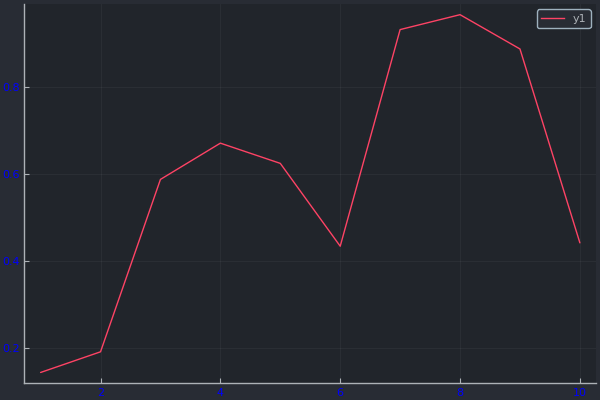
When I save this plot as PNG I get
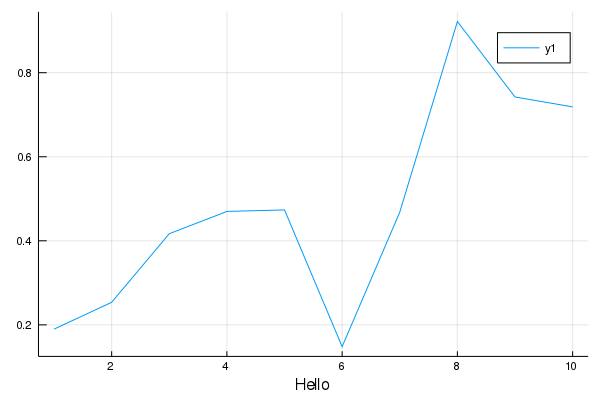
That's why setting fmt = :png messes up the theme in GR.
cc: @jheinen any ideas?
daschw
on 27 Jul 2019
Using the pyplot backend works just fine. So in case someone just needs a work-around, just do
using Plots
using PlotThemes
theme(:juno)
pyplot()
It would be nice if this issue could be fixed for Plots, but for now this is something anyone else who might be experiencing this could use.
Bebotron
on 27 Jul 2019
Saving as SVG should also work, but leads to the original lagging issue in jupyter for plots with a lot of data.
daschw
on 27 Jul 2019
The color problem can (hopefully) be fixed - the SVG problem probably not. What does "a lot of data" mean (MWE)? Plotting millions of points makes only sense when using GR's shading routines.
 jheinen
on 27 Jul 2019
jheinen
on 27 Jul 2019
In my particular case, I only have 200,000 data points to plot, which definitely isn't much. I don't know at which specific point the plotting starts lagging the entire notebook, but my particular problem can be emulated with the following:
using Plots
x = collect(0:1e-4:20)
y = sin.(x)
plot(x, y)
After generating this plot, the entire notebook is laggy.
Bebotron
on 27 Jul 2019
In this case, you should set gr(fmt=:png). Most browsers can't handle such point arrays in SVG.
jheinen
on 27 Jul 2019
Yes, and like we discuss above this fixes the lagging issue, but then the axes coloring doesn't work (remains black).
Bebotron
on 28 Jul 2019
The color problem can (hopefully) be fixed
The color problem is in GR, not in Plots, right @jheinen ?
daschw
on 1 Aug 2019
I get the same results for pyplot() and gr(fmt=:png). Am I missing something?
jheinen
on 1 Aug 2019
using Plots
theme(:juno, tickfontcolor = :blue, fmt = :png)
PyPlot
As shown when plotted from the REPL:
As saved with png(...):
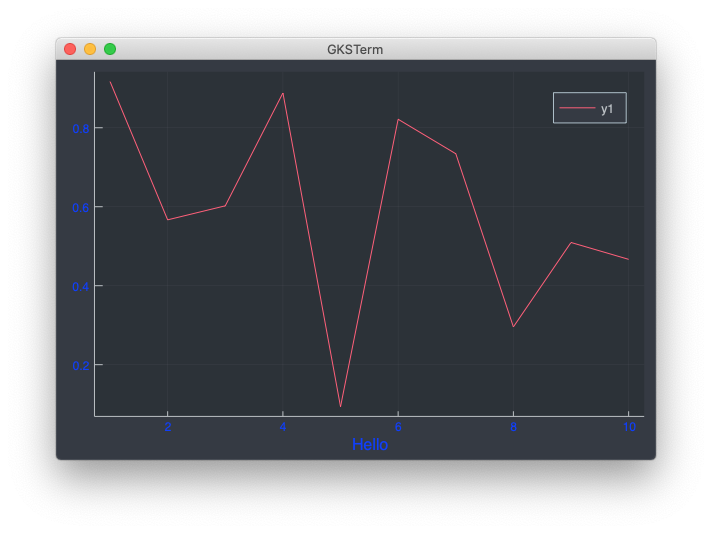
GR
As shown when plotted from the REPL:
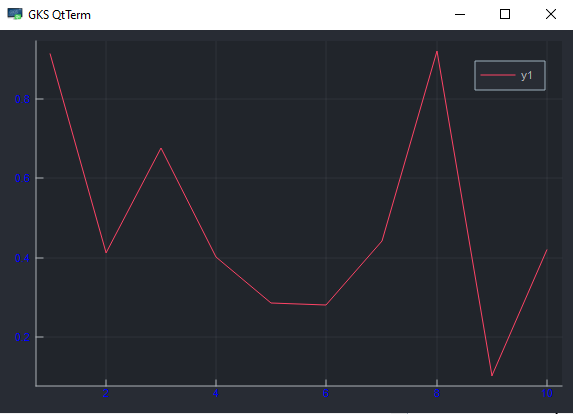
As saved with png(...):
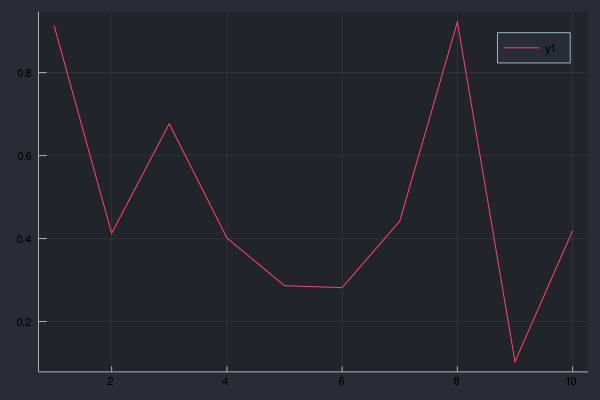
Note the tick and legend font colors in the last image.
daschw
on 1 Aug 2019
Strange - that's exactly what i did and which leads to this PNG:
jheinen
on 1 Aug 2019
    Status `/usr/local/lib/julia/environments/v1.1/Project.toml`
  [53c48c17] FixedPointNumbers v0.5.3
  [28b8d3ca] GR v0.41.0 #master (https://github.com/jheinen/GR.jl.git)
  [77ba4419] NaNMath v0.3.2
  [ccf2f8ad] PlotThemes v0.3.0
  [995b91a9] PlotUtils v0.5.8+ #master (https://github.com/JuliaPlots/PlotUtils.jl.git)
  [91a5bcdd] Plots v0.26.0 #master (https://github.com/JuliaPlots/Plots.jl.git)
  [3cdcf5f2] RecipesBase v0.7.0 #master (https://github.com/JuliaPlots/RecipesBase.jl.git)
  [992d4aef] Showoff v0.3.1 #master (https://github.com/JuliaGraphics/Showoff.jl.git)
  [2913bbd2] StatsBase v0.31.0
I also tried on Ubuntu 18.04 - same result. I can't reproduce the problem ...
jheinen
on 1 Aug 2019
I just updated my packages
]up
ENV["GRDIR"] = GR
]build GR
and now the colors work for me too.
fmt = :png also works correctly in IJulia for me now.
Sorry for the noise @jheinen!
@Bebotron If updating and rebuilding GR does not fix the issue for you feel free to reopen.
That large (many data points) svgs slow down the browser is an issue that will not be fixed here.
daschw
on 1 Aug 2019
So I ran using Pkg; Pkg.update(); and now I'm getting the error
error compiling _plot!: error compiling _display: could not load library "libGR.dll"
The specified module could not be found.
I don't think I should reopen the issue since this seems like a completely different problem and technically my original problem was solved using the pyplot() backend. This was part of the output after I updated
 Installed DataAPI ─────────── v1.0.0
 Installed FixedPointNumbers ─ v0.6.1
 Installed FFMPEG ──────────── v0.2.2
 Installed IJulia ──────────── v1.19.0
 Installed Plots ───────────── v0.26.0
 Installed IterTools ───────── v1.2.0
 Installed StatsBase ───────── v0.32.0
 Installed GR ──────────────── v0.41.0
 Installed GeometryTypes ───── v0.7.5
am I missing something? I can go ahead a look this up outside of this thread if it seems like too much of a digression. Thanks for all the help!
Bebotron
on 6 Aug 2019
Sorry @jheinen I just saw your solution here https://github.com/JuliaPlots/Plots.jl/issues/1720. Everything works now! Thanks guys!
Bebotron
on 6 Aug 2019
Related issues
 PaulSoderlind
·
40Comments
PaulSoderlind
·
40Comments
 SimonDanisch
·
30Comments
SimonDanisch
·
30Comments
 floswald
·
53Comments
floswald
·
53Comments
 tbreloff
·
46Comments
tbreloff
·
46Comments
 mauro3
·
46Comments
mauro3
·
46Comments