Plots.jl: Different transparency for markers face and edge
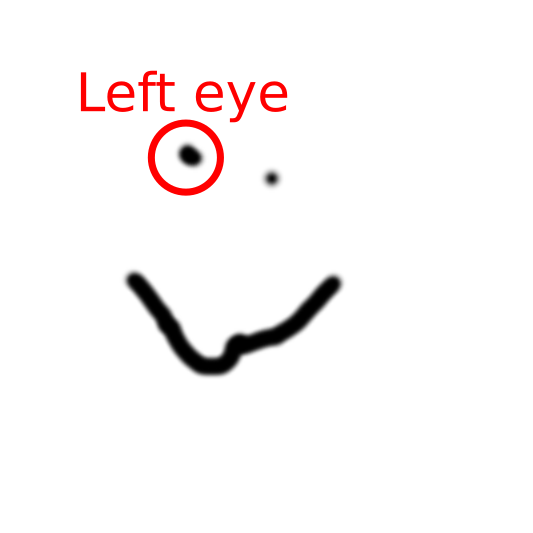
I want to highlight something in an existing plot by circling it and annotating that. Something like this:
I tried to just add a marker with a transparent face-color with this (under a gr backend):
plot(rand(RGB, 10, 10))
scatter!(9*rand(10) + 1, leg=false, marker = (20, 0.0, stroke(3, 1.0, :black)))
But this doesn't work on the rendered window nor on the saved png.
 yakir12
All 5 comments
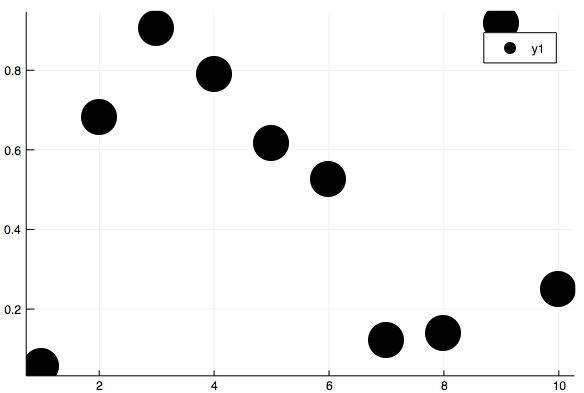
Yes, it looks like the markerstroke values override the marker values:
scatter(rand(10), markeralpha = 0.2, ms = 20)

scatter(rand(10), markeralpha = 0.2, ms = 20, markerstrokealpha = 1)
 mkborregaard
on 3 Apr 2018
mkborregaard
on 3 Apr 2018
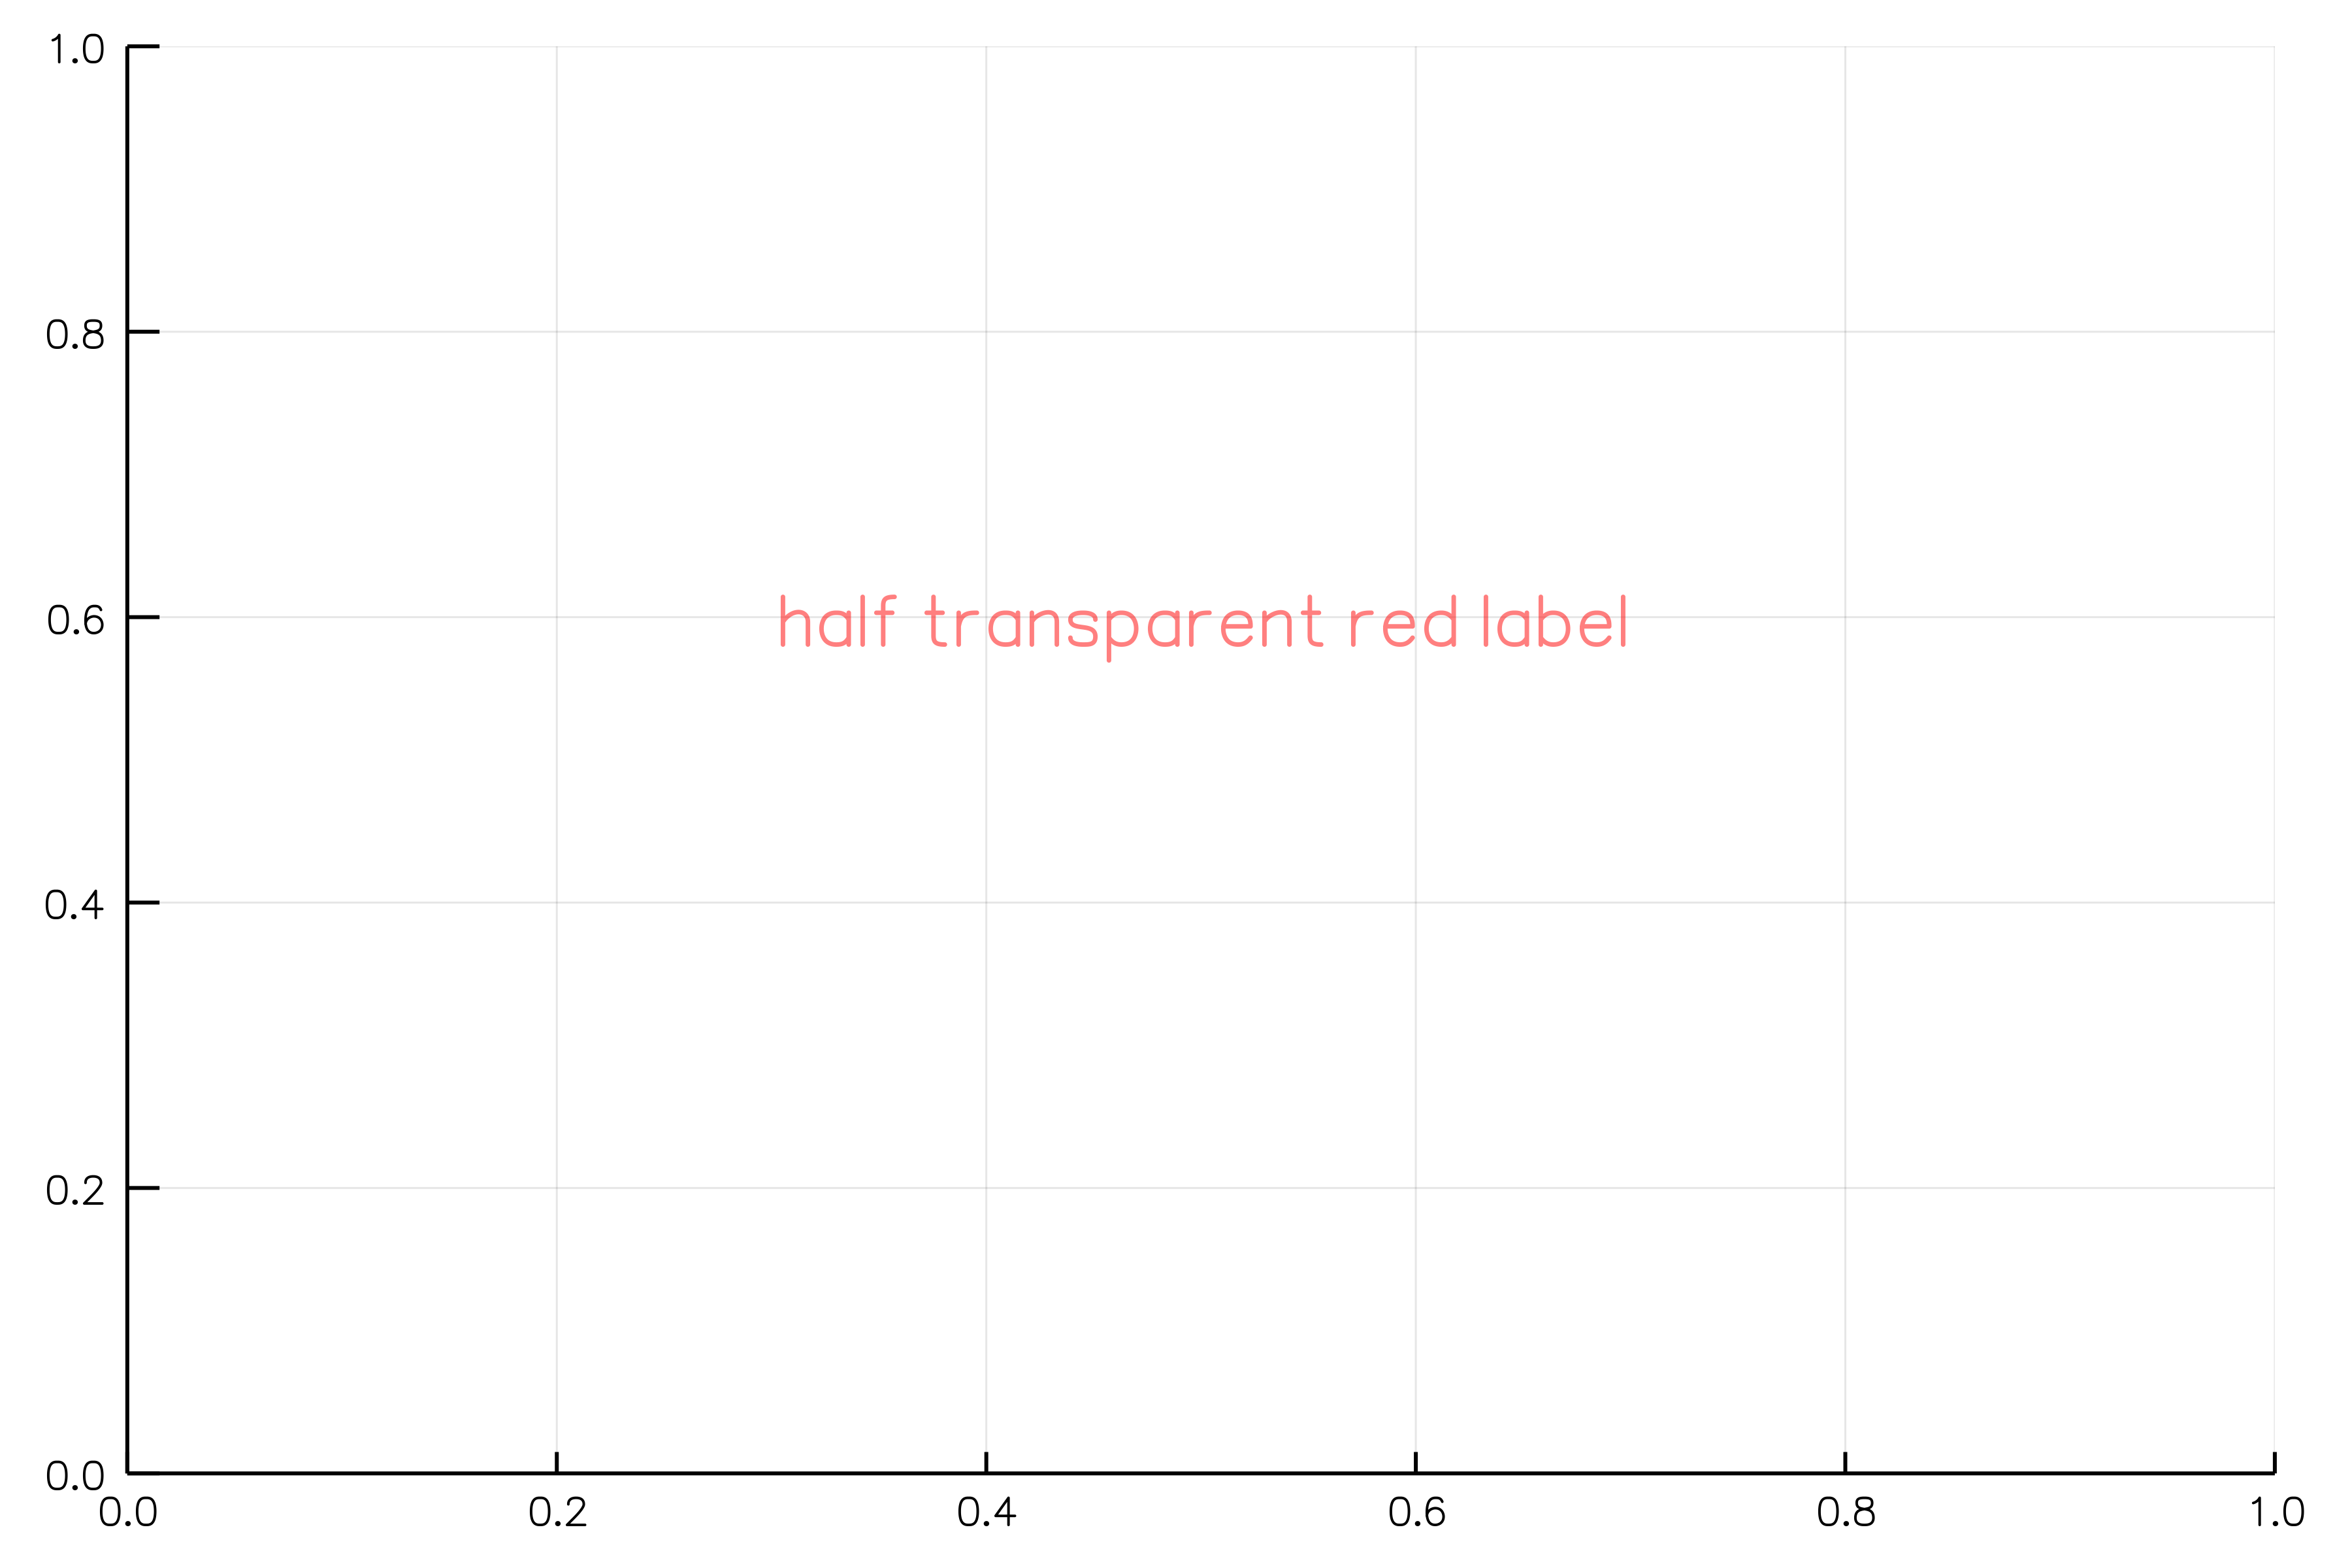
Just a hopefully helpful note to anyone stumbling here, using an RGBA works for the annotations:
annotate!(x, y, text("half transparent red label", RGBA(1,0,0, 0.5)))
yakir12
on 5 Apr 2018
The problem (at least) for GR is that in the backend code in order to get a stroke, at first a slightly bigger marker with the :markerstroke color attributes is drawn and then on top the interior with the :markercolor attributes is drawn. Hence, if you reduce :markeralpha, the :markerstrokecolor shines through.
I have not yet found a workaround for this. The only thing I can think of for now is replacing all the markers with Plots.Shapes.
 daschw
on 9 Apr 2018
daschw
on 9 Apr 2018
Ugh, that's unfortunate. Replacing markers with Shapes is likely to really slow down plotting.
mkborregaard
on 10 Apr 2018
Of course @yakir12 's original use case can be solved by plotting a circle shape. (e.g. plot(Plots.partialcircle(0, 2π, 100)) if the aspect ratio is 1).
mkborregaard
on 10 Apr 2018
Related issues
 tbreloff
·
45Comments
tbreloff
·
45Comments
 sverek
·
30Comments
sverek
·
30Comments
 mauro3
·
46Comments
mauro3
·
46Comments
 Godisemo
·
32Comments
Godisemo
·
32Comments
 SimonDanisch
·
30Comments
SimonDanisch
·
30Comments