Plots.jl: artifact on ribbon plots on GR
julia> using Plots
julia> plot(sin, ribbon = 0.1)
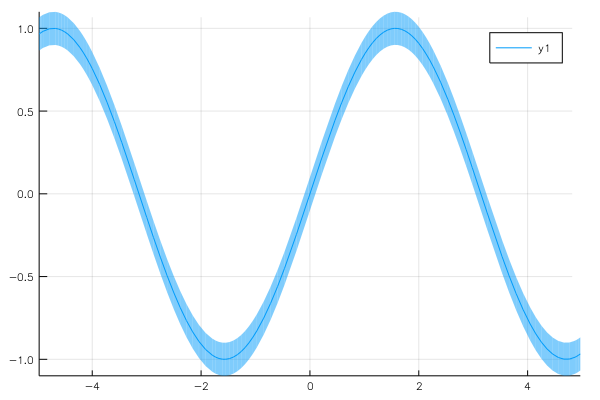
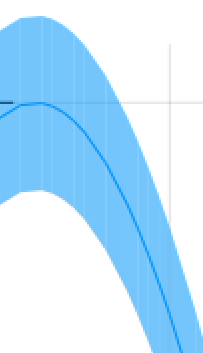
gives tiny white lines in the "ribbon" part. At some point it also happened that the plot line was "broken" but that was harder to reproduce. It seems that it's plotting every little chunk individually and they are not properly connected.
Here is a zoomed version:
I'm on Plots master and see this behavior both on GR release and master.
 piever
All 7 comments
That's probably related to the automatic choices of the x values:
x = linspace(-5, 5, 10000)
plot(x, sin.(x), ribbon = 0.1)
looks better.
 daschw
on 3 Oct 2017
daschw
on 3 Oct 2017
i'm pretty sure that this is a rendering artifact... Choosing different defaults just seems to hide it ;)
 SimonDanisch
on 3 Oct 2017
SimonDanisch
on 3 Oct 2017
I agree with @SimonDanisch : we can't expect the user to hide artefacts by choosing 10000 points on the x axis... Maybe it's better to ping @jheinen on this one, as I really don't know much about the details of the GR rendering system.
piever
on 3 Oct 2017
ok
daschw
on 3 Oct 2017
I have to check how ribbon plots are implemented (emulated) in Plots' GR backend ...
 jheinen
on 4 Oct 2017
jheinen
on 4 Oct 2017
@jheinen, I think, they are just fillranges, set for all backends in https://github.com/JuliaPlots/Plots.jl/blob/master/src/utils.jl#L483-L500
daschw
on 4 Oct 2017
@piever solved the issue! 🎉
It was caused by myself in #1110 (cf. #1139) and will be fixed by #1142.
daschw
on 8 Oct 2017
Related issues
 pkofod
·
3Comments
pkofod
·
3Comments
 kersulis
·
5Comments
kersulis
·
5Comments
 ereday
·
3Comments
ereday
·
3Comments
 nebuta
·
3Comments
nebuta
·
3Comments
 Krastanov
·
3Comments
Krastanov
·
3Comments