Plots.jl: How can I add the string like PM2.5 in gr() with 2.5 is the subscript ,ug m-3. -3 is Superscript
 nizhizhen
All 13 comments
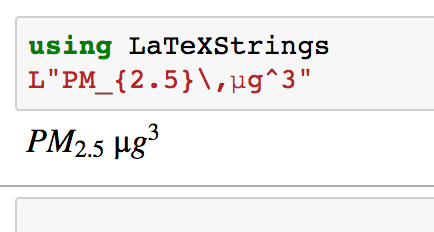
You use LaTeXStrings to define the latex-string, then pass that to the plot command where you need the text.
 mkborregaard
on 29 Aug 2017
mkborregaard
on 29 Aug 2017
nizhizhen
on 29 Aug 2017
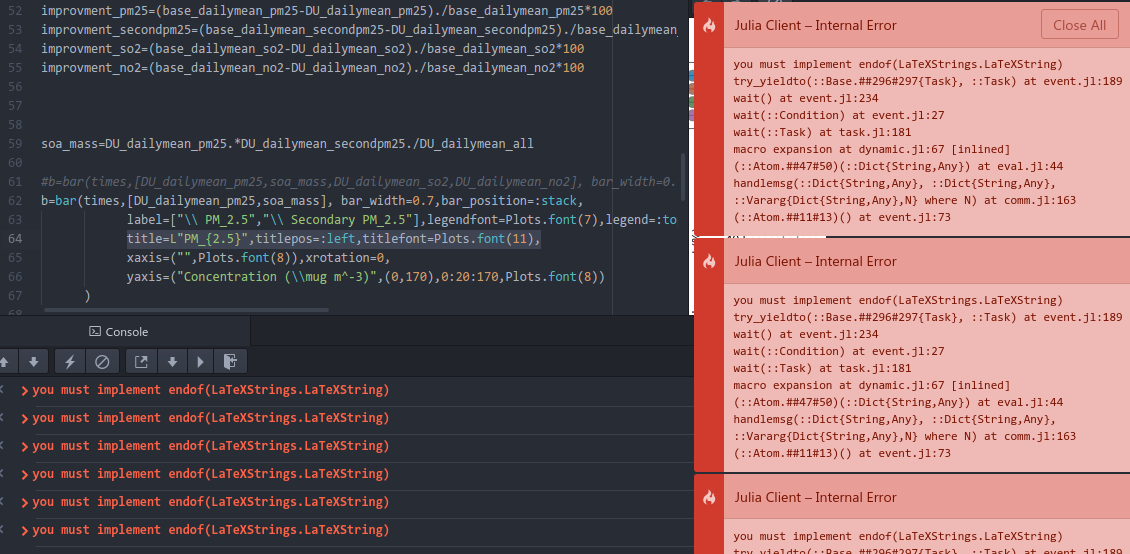
sir, thanks for your reply! But things still go wrong, you see why?
nizhizhen
on 29 Aug 2017
Hard to say – it doesn't look Plots-related.
Also, should the y-argument be a 1-row matrix rather than a vector?
mkborregaard
on 29 Aug 2017
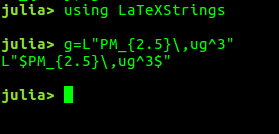
When I input g=L"sdfsa" then ,ouput :+1:
Error displaying LaTeXStrings.LaTeXString: you must implement endof(LaTeXStrings.LaTeXString)
this may something wrong with LaTeXStrings ? what should I do .
nizhizhen
on 29 Aug 2017
Well, your string to yaxis does not have an L in front.
mkborregaard
on 29 Aug 2017
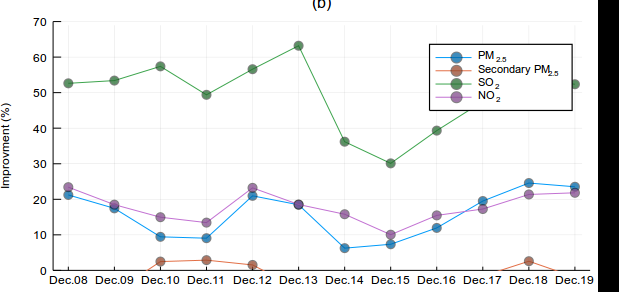
still error, I want the PM2.5 ,2.5 is the subscript . I give up . another help? the legend looks been masked , can I move it upper to close the top. or move out of the frames to the right.
nizhizhen
on 29 Aug 2017
Check this page https://juliaplots.github.io/attributes/ for all the keywords you can use to modify plots. The attribute for legend placement is called "legend". Also, you can use a Vector of Base.Dates for the x axis rather than passing a string, that will allow Plots to handle the ticks.
mkborregaard
on 29 Aug 2017
^_^,thanks a lot. I am a fish man , would you show me the detail codes about Base.Dates. e.g. legend=Dates(...) ?
nizhizhen
on 29 Aug 2017
About Dates, read this: https://docs.julialang.org/en/stable/manual/dates
You can simply pass a vector of Dates as x to Plots.
mkborregaard
on 29 Aug 2017
sir. I really can not understand the lower legend, how to move it more close to the top like 100 value. y axis enough . can you give me the detail . code ? e.g. legend=(.....)
nizhizhen
on 31 Aug 2017
I'm sorry but we don't offer very accurate legend placement - just e.g. :topright and so on.Your best bet is to make the plot higher. Agreed, we should offer this. You're welcome to open a new separate feature request issue on that.
mkborregaard
on 31 Aug 2017
thank you sir
nizhizhen
on 31 Aug 2017
Related issues
mkborregaard
·
34Comments
 sverek
·
30Comments
sverek
·
30Comments
 diegozea
·
36Comments
diegozea
·
36Comments
 mauro3
·
46Comments
mkborregaard
·
65Comments
mauro3
·
46Comments
mkborregaard
·
65Comments