Plots.jl: Adding markers to the legend with pyplot
As discussed at https://stackoverflow.com/questions/44401976/how-do-you-add-markers-to-the-legend-of-a-plots-jl-plot/44405883#44405883, for a line/scatter plot with marker = true, there is no way to display both the marker and the line together in the legend. This would be a nice feature to add.
 ttparker
All 9 comments
I wouldn't really call this a feature but a bug :)
 cortner
on 12 Aug 2017
cortner
on 12 Aug 2017
It should be fairly straightforward to implement, if you'd like to make a PR? It needs to be done on a backend-by-backend basis, though.
 mkborregaard
on 12 Aug 2017
mkborregaard
on 12 Aug 2017
@mkborregaard Sorry, are you talking to me or to cortner? I have no idea how the Plots package's internals work, and don't know how to implement this feature ...
ttparker
on 13 Aug 2017
To @cortner who I believe could definitely do it. It is also fine to wait - we will get to it eventually.
mkborregaard
on 13 Aug 2017
Not sure how I've deserved your optimism. I briefly looked at the pyplot backend - not all that straightforward for somebody who has worked on neither Plots.jl nor PyPlot. One would probably need to combine the if series[:markershape] != :none block with the if series[:linewidth] > 0 block.
If I find the time (and care enough) I will have a go.
cortner
on 13 Aug 2017
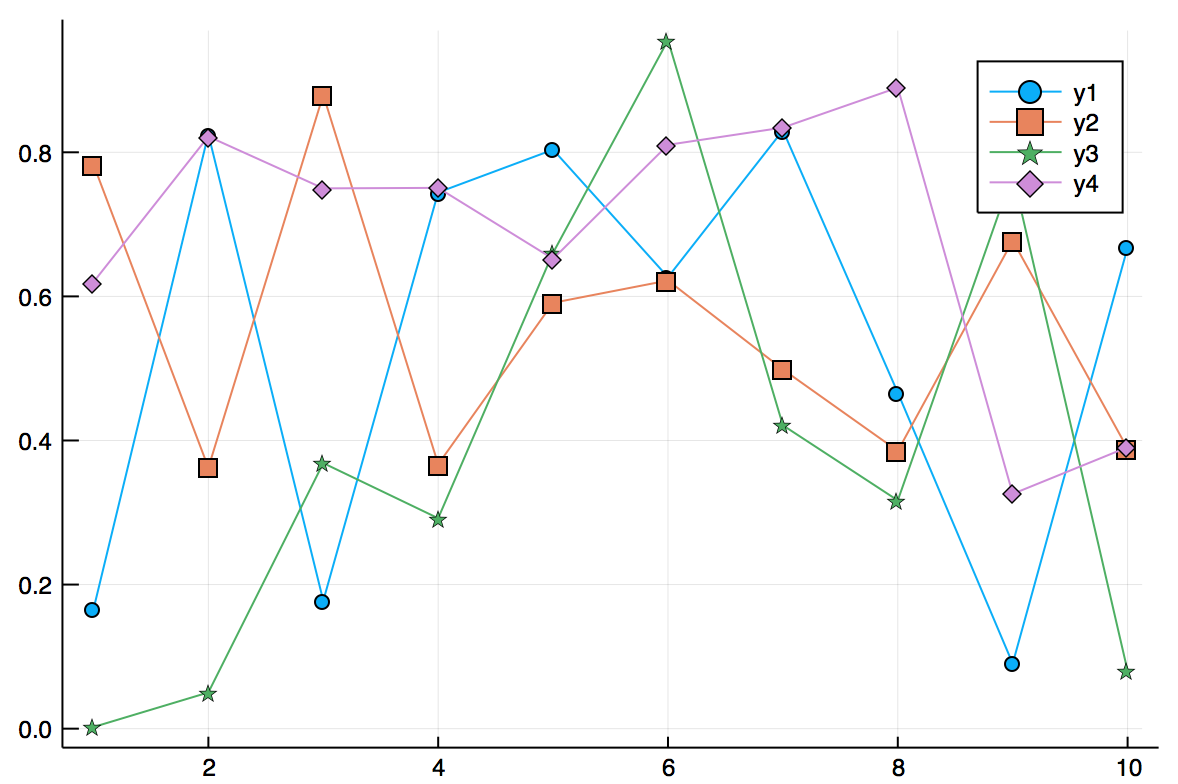
I've update to reflect that this is only a problem on pyplot - on GR and plotlyjs it works:
plot(rand(10,4), markershape = :auto)
mkborregaard
on 3 Oct 2017
Should we close this issue? Or do we wait until the next tag?
 JackDevine
on 6 Oct 2017
JackDevine
on 6 Oct 2017
Closing with #1133
Thanks @JackDevine!
 daschw
on 6 Oct 2017
daschw
on 6 Oct 2017
Thanks @daschw , it is always a pleasure to work with the people at Plots.jl :smiley:
JackDevine
on 6 Oct 2017
Related issues
 asinghvi17
·
3Comments
asinghvi17
·
3Comments
 apalugniok
·
3Comments
apalugniok
·
3Comments
 nebuta
·
3Comments
cortner
·
4Comments
nebuta
·
3Comments
cortner
·
4Comments
 kleinschmidt
·
3Comments
kleinschmidt
·
3Comments
Most helpful comment
Thanks @daschw , it is always a pleasure to work with the people at Plots.jl :smiley: