Plots.jl: Heatmap using non-numeric (categorical) colormaps
I want to include in MIToS some visualization for Multiple Sequence Alignments like alignfigR.
Is there a way with Plots to do a heatmap like plot for categorical variables?
 diegozea
All 18 comments
This works right now on the tb_pyplot branch:

 tbreloff
on 25 Apr 2016
tbreloff
on 25 Apr 2016
I were asking for a case where z is the categorical/grouping variable.
diegozea
on 25 Apr 2016
I'm not sure I understand. (Your link doesn't work... maybe fixing that would help explain?)
tbreloff
on 25 Apr 2016
I'm sorry. The link is: http://stackoverflow.com/questions/12998372/heatmap-like-plot-but-for-categorical-variables
diegozea
on 25 Apr 2016
So really what you're asking is if the colormap can have non-numeric data as it's values? I don't think it's possible out of the box... it's on the list.
tbreloff
on 25 Apr 2016
Exactly, I renamed the issue ;) Thanks!
diegozea
on 25 Apr 2016
Note: here's one possible method for pyplot: https://gist.github.com/jakevdp/8a992f606899ac24b711
tbreloff
on 26 Apr 2016
Getting closer:

I want to accept a Plots.ColorVector which makes it a discrete colormap. Right now it only accepts a Plots.ColorGradient with a continuous colormap. It works though! (sort of)
tbreloff
on 26 Apr 2016
Good progress!

tbreloff
on 26 Apr 2016
That looks really great!
diegozea
on 26 Apr 2016
I'm getting the following error with axiscolor=nothing and also with border=nothing
heatmap(ys,xs,z',yflip=true, grid=false, ratio=:equal, axiscolor=nothing)
MethodError: `convertColor` has no method matching convertColor(::Void)
Closest candidates are:
  convertColor(::Any, !Matched::Real)
  convertColor(::Any, !Matched::Void)

 in getPyPlotColor at /home/dzea/.julia/v0.4/Plots/src/backends/pyplot.jl:91
 in updateAxisColors at /home/dzea/.julia/v0.4/Plots/src/backends/pyplot.jl:849
 in finalizePlot at /home/dzea/.julia/v0.4/Plots/src/backends/pyplot.jl:1062
 in writemime at /home/dzea/.julia/v0.4/Plots/src/backends/pyplot.jl:1108
 in writemime at /home/dzea/.julia/v0.4/Plots/src/output.jl:118
 in writemime at multimedia.jl:43
 in sprint at iostream.jl:206
 in display_dict at /home/dzea/.julia/v0.4/Plots/src/Plots.jl:280
Also I'm getting the following error:
@show z'
heatmap(z', yflip=true, grid=false, ratio=:equal)
z' = ASCIIString["B" "C" "A" "B" "B" "C" "C" "A" "A" "A" "A" "C" "C" "B" "B"
            "A" "C" "C" "B" "B" "C" "C" "A" "A" "B" "A" "A" "A" "C" "C"
            "B" "A" "C" "A" "B" "B" "A" "C" "B" "C" "B" "C" "B" "C" "C"
            "C" "A" "C" "B" "B" "A" "B" "B" "B" "A" "A" "C" "C" "A" "B"]
LoadError: type Void has no field surf
Why am I seeing blue lines with the recipe?

diegozea
on 4 May 2016
I think these issues are solved now?
tbreloff
on 28 May 2016
Yes, It's solved :D Thanks @tbreloff !

diegozea
on 28 May 2016
I can't replicate this example from above.
n,m = 15,4
xs = [string("x",i) for i=1:n]
ys = [string("y",i) for i=1:m]
z = rand(["A","B","C"], n, m)
heatmap(xs, ys, z, yflip=true, c=[:red :blue :green])
Any idea?
 youngjaewoo
on 28 May 2019
youngjaewoo
on 28 May 2019
Does it work with the pyplot backend?
 mkborregaard
on 28 May 2019
mkborregaard
on 28 May 2019
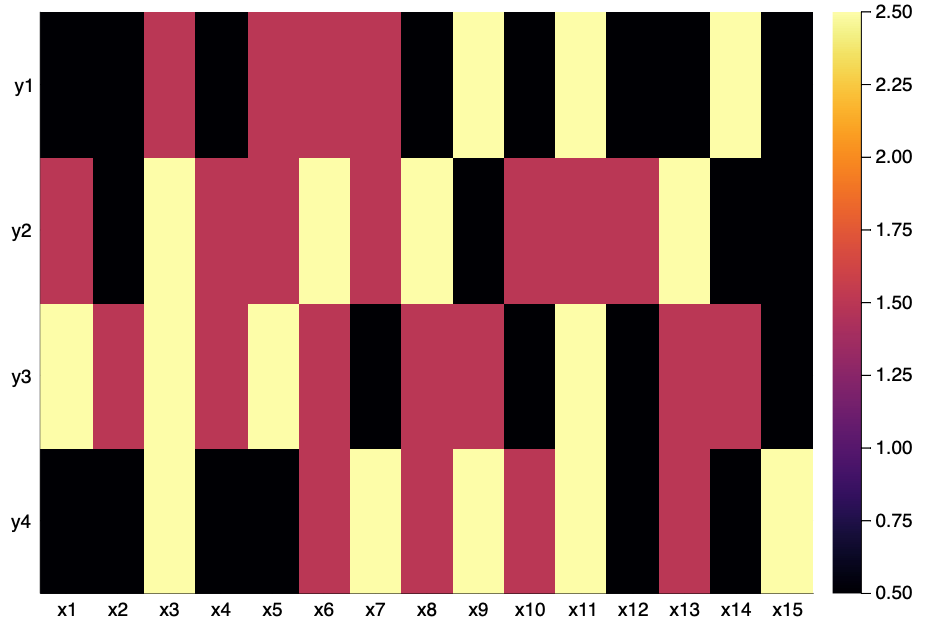
I can't test PyPlot in my machine at the moment, but think I figured out the problem.
n,m = 15,4
xs = [string("x",i) for i=1:n]
ys = [string("y",i) for i=1:m]
z = rand(["A","B","C"], n, m)
heatmap(xs, ys, z, yflip=true, c=cgrad([:red, :blue, :green]))

Looks like syntax for color input has changed since the last post where discrete colors aren't allowed.
youngjaewoo
on 28 May 2019
Related issues
 ChrisRackauckas
·
37Comments
tbreloff
·
45Comments
ChrisRackauckas
·
37Comments
tbreloff
·
45Comments
 rolfdstoll
·
36Comments
ChrisRackauckas
·
46Comments
mkborregaard
·
65Comments
rolfdstoll
·
36Comments
ChrisRackauckas
·
46Comments
mkborregaard
·
65Comments
Most helpful comment
Good progress!