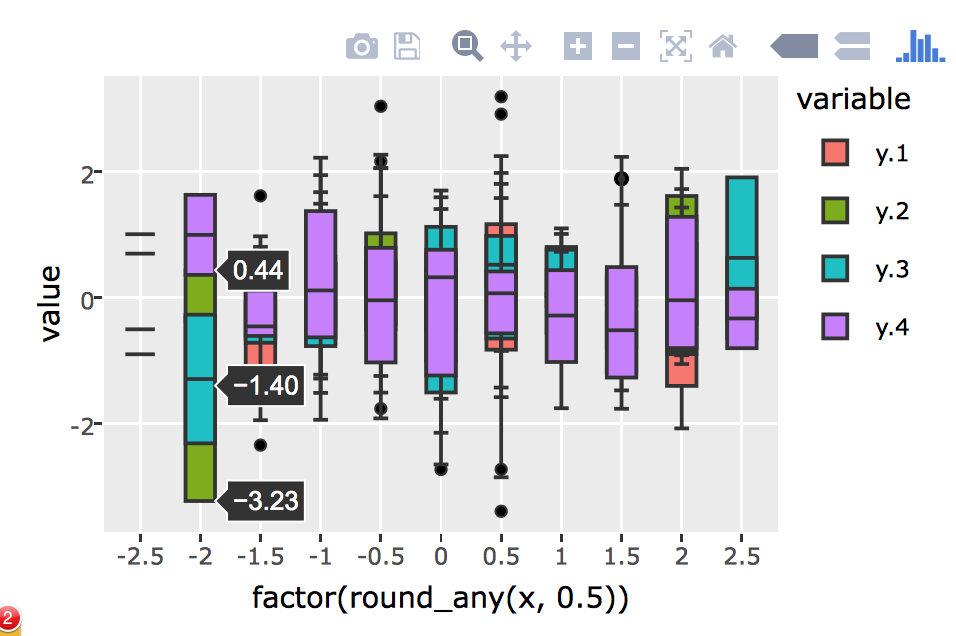
Plotly: boxes overlap when using ggplotly and geom_boxplot with a fill variable
library(plyr)
library(reshape2)
library(plotly)

set.seed(1234)
x<- rnorm(100)
y.1<-rnorm(100)
y.2<-rnorm(100)
y.3<-rnorm(100)
y.4<-rnorm(100)

df<- (as.data.frame(cbind(x,y.1,y.2,y.3,y.4)))

dfmelt<-melt(df, measure.vars = 2:5)

ggplot(dfmelt, aes(x=factor(round_any(x,0.5)), y=value,fill=variable)) + geom_boxplot()

ggplotly()
 cldougl
All 6 comments
Hi,
this can be solved by addig %>%layout(boxmode = "group"), i.e. use
p <-ggplot(dfmelt, aes(x=factor(round_any(x,0.5)), y=value,fill=variable)) + geom_boxplot()
ggplotly(p)%>%layout(boxmode = "group")
 ukkonen
on 29 Aug 2016
ukkonen
on 29 Aug 2016
👍5
Thanks @ukkonen !!
cldougl
on 30 Aug 2016
Thanks @ukkonen !!
 justAyaan
on 29 Sep 2019
justAyaan
on 29 Sep 2019
it helped me also
justAyaan
on 29 Sep 2019
Thanks @ukkonen
 rajeev16
on 25 Sep 2020
rajeev16
on 25 Sep 2020
Hi,
this can be solved by addig%>%layout(boxmode = "group"), i.e. usep <-ggplot(dfmelt, aes(x=factor(round_any(x,0.5)), y=value,fill=variable)) + geom_boxplot() ggplotly(p)%>%layout(boxmode = "group")
Thanks! As a note, while this solution works, it also gives the warning:
Warning message:
'layout' objects don't have these attributes: 'boxmode'
Valid attributes include:
'font', 'title', 'uniformtext', 'autosize', 'width', 'height', 'margin', 'paper_bgcolor', 'plot_bgcolor', 'separators', 'hidesources', 'showlegend', 'colorway', 'datarevision', 'uirevision', 'editrevision', 'selectionrevision', 'template', 'modebar', 'meta', 'transition', '_deprecated', 'clickmode', 'dragmode', 'hovermode', 'hoverdistance', 'spikedistance', 'hoverlabel', 'selectdirection', 'grid', 'calendar', 'xaxis', 'yaxis', 'ternary', 'scene', 'geo', 'mapbox', 'polar', 'radialaxis', 'angularaxis', 'direction', 'orientation', 'editType', 'legend', 'annotations', 'shapes', 'images', 'updatemenus', 'sliders', 'colorscale', 'coloraxis', 'metasrc', 'barmode', 'bargap', 'mapType'
But we can just ignore it apparently (#994).
 rtrad89
on 7 Oct 2020
rtrad89
on 7 Oct 2020
Was this page helpful?
0 / 5 - 0 ratings
Related issues
 fabiangehring
·
4Comments
fabiangehring
·
4Comments
 ratnanil
·
3Comments
ratnanil
·
3Comments
 gtumuluri
·
7Comments
gtumuluri
·
7Comments
 johncarew
·
6Comments
johncarew
·
6Comments
 kranthikandi
·
4Comments
kranthikandi
·
4Comments
Most helpful comment
Hi,
this can be solved by addig
%>%layout(boxmode = "group"), i.e. use