The current implementation of plotly.py does not support Dask.
Is there any plans on integrating this?
 pedroallenrevez
All 12 comments
Hi @pedroallenrevez, dask is a super-awesome interactive distributed computing library (I'm actually an occasional contributor!), but I don't think I understand what you mean by having plotly.py support Dask. Could you elaborate?
 jonmmease
on 6 Nov 2018
jonmmease
on 6 Nov 2018
import plotly.graph_objs as go
import pandas as pd
import numpy as np
import datashader as ds
from datetime import datetime
import datashader.transfer_functions as tf
import dask.dataframe as dd
from math import floor
# plotly
import plotly.plotly as py
from plotly.offline import init_notebook_mode, iplot
init_notebook_mode(connected=True)
import plotly.graph_objs as go
def generate_df(size=100000):
d = {
'dates' : pd.date_range('2015-01-01', periods=size, freq='1min'),
'unique_id' : np.arange(0, size),
'ints' : np.random.randint(0, size, size=size),
'floats' : np.random.randn(size),
'bools' : np.random.choice([0, 1], size=size),
'int_nans' : np.random.choice([0, 1, np.nan], size=size),
'float_nans' : np.random.choice([0.0, 1.0, np.nan], size=size),
'constant' : 1,
'categorical' : np.random.choice([10, 20, 30, 40, 50], size=size) ,
'categorical_binary' : np.random.choice(['a', 'b'], size=size),
#'categorical_nans' : np.random.choice(['a', 'b', np.nan], size=size)
'categorical_nans' : np.random.choice(['a', 'b', 'c'], size=size)
}
df = pd.DataFrame(d)
# df['hardbools'] = df['bools'] == 1
df['categorical_nans'] = df['categorical_nans'].replace('c', np.nan)
# df['hardcategorical_nans'] = df['categorical_nans'].astype('category')
df['categorical_binary'] = df['categorical_binary'].astype('category')
df['categorical_nans'] = df['categorical_nans'].astype('category')
# df = df.set_index('dates')
df['dates_int'] = df['dates'].astype('int64')
return df
def generate_dask_df(size=100000, partitions=6):
df = generate_df(size)
return dd.from_pandas(df, partitions)
ddf = generate_dask_df(100000)
plt = go.Scatter(
x=ddf.dates,
y=ddf.floats,
mode = "lines",
name = "signal",
marker = dict(color = 'rgba(16, 112, 2, 0.8)'),
text= 'floats'
)
This doesn't seem to work!
Produces the following stack trace, which leads me to believe that plotly does not support dask.
ValueError Traceback (most recent call last)
<ipython-input-11-173617ab9687> in <module>
5 name = "signal",
6 marker = dict(color = 'rgba(16, 112, 2, 0.8)'),
----> 7 text= 'floats'
8 )
/usr/local/lib/python3.6/site-packages/plotly/graph_objs/_scatter.py in __init__(self, arg, cliponaxis, connectgaps, customdata, customdatasrc, dx, dy, error_x, error_y, fill, fillcolor, groupnorm, hoverinfo, hoverinfosrc, hoverlabel, hoveron, hovertext, hovertextsrc, ids, idssrc, legendgroup, line, marker, mode, name, opacity, orientation, r, rsrc, selected, selectedpoints, showlegend, stackgaps, stackgroup, stream, t, text, textfont, textposition, textpositionsrc, textsrc, tsrc, uid, unselected, visible, x, x0, xaxis, xcalendar, xsrc, y, y0, yaxis, ycalendar, ysrc, **kwargs)
2370 self['visible'] = visible if visible is not None else _v
2371 _v = arg.pop('x', None)
-> 2372 self['x'] = x if x is not None else _v
2373 _v = arg.pop('x0', None)
2374 self['x0'] = x0 if x0 is not None else _v
/usr/local/lib/python3.6/site-packages/plotly/basedatatypes.py in __setitem__(self, prop, value)
2773 # ### Handle simple property ###
2774 else:
-> 2775 self._set_prop(prop, value)
2776
2777 # Handle non-scalar case
/usr/local/lib/python3.6/site-packages/plotly/basedatatypes.py in _set_prop(self, prop, val)
3009 return
3010 else:
-> 3011 raise err
3012
3013 # val is None
/usr/local/lib/python3.6/site-packages/plotly/basedatatypes.py in _set_prop(self, prop, val)
3004 validator = self._validators.get(prop)
3005 try:
-> 3006 val = validator.validate_coerce(val)
3007 except ValueError as err:
3008 if self._skip_invalid:
/usr/local/lib/python3.6/site-packages/_plotly_utils/basevalidators.py in validate_coerce(self, v)
339 v = to_scalar_or_list(v)
340 else:
--> 341 self.raise_invalid_val(v)
342 return v
343
/usr/local/lib/python3.6/site-packages/_plotly_utils/basevalidators.py in raise_invalid_val(self, v)
242 typ=type_str(v),
243 v=repr(v),
--> 244 valid_clr_desc=self.description()))
245
246 def raise_invalid_elements(self, invalid_els):
ValueError:
Invalid value of type 'dask.dataframe.core.Series' received for the 'x' property of scatter
Received value: Dask Series Structure:
npartitions=6
0 datetime64[ns]
16667 ...
...
83335 ...
99999 ...
Name: dates, dtype: datetime64[ns]
Dask Name: getitem, 12 tasks
The 'x' property is an array that may be specified as a tuple,
list, numpy array, or pandas Series
Unless I'm doing something wrong, of course!
Thanks!
pedroallenrevez
on 6 Nov 2018
Thanks for the example. Yes, plotly.py doesn't directly accept Dask Series objects so you'll need to call compute on them before passing them to plotly.py
e.g.
plt = go.Scatter(
    x=ddf.dates.compute(),
    y=ddf.floats.compute(),
    ...
)
It's possible that plotly.py could check if the input is a dask Series and call compute on it automatically. Thanks for the suggestion!
jonmmease
on 6 Nov 2018
The objective is not using compute (using distributed workers).
Thanks for the help!
pedroallenrevez
on 6 Nov 2018
What would you want plotly.py to do with a Dask Series other than compute it into a pandas Series and display it?
jonmmease
on 7 Nov 2018
I would want plotly to handle distributed data without the need to compute and putting it in memory.
Imagine I have 50 million points I want to plot. I don't want to put them in memory.
I want plotly to have distributed computing logic, so it can handle distributed dataframes (dask).
Why would you need dask if you just compute?...
If I computed the dataframe, this issue wouldn't even make sense!
The question is, is this in the roadmap for plotly or not?
pedroallenrevez
on 7 Nov 2018
Here are a few thoughts:
1) All of the traces in the plotly.graph_objs package are direct wrappers around plotly.js trace types. Plotly.js is a pure clientside browser-based JavaScript library and so it needs to have the full data representation of what it's plotting in memory in the browser. So I don't see a path towards getting reasonably interactive performance on 50 million points in a plotly.graph_objs.Scatter trace.
2) To handle this many points, and to take advantage of dask's distributed nature for rendering them, would require a 'server-side' rendering pipeline. This is exactly the problem that the datashader project has been built for.
3) It's already possible (though not especially convenient) to use datashader for server-side rendering and then display the rendered image in plotly.py. See https://plot.ly/python/change-callbacks-datashader/.
4) I do want to build a convenient interface for doing what this example notebook does, probably as a new figure factory in the plotly.figure_factor package. This datashader-based figure factory would directly accept dask data structures and feed them into the datashader library to perform server-side rendering.
jonmmease
on 7 Nov 2018
I think number 4 is the way to go.
I can now understand why "integration" with Dask might be a bit of a problem.
Effectively speaking, as you said, this is already done by Datashader, which is the final objective.
That interface would greatly help the usability of plotly for data scientists.
I'll post another issue on datetime conversions for datashader.
pedroallenrevez
on 7 Nov 2018
Alright if we close this issue in favor of #1270 as Dask support would come along with datashader integration?
jonmmease
on 7 Nov 2018
Yes it is alright.
pedroallenrevez
on 8 Nov 2018
For folks finding this issue via Google, I highly recommend checking out this Dash + Datashader example that Jon Mease wrote:
Dash app: https://dash-gallery.plotly.host/dash-world-cell-towers/
Source code: https://github.com/plotly/dash-world-cell-towers
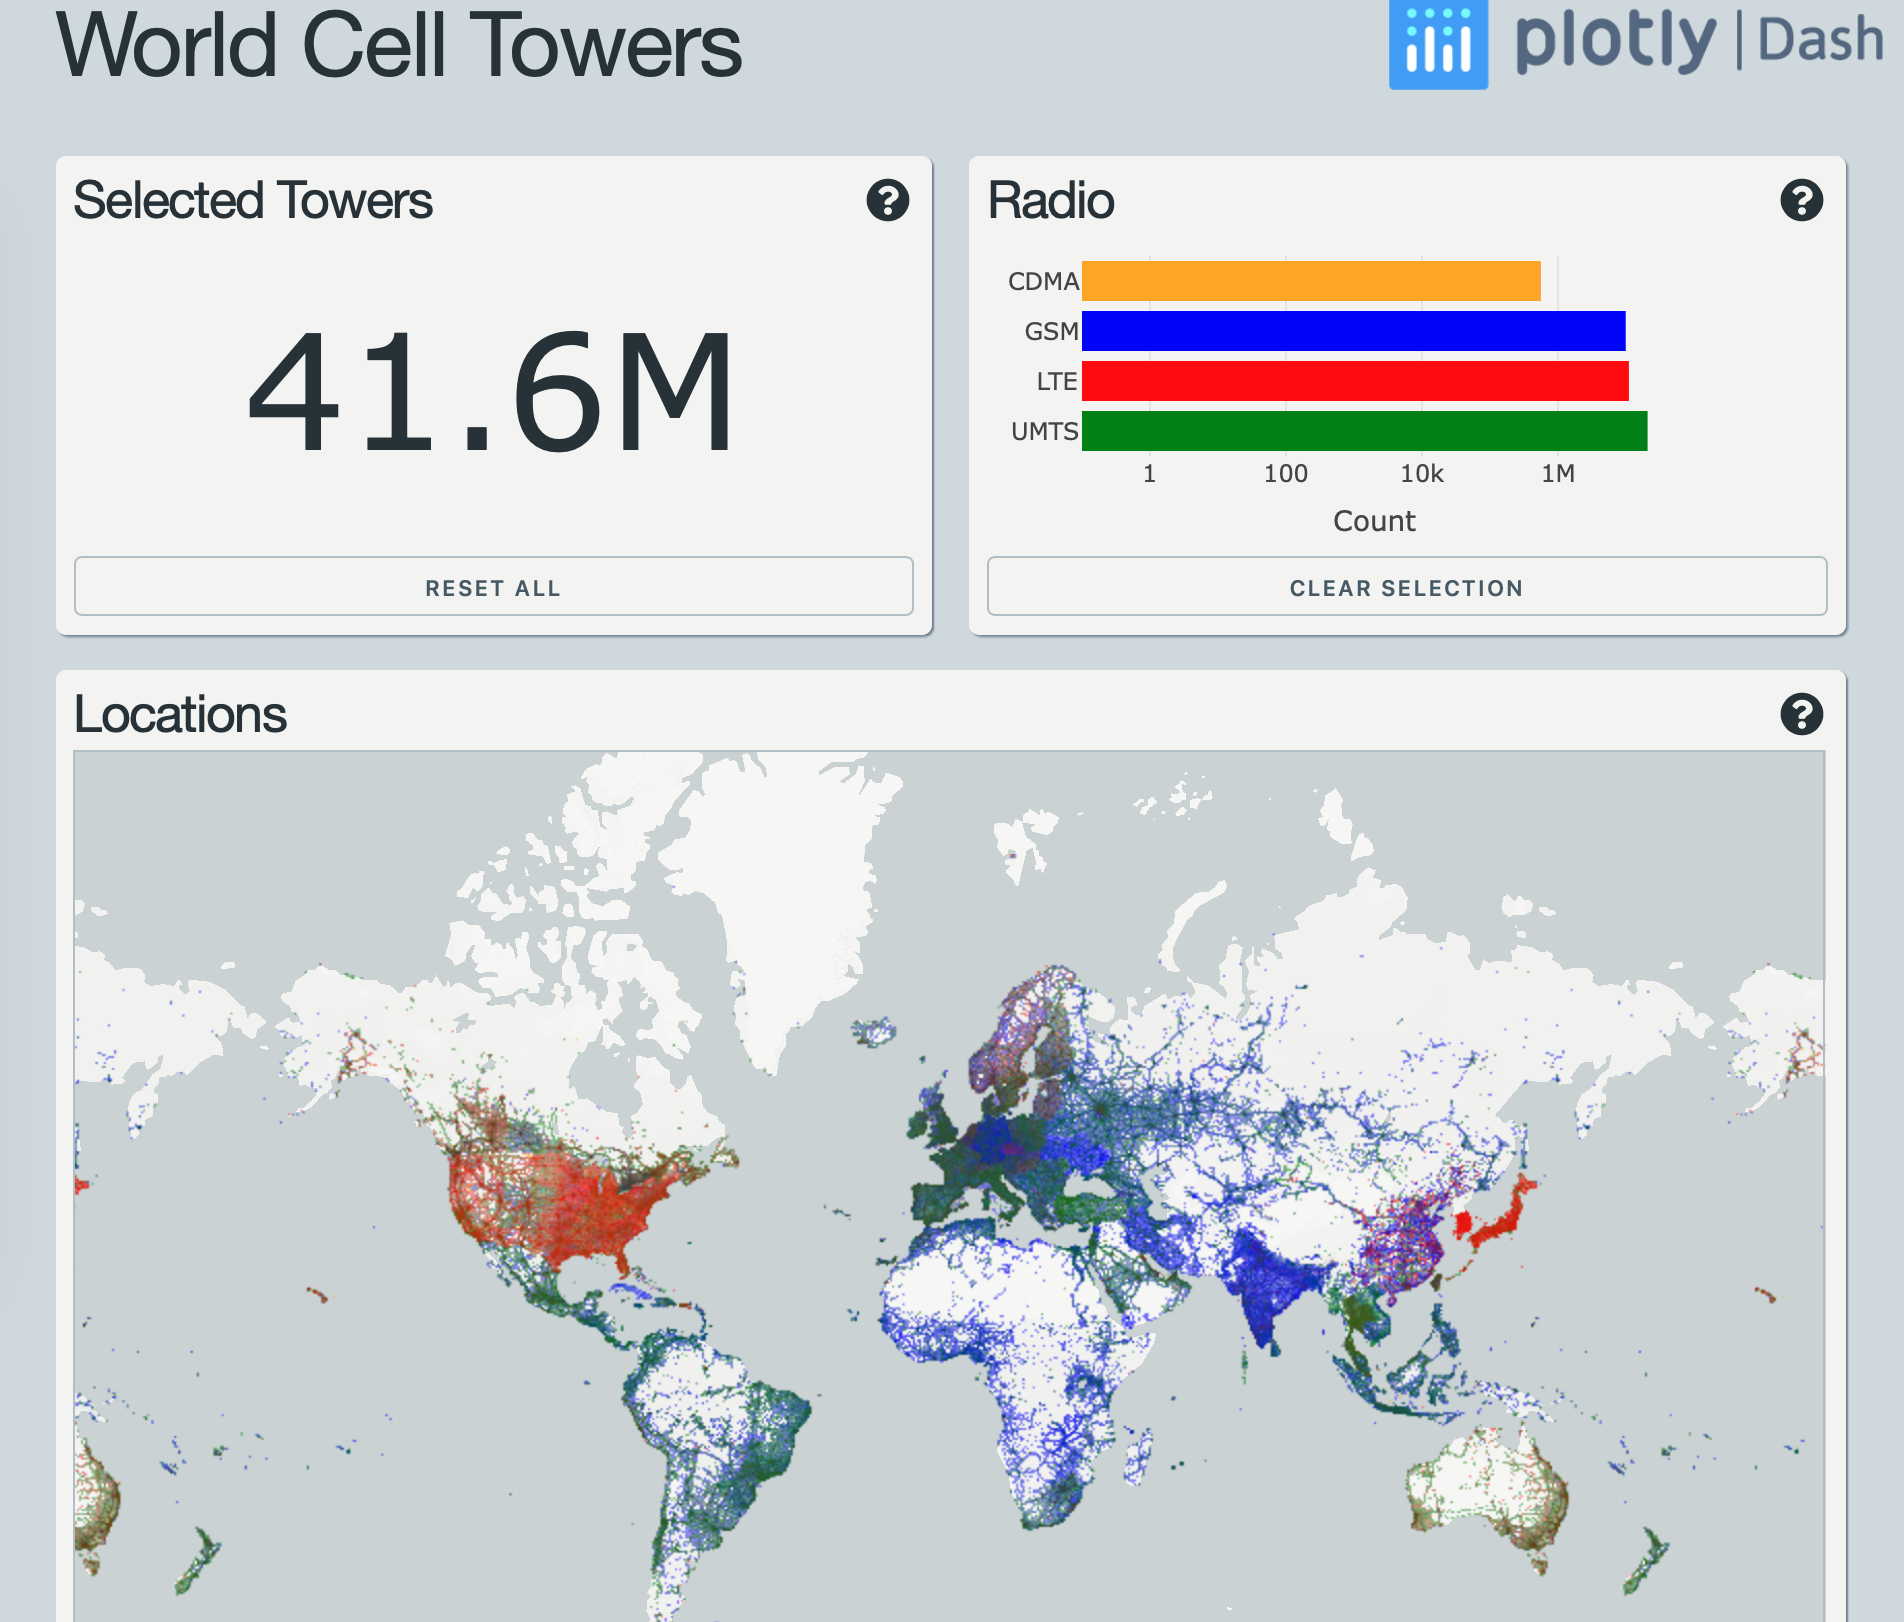
This app is current best practice for Plotly tech + Dask ATM IMHO.
 jackparmer
on 6 Mar 2020
jackparmer
on 6 Mar 2020
is dask integration available now?
 ms8909
on 28 May 2020
ms8909
on 28 May 2020
Related issues
 roeap
·
4Comments
roeap
·
4Comments
 dhirschfeld
·
4Comments
dhirschfeld
·
4Comments
 jjc12
·
5Comments
jjc12
·
5Comments
 entron
·
4Comments
entron
·
4Comments
 ghtmtt
·
5Comments
ghtmtt
·
5Comments
Most helpful comment
Thanks for the example. Yes, plotly.py doesn't directly accept Dask
Seriesobjects so you'll need to callcomputeon them before passing them to plotly.pye.g.
It's possible that plotly.py could check if the input is a dask
Seriesand call compute on it automatically. Thanks for the suggestion!