Plotly.py: Offline mode not displaying inline in Jupyter notebook master?
I hadn't tested recently, but today, using master of the Jupyter notebook, I can't get offline plots to display inline, instead I get the external temporary file. Consider this simple test:
from plotly import __version__
from plotly.offline import init_notebook_mode, plot
from plotly.graph_objs import Scatter

init_notebook_mode()

print("plotly version:", __version__)
plot([Scatter(x=[1, 2, 3], y=[3, 1, 6])])
I get for output:
plotly version: 1.9.10
Out[1]: 'file:///Users/fperez/tmp/temp-plot.html'
and the plot correctly opening in a new tab by itself, but no inline notebook output. Here's a screenshot for reference:

In the JS console, I don't see anything that immediately points to the problem. Here's a screenshot, b/c copy-pasting text from the JS console makes a mish-mash of the formatting:

The above were from current Chrome on OSX, but I replicated the problem on Safari.
Any thoughts on how to proceed much appreciated. Thanks!
 fperez
All 40 comments
Hi there - can you try using iplot() instead of plot . plot should return a div or html file while iplot() will plot in your notebook
Here's a reference: https://plot.ly/python/offline/
 cldougl
on 1 May 2016
cldougl
on 1 May 2016
Ah, sorry about that! I was indeed using that reference (the example is taken from it), but I failed to notice the difference. Might be worth adding a highlight to the docs indicating the switch from plot to iplot so people don't inadvertently miss it on quick reading.
But oddly, I still don't get any output... I tried both on Safari and Chrome, and nothing:

Nothing in the Safari console. Any thoughts?
fperez
on 1 May 2016
Oddly, now it's working again... I haven't changed anything, just did some other work and came back to the same test:

That's extremely odd. I am OK for now, I guess, and can move forward. But it would be nice to know if you have any thoughts as to why I may have seen this now-unreproducible failure (I did verify it in both Chrome and Safari, just to be sure).
In any case, if you can't replicate this anywhere, probably best to close this for now. I can always come back if I have more details or relevant info. Thanks!
fperez
on 1 May 2016
The iplot works just one time,I got the same issue when press ctrl+return to run it again.
The iplot returns a 'None'. If I open a new notebook,it works one time again.......
The plot function works well.(return a local html address)

 kingway66
on 2 May 2016
kingway66
on 2 May 2016
Good point about the docs- I'll clarify that now.
I can't quite reproduce the issue at the moment but feel free to reopen if you run into it again!
cldougl
on 2 May 2016
No problem, thanks for the prompt response and help!
fperez
on 3 May 2016
I see a strange behavior when combining plotly and cufflinks.
Often I see the following error in the console:
GET http://localhost:8888/static/+a(r)+.js?v=20160816225444
Uncaught Error: Script error for "+a(r)+"
http://requirejs.org/docs/errors.html#scripterror
and then the plots are empty white spaces.
It's quite difficult to shake this error off.
I have to clear all cells, restart the kernel.
My config is:
plotly                    1.12.6                    <pip>
cufflinks                 0.8.2                     <pip>
My NB first cell is:
import os, sys
import numpy as np
import pandas as pd

from IPython.display import display

from plotly import __version__
print 'plotly version: ', __version__ # requires version >= 1.9.0
from plotly.offline import init_notebook_mode, iplot, plot
import plotly.plotly as py
import plotly.graph_objs as go

import cufflinks as cf
print 'cufflinks version: ',cf.__version__

# run at the start of every ipython notebook to use plotly.offline
# this injects the plotly.js source files into the notebook
init_notebook_mode(connected=True)
cf.go_offline()
Second cell is :
iplot([{"x": [1, 2, 3], "y": [3, 1, 6]}])
Third cell is:
df = cf.datagen.lines()
display(df.info())

df.iplot(kind='line')
If I save the NB after Run All then when I open it again all plots are white spaces.
I have to clear all outputs, save and close and reopen and rerun all to see the plots again.
But is I open the notebook (all cells being cleared before), comment cf.go_offline() then run the 1st and 2nd cell, then save and close it, when I open it again the plot is still there.
So I think that cf.go_offline() must somehow collide withinit_notebook_mode(connected=True).
It looks like a require issue, from the error.
Would it be easy to correct ? If yes, all the better because calling plotly from pandas pandas offline (most of the time) is more convenient to me (and faster).
I had tried plotly 2 years ago and it has improved A LOT, I think. Congrats !!
But this is the sort of small obstacle that prevents me from really diving in..
 oscar6echo
on 17 Aug 2016
oscar6echo
on 17 Aug 2016
The problem seems to be corrected with version 1.12.7
Cf http://community.plot.ly/t/offline-mode-in-jupyter-notebook-shows-blank-graphs/1860/8
oscar6echo
on 17 Aug 2016
Was this ever figured out? Sometimes it works for me and sometimes it doesn't so it's difficult to use plotly consistently.
import plotly
import plotly.offline as py
from plotly import graph_objs as go
py.init_notebook_mode(connected=True)
print(plotly.__version__)
# 2.0.6

# Simple sine function
x = np.linspace(0,2*np.pi)
y = np.sin(x)
trace = go.Scatter(x=x,y=y)
py.iplot([trace])
I'm using Python 3.6 but I also had this issue with 3.5.2. Jupyter version is jupyter 1.0.0 py36_3 and IPython 5.1.0
 jolespin
on 23 Mar 2017
jolespin
on 23 Mar 2017
Plotly is so fickle, the plots work at times and don't every now and then. I see random javascript errors in my console like the following.
Failed to load resource: the server responded with a status of 404 (Not Found)
require.js:140 Uncaught Error: Script error for "plotly"
http://requirejs.org/docs/errors.html#scripterror
at makeError (require.js:165)
at HTMLScriptElement.onScriptError (require.js:1732)
I wish there was some RCA before this ticket was simply closed.
 vatsan
on 21 Apr 2017
vatsan
on 21 Apr 2017
I'm experiencing the same issue with plotly 2.0.8 and jupyter 4.2.1. I can't identify when it does and doesn't work. It appears random. The error I get via chromium is:
Uncaught Error: Script error for "plotly"
http://requirejs.org/docs/errors.html#scripterror
    at makeError (require.js:165)
    at HTMLScriptElement.onScriptError (require.js:1732)
 OliverEvans96
on 11 May 2017
OliverEvans96
on 11 May 2017
In newer jupyter versions, the requirejs error might be because of notebook trust. When the notebook considers the .ipynb untrusted, it will not run javascript on initialization. This interferes with the way that plotly gets injected into the jupyter notebook.
If that is the issue, clicking the button in the top right of the notebook to "trust" the ipynb may fix it. Installing & configuring the nbextension might help too.
 b11z
on 15 May 2017
b11z
on 15 May 2017
Happens to me at random as well. Sometimes restarting the notebook helps, sometimes not. Sometimes restarting chrome helps, sometimes not. Very hard to keep consistent work, is there any knowledge about the source of the problem?
 edoson
on 4 Jul 2017
edoson
on 4 Jul 2017
It would be helpful to know, for the people who are seeing this problem, what is the state of the Trust indicator in the top right hand corner. Is this happening for Trusted notebooks, or only non-trusted notebooks (as my theory would have it)?

b11z
on 6 Jul 2017
Hi b11z,
I dont have this indictation at all. My plotly version is 2.0.9 and jupyther version is 1.0.0 Ipython version is 5.1.0 and python version 2.7.12 64bit.
I'm also can't use plotly anymore, been trying for the last 2 hours to load graphs and nada, all are blanks.
edoson
on 9 Jul 2017
Update -
I've updated jupyter, ipython, plotly and cuffilnks to latest versions and hard refresshed my notebook (shift + command + r on my mac) and the plots are back.
edoson
on 9 Jul 2017
I am running into the same issue and it seems very random as to when it starts to occur on a notebook.
If I rebuild the entire notebook, my plots work again. The notebook is trusted. I have cleared browser cache, etc. It appears that sometimes the plotly.js file is just not downloaded. Connected=true does not work for me as a fix.
Here is the error I see in the browser console:

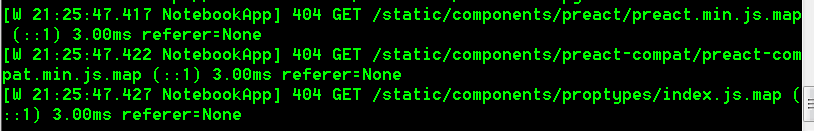
And here is the error I see in cmd where I started the notebook:

 thhancock
on 12 Jul 2017
thhancock
on 12 Jul 2017
Updating again - It's not working. Now more consistently than ever i.e. I can't get the notebook to plot 95% of the time. Starting to consider alternatives :/
edoson
on 13 Jul 2017
So took some time to investigate a little further. The following code presents a plot in a new notebook on the server but not in running-with-blanks notebook:
from pandas import *
import cufflinks as cf
ctrByAlgo=cf.datagen.lines(4,mode='abc')
cf.go_offline()
ctrByAlgo.iplot(secondary_y=['c', 'd'])
Seems like hard refresh (command + shift + R on my chrome on mac) does indeed solve the issue on the running-blanks notebook.
Hope it helps someone.
edoson
on 13 Jul 2017
@edoson
Hard reset seems to be working for me too. CTRL + F5 on Windows with Chrome.
thhancock
on 13 Jul 2017
@thhancock
Hard reset is not working for me anymore. The issue comes and goes randomaly, I can't find a consistent fix.
Is this issue effecting only us? Is plotly still supported? I don't understand how an issue like this is not solved already..
edoson
on 31 Jul 2017
@edoson
Oddly, this only occurs for me in Notebooks with very high memory usage (10+ GB) and LOTs of plots. I have found, for whatever reason, that running the Notebook cell-by-cell also helps (as opposed to "Restart and Run All").
Here's the steps I use:
Open Notebook (might have been saved with plots there);
Restart and Clear Output;
Save the Notebook;
Hard Refresh of browser;
Run Notebook cell-by-cell.
thhancock
on 1 Aug 2017
@thhancock
This is really a weird issue. But after a hard refresh, I can not reproduce the issue (till now).
I still unable to get the graph out in PyCharm.
When it happened in Chrome, I got the same errors in the browser console.
 August-Ghost
on 2 Aug 2017
August-Ghost
on 2 Aug 2017
@August-Ghost, @edoson
Out there theory: Are you two using git to track changes / version control on the directory you have the notebook in?
thhancock
on 2 Aug 2017
@thhancock
No, I'm not using git. I use the notebook on a remote server and I'm accessing it via my browser. The blanks are occurring in local mode too though.
Stopped using plotly since few days ago, when the graphs went blanks in the middle of a group presentation I made..
edoson
on 2 Aug 2017
@thhancock @edoson
Me neither. But I reproduced the issue by removing and reinstall jupyter notebook.
It seems that there is something wrong with jupyer notebook.
August-Ghost
on 2 Aug 2017
@thhancock @edoson Starting with the version 5.0 the Jupyter Notebook has a limited data_rate. Read here https://community.plot.ly/t/tips-for-using-plotly-with-jupyter-notebook-5-0-the-latest-version/4156 how to increase this rate.
 empet
on 2 Aug 2017
empet
on 2 Aug 2017
@thhancock @edoson @empet
That works for me.
without --NotebookApp.iopub_data_rate_limit=1.0e10:

with --NotebookApp.iopub_data_rate_limit=1.0e10:


There are still some 404 errors but at least I get the graph back.
August-Ghost
on 2 Aug 2017
I don't think it's a data rate issue. I hacked out the data rate problem when I had 5.0 installed, but still got the blank plots.
I reverted back to Jupyter 4.x and still get blank plots to this day unless I follow my procedure above.
thhancock
on 3 Aug 2017
FYI -
I got the same error as @thhancock and @August-Ghost and traced my issue back to the Markdown in the notebook.
I had a heading # Plotly. Clearly the id of the HTML element gets written into the DOM and overrides or interferes with the JS script insertion (which is at window.Plotly). Depending on what's previously been saved into the notebook and cached, and in what order relative to the script insertion, it seems that this interference can stick around despite the relevant markdown cell being changed.
Making a clean copy of the same notebook (using nbformat - see fperez gist) with a lower case p (i.e. # plotly) fixed it.
 maegul
on 10 Aug 2017
maegul
on 10 Aug 2017

A hard refresh of the notebook in the browser (Ctrl+Shift+r) solves this.
 adrienrenaud
on 28 Sep 2017
adrienrenaud
on 28 Sep 2017
@b11z clicking the 'Not Trusted' button fixed it for me. Thanks for the tip.
 daronjp
on 27 Mar 2018
daronjp
on 27 Mar 2018
I struggled with this for a few hours but oddly refreshing chrome browser and changing notebook to Trusted worked for me. Thanks!
 RonKG
on 7 Apr 2018
RonKG
on 7 Apr 2018
Save the notebook and refresh browser solved the problem for me.
 statham-stone
on 19 Apr 2018
statham-stone
on 19 Apr 2018
Save the notebook and refresh browser solved the problem for me.
 ashispapu
on 28 Apr 2018
ashispapu
on 28 Apr 2018
Addingplotly.offline.init_notebook_mode() solved this problem for me.
 AlKavaev
on 17 Aug 2018
AlKavaev
on 17 Aug 2018
In case this issue is still coming up in google searches, please check out the new FigureWidget support for Jupyter 😸 https://medium.com/@plotlygraphs/introducing-plotly-py-3-0-0-7bb1333f69c6
 chriddyp
on 30 Aug 2018
chriddyp
on 30 Aug 2018
still blank plot after try every ways
 steer629
on 11 Mar 2019
steer629
on 11 Mar 2019
Save the notebook and refresh browser solved the problem for me.
Thanks @Statham-stone , it did worked ! :)
 urstrulykkr
on 22 Apr 2019
urstrulykkr
on 22 Apr 2019
The Problem with me is that no lines where displayed. I have just use another browser and it works finally.
 r131amin
on 3 Dec 2019
r131amin
on 3 Dec 2019
Related issues
 gv-collibris
·
4Comments
gv-collibris
·
4Comments
 ivirshup
·
3Comments
ivirshup
·
3Comments
 entron
·
4Comments
entron
·
4Comments
 binaryfunt
·
5Comments
binaryfunt
·
5Comments
 keithjjones
·
3Comments
keithjjones
·
3Comments
Most helpful comment
In newer jupyter versions, the requirejs error might be because of notebook trust. When the notebook considers the .ipynb untrusted, it will not run javascript on initialization. This interferes with the way that plotly gets injected into the jupyter notebook.
If that is the issue, clicking the button in the top right of the notebook to "trust" the ipynb may fix it. Installing & configuring the nbextension might help too.