Plotly.js: Scatter line doesn't get drawn if points are too close
Hello,
I'm implementing a timeline-chart by using a scatter type plot with lines.
Working example:
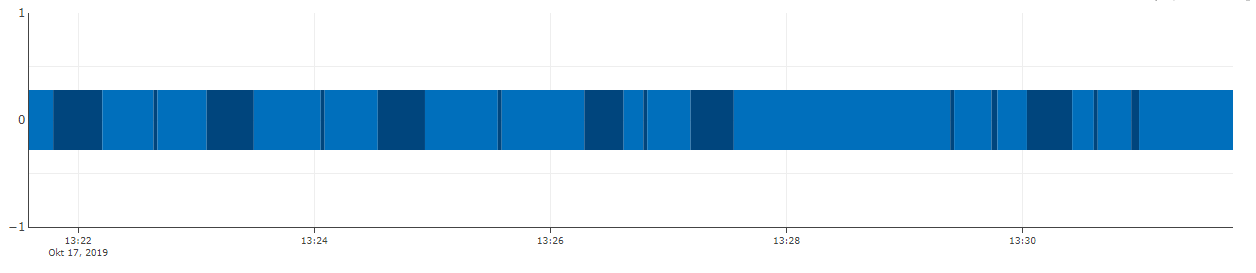
In the screenshot above, each coloured tile is a trace with it's own start- and end-timestamp and value.
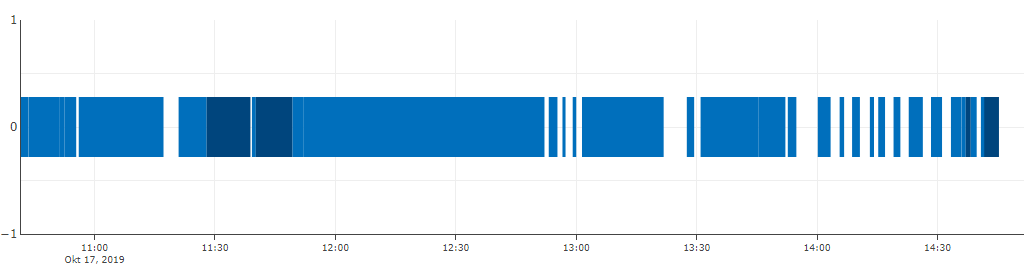
However, if the delta between start and end of a single trace is too small compared to the timerange of the x-axis, the trace won't get drawn and leaves a gap. If multiple of those small traces are in a row, there's even a bigger gap visible, even though the raw data has no gaps between the timestamps:
I made a small codepen-example for this:
https://codepen.io/nriedinger/pen/BaaLyLo
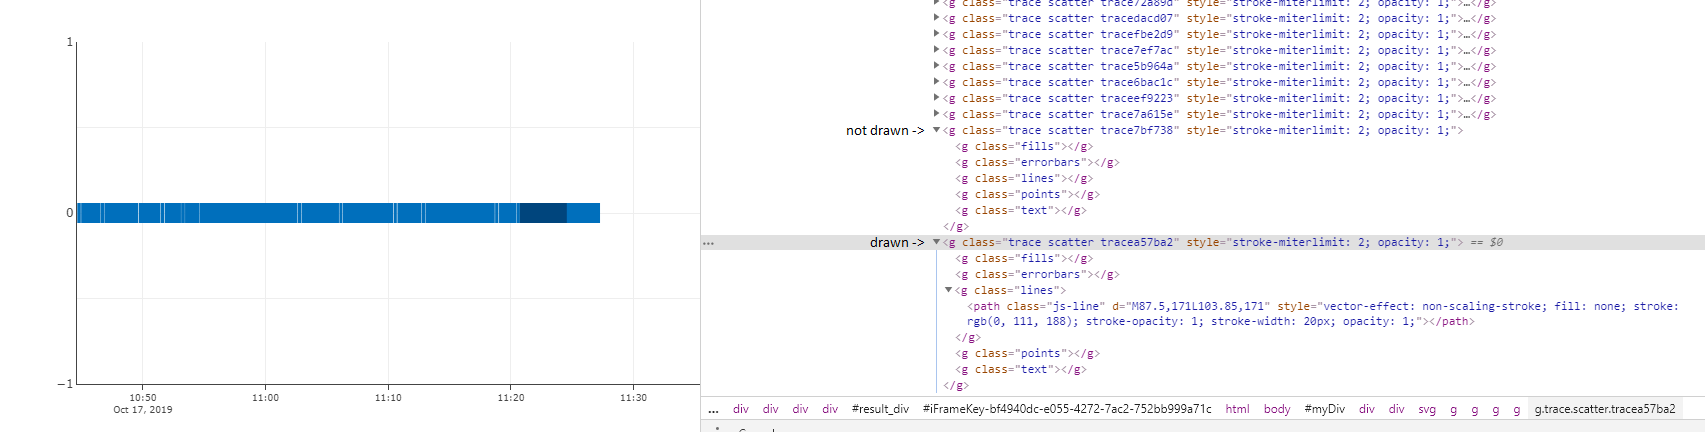
If you zoom in on the white gaps, you can see that those should be dark-blue traces.
When inspecting the codepen site we can see, that those traces are even in the DOM, but without the path-children
So my questions are:
- Is there a way to still draw those traces?
- Is this a bug or intended?
- Am I missing something here?
 NRiedinger
All 12 comments
Hi @NRiedinger - thanks for writing in.
Could you share a codepen of the "working example" from which you took your first screenshot? That should help us debug.
 etpinard
on 17 Oct 2019
etpinard
on 17 Oct 2019
Hey @etpinard thanks for the quick answer!
You can get the "working example" by zooming in on my codepen example.
It really only happens when I have a big timerange on the x-axis compared to the timerange of the trace I want to draw.
My codepen example is basically the same like in our product, where I took the screenshot from.
NRiedinger
on 17 Oct 2019
Here's an example with numeric axes, here the orange trace is just below the threshold and disappears, the green is just above and appears. Seems to happen at any angle and just be related to pixel length as a fraction of line width https://codepen.io/alexcjohnson/pen/GRRjZrW?editors=1010
 alexcjohnson
on 17 Oct 2019
alexcjohnson
on 17 Oct 2019
By setting line.simplify: false, look likes we get the correct results:
- https://codepen.io/etpinard/pen/zYYKKaJ?editors=1010
- https://codepen.io/etpinard/pen/MWWjjXQ?editors=1010
Maybe adapting some of the tolerance values in line_points.js in function of the pixel range of the graph would be help solve this problem?
etpinard
on 17 Oct 2019
Or maybe we should skip the line-simplification algo for coordinate arrays less than say length=50?
etpinard
on 17 Oct 2019
... which could also help with transitions of "simple" line traces cc https://github.com/plotly/plotly.js/issues/4250
etpinard
on 17 Oct 2019
I don't think we should be adding more magic numbers. I feel like the solution here is simplification should never remove the first or last point in any contiguous section (ie a sub-array with no nulls). I'm guessing what's happening here is it's adding the first point, skipping the second because it's too close to the first, then realizing it only has a 1-point line and deleting the whole thing.
alexcjohnson
on 17 Oct 2019
By setting
line.simplify: false, look likes we get the correct results:
- https://codepen.io/etpinard/pen/zYYKKaJ?editors=1010
- https://codepen.io/etpinard/pen/MWWjjXQ?editors=1010
Maybe adapting some of the tolerance values in
line_points.jsin function of the pixel range of the graph would be help solve this problem?
That worked, thanks!
I must have somehow overlooked it in the docs :D
NRiedinger
on 18 Oct 2019
I don't think we should be adding more magic numbers.
in principle yes but the current behaviour is causing a fair number of problems... I think https://github.com/plotly/plotly.py/issues/1843 is related also
 nicolaskruchten
on 27 Oct 2019
nicolaskruchten
on 27 Oct 2019
the current behaviour is causing a fair number of problems
Let's address the animation-related pieces of this in #4250, and address the static-display bug on its own per my earlier https://github.com/plotly/plotly.js/issues/4282#issuecomment-543267004
alexcjohnson
on 28 Oct 2019
Hey guys!
So, let me just say that plotly.js is awesome. I saw this issue and went and read line_points.js. A quick hacky and non-ideal fix is changing minTolerance in constants.js to something smaller, like 0.1
The actual code that seems to end up giving you this behaviour is this check that you do in line_points.js:
        if(!(fill && (pti === 0 || pti === len - 1)) &&
           clusterRefDist < getTolerance(clusterHighPt, nextPt) * minTolerance) continue;
which basically is
sqrt(x**2 + y**2) < max(3/20, width/20) and that ends up being problematic for certain widths, I'd guess.
Now, I went ahead and found a cute algorithm to decimate lines: Douglas Peucker Algorithm
But I guess that ideally, you'd let the user use their own decimators.
Now, I could maybe work on a pull request like this, but first I wanted to get your feedback here.
Perhaps it's best to tackle other more pressing issues? I just really really wanna help.
Thanks for working on plotly and hopefully I can be helpful somehow.
 ldd
on 22 Nov 2019
ldd
on 22 Nov 2019
This issue has been tagged with NEEDS SPON$OR
A community PR for this feature would certainly be welcome, but our experience is deeper features like this are difficult to complete without the Plotly maintainers leading the effort.
Sponsorship range: $5k-$10k
What Sponsorship includes:
- Completion of this feature to the Sponsor's satisfaction, in a manner coherent with the rest of the Plotly.js library and API
- Tests for this feature
- Long-term support (continued support of this feature in the latest version of Plotly.js)
- Documentation at plotly.com/javascript
- Possibility of integrating this feature with Plotly Graphing Libraries (Python, R, F#, Julia, MATLAB, etc)
- Possibility of integrating this feature with Dash
- Feature announcement on community.plotly.com with shout out to Sponsor (or can remain anonymous)
- Gratification of advancing the world's most downloaded, interactive scientific graphing libraries (>50M downloads across supported languages)
Please include the link to this issue when contacting us to discuss.
 jackparmer
on 10 Sep 2020
jackparmer
on 10 Sep 2020
Related issues
 boleslawmaliszewski
·
3Comments
boleslawmaliszewski
·
3Comments
 WG-
·
3Comments
WG-
·
3Comments
 danielsamuels
·
3Comments
etpinard
·
3Comments
danielsamuels
·
3Comments
etpinard
·
3Comments
 bryaan
·
3Comments
bryaan
·
3Comments
Most helpful comment
I don't think we should be adding more magic numbers. I feel like the solution here is simplification should never remove the first or last point in any contiguous section (ie a sub-array with no nulls). I'm guessing what's happening here is it's adding the first point, skipping the second because it's too close to the first, then realizing it only has a 1-point line and deleting the whole thing.