Plotly.js: Scattergl markers are not rendered but you can hover over them
The behavior here is similar to a previous bug I hit (issue 2999) but that bug's reproducing case no longer reproduces for me so I think this might be the same behavior from a different issue.
If I plot a large number of markers with scattergl, it works fine. If I then plot a subset, it does not. The transition point seems to be ~100k markers. That is, once I plot more than ~100k, plotting below ~100k shows the issue.
Here is a really simple reproducing example:
https://codepen.io/rhamner/pen/XQpRbx
If I use 'scatter' instead of 'scattergl' it works fine, but our actual use case is much larger than 100k points so scatter doesn't work.
The browser generates hundreds of these warnings:
[.WebGL-00000080DCBEE1F0]GL ERROR :GL_INVALID_OPERATION : glDrawArrays: attempt to access out of range vertices in attribute 0
I'm using chrome Version 73.0.3683.103 (Official Build) (64-bit). This specific sample code does not show the issue in firefox, but I do hit the issue in firefox with our actual code and I'm not sure why.
 rhamner
All 19 comments
our actual use case is much larger than 100k points so scatter doesn't work.
@rhamner it is close to how many points?
 archmoj
on 9 Apr 2019
archmoj
on 9 Apr 2019
@archmoj on the order of 1M. The actual one where I noticed this originally was ~300k points dropping down to ~15k points.
rhamner
on 9 Apr 2019
Right the cross-over should be at 1e5 pts. Something must be up with point-cluster. Note that we never cluster x/y scattergl data below 1e5 pts.
 etpinard
on 9 Apr 2019
etpinard
on 9 Apr 2019
More info -> https://github.com/gl-vis/regl-scatter2d/pull/19
etpinard
on 9 Apr 2019
Scanning through that...if I understood correctly, newPlot will not show this issue? I tried it out in that codepen I included and the issue goes away. Is that a valid stopgap?
rhamner
on 9 Apr 2019
I am having an issue similar to this. The points simply do not show up when using scattergl, but show up just fine when using scatter.
Here is a simple codepen demonstrating this. https://codepen.io/wweitzel/pen/MRJVYd
The first plot is with scatter and the second is scattergl.
 wweitzel
on 9 Apr 2019
wweitzel
on 9 Apr 2019
@wweitzel that sounds like a very different problem. I'm seeing
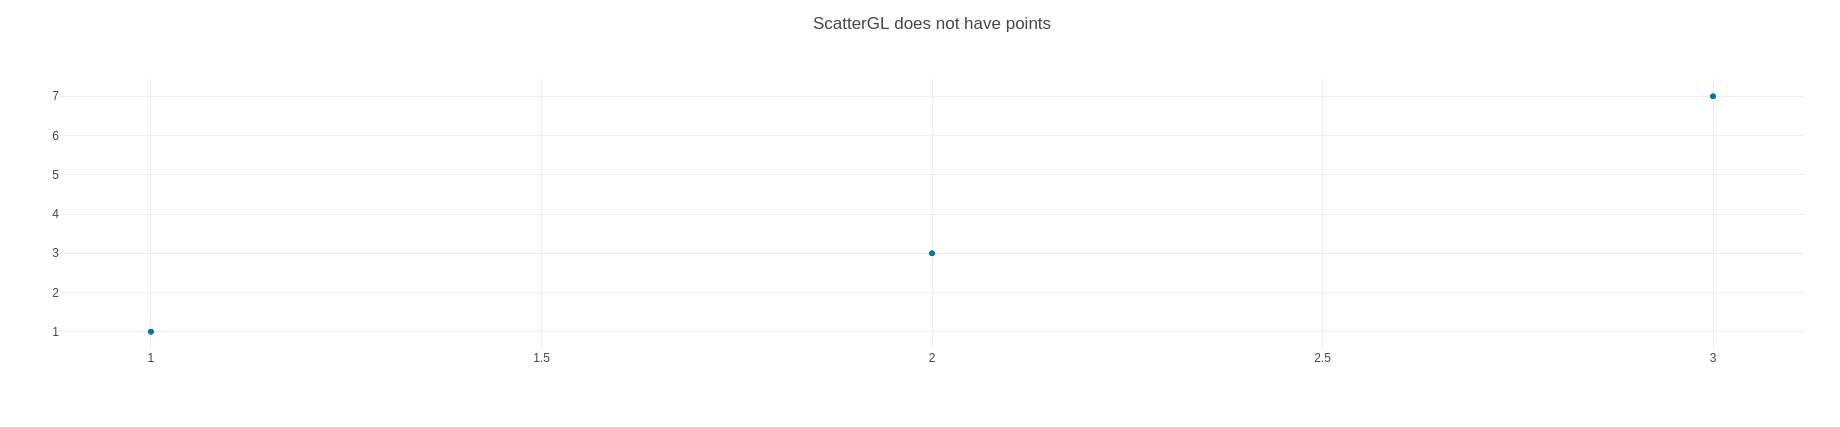
from your https://codepen.io/wweitzel/pen/MRJVYd
Something must be up with your WebGL support. Can you try to answer the following questions:
- do you see any errors in your browser console?
- which browser are you using?
- which OS are you on?
thank you.
etpinard
on 9 Apr 2019
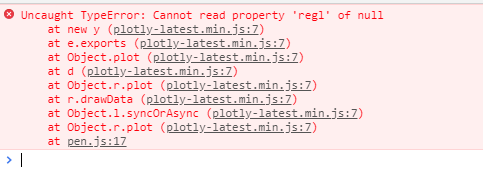
Above image is the console error
This is on Chrome version 73.0.3683.103 (Official Build) (64-bit) on windows 10, 64 bit
wweitzel
on 9 Apr 2019
That's what I thought. This isn't at all related to this issue.
See if your setup supports WebGL by going on https://get.webgl.org/ . If you see
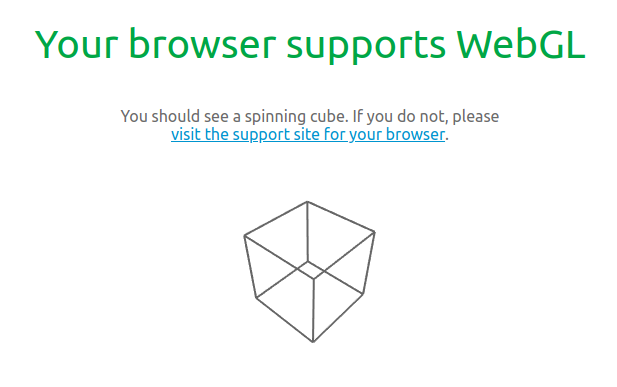
than please open a new ticket. Thanks for reporting.
etpinard
on 9 Apr 2019
You are right. Seems my setup does not support WebGL. Sorry for the misunderstanding.
wweitzel
on 9 Apr 2019
etpinard
on 22 May 2019
etpinard
on 22 May 2019
This issue appears to be (going to be) fixed (in the next release v.1.49.0) after bumping [email protected] which uses [email protected] in https://github.com/plotly/plotly.js/pull/3904.
Codepen
archmoj
on 3 Jul 2019
after bumping
[email protected]which uses[email protected]in #3904.
I doubt it. We shouldn't be calling point-cluster from regl-scatter. Our call to point-cluster is here:
etpinard
on 3 Jul 2019
But that line is not called in the codepen demonstrating the issue.
archmoj
on 3 Jul 2019
But that line is not called in the codepen demonstrating the issue.
Right, because your https://codepen.io/MojtabaSamimi/pen/VJddPx has (only) 1e4 points. See https://codepen.io/etpinard/pen/EBRpqz which has 1e5 points - and appears buggy still.
etpinard
on 4 Jul 2019
@rhamner
A candidate fix illustrated in this demo.
archmoj
on 30 Oct 2019
Closed by #4323 .
archmoj
on 31 Oct 2019
Thanks
rhamner
on 1 Nov 2019
Related issues
 empet
·
3Comments
empet
·
3Comments
 maxwell8888
·
3Comments
maxwell8888
·
3Comments
 n-riesco
·
3Comments
n-riesco
·
3Comments
 tim-sauchuk
·
3Comments
tim-sauchuk
·
3Comments
 jonmmease
·
3Comments
jonmmease
·
3Comments
Most helpful comment
Right, because your https://codepen.io/MojtabaSamimi/pen/VJddPx has (only) 1e4 points. See https://codepen.io/etpinard/pen/EBRpqz which has 1e5 points - and appears buggy still.