Plotly.js: mathjax doesn't render for firefox

originally reported in https://github.com/plotly/streambed/issues/2674, reported again in https://github.com/plotly/dash-core-components/pull/194
 chriddyp
All 6 comments
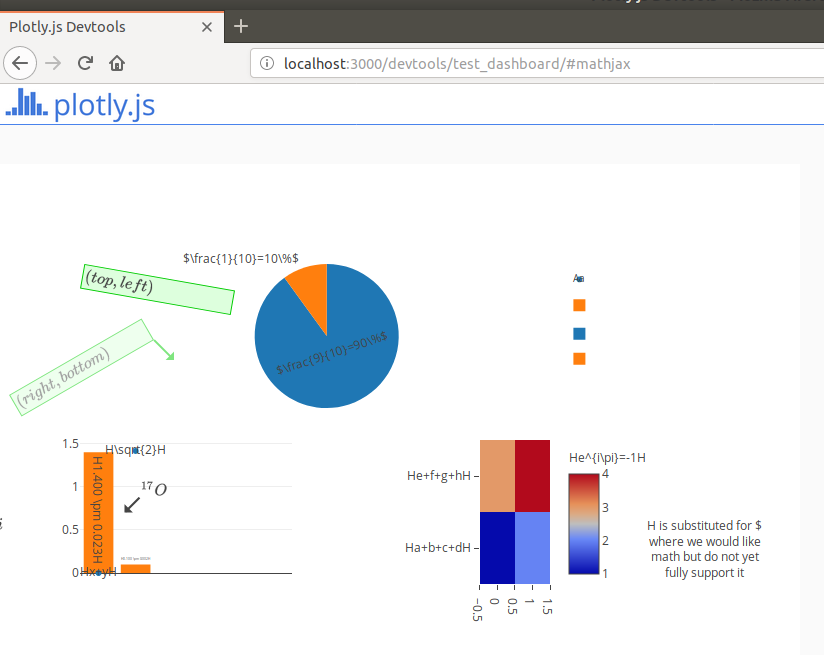
Huh, if you open http://localhost:3000/devtools/test_dashboard/#mathjax in FF it looks like the only place it works is in annotations, and not even all of those. Interestingly that mock doesn't put any MathJax into the legend, can't recall why, perhaps I had a problem with it in the image server? But yeah, on Chrome it works in the legend.
This is probably a getBoundingClientRect issue, you can see at least one of the missing labels peeking in from the left edge, the others are probably drawn somewhere but completely clipped.
In FF:

In Chrome:

 alexcjohnson
on 7 May 2018
alexcjohnson
on 7 May 2018
This ticket is still relevant after https://github.com/plotly/plotly.js/pull/3018
 etpinard
on 18 Sep 2018
etpinard
on 18 Sep 2018
From https://community.plot.ly/t/latex-in-axis-title-appears-at-wrong-position-in-firefox/15504, axis titles also appear off in FF
etpinard
on 12 Nov 2018
I can confirm with latest. Here is an example that does not render properly:
<meta charset="UTF-8">
<head>
  <script type="text/javascript" async
    src="https://cdnjs.cloudflare.com/ajax/libs/mathjax/2.7.5/MathJax.js?config=TeX-MML-AM_CHTML">
  </script>
  <script> window.PlotlyConfig = {MathJaxConfig: 'local'} </script>
  <script src="https://cdn.plot.ly/plotly-latest.min.js"></script>
</head>
<body>
  <div id="myDiv"><!-- Plotly chart will be drawn inside this DIV --></div>
  <script>
    var trace1 = {
      x: [.01, .1, 1, 10, 100],
      y: [1000, 500, 250, 125, 62.5],
      type: 'scatter'
    };
    var data = [trace1];
    var layout = {
      xaxis: {
        title: '$c$',
      },
      yaxis: {
        title: '$a^2+b^2$',
      }
    };
    Plotly.plot('myDiv', data, layout);
  </script>
</body>
 ibell
on 22 Mar 2019
ibell
on 22 Mar 2019
Updating MathJax from its 2.3.1 version to the latest 2.7.5 yields:

We are still missing titles, but the bar chart is much better. I will need to investigate why exactly the titles are not displayed in FF.
To be continued!
 antoinerg
on 17 Apr 2019
antoinerg
on 17 Apr 2019
This is probably a
getBoundingClientRectissue, you can see at least one of the missing labels peeking in from the left edge, the others are probably drawn somewhere but completely clipped.
As @alexcjohnson hinted at, it is indeed a getBoundingClientRect issue. Basically, we need to patch this function:
https://github.com/plotly/plotly.js/blob/172c3e6e6691b0fff362cbe55d32124c6130ef9f/src/lib/svg_text_utils.js#L22-L24
antoinerg
on 17 Apr 2019
Related issues
 deecay
·
3Comments
chriddyp
·
3Comments
deecay
·
3Comments
chriddyp
·
3Comments
 jonmmease
·
3Comments
jonmmease
·
3Comments
 danielsamuels
·
3Comments
danielsamuels
·
3Comments
 pynklu
·
3Comments
pynklu
·
3Comments