Platformio-core: The debugging of the Arduino Framework fails with FTDI Chip and ESP WROVER KIT
What kind of issue is this?
[ ] Feature Request.
Start by telling us what problem you’re trying to solve. Often a solution
already exists! Don’t send pull requests to implement new features without first getting our
support. Sometimes we leave features out on purpose to keep the project small.[X] PlatformIO Core.
If you’ve found a bug, please provide an information below.
You can erase any parts of this template not applicable to your Issue.
Configuration
Operating system: Windows 7 (the bug has been seen also on Win 8.1)
PlatformIO Version (platformio --version): PlatformIO, version 3.6.1a5 (upgraded to dev version)
Description of problem
The debugging of the Arduino Framework fails with FTDI Chip and ESP WROVER KIT
Steps to Reproduce
- Open arduino blinky example with esp wrover kit (see platformio.ini)
- Configure FTDI Chip as debugger as described in the forum: https://community.platformio.org/t/esp32-pio-unified-debugger/4541/78
(Normally the debugger sould work with ESP-IDF) - Put a breakpoint in line 15
pinMode(LED_BUILTIN, OUTPUT); - start debug session
- Put a breakpoint in line 21
digitalWrite(LED_BUILTIN, HIGH); - Push F5
Actual Results
Instead of stopping a the breakpoint line 21, it stopps in the ASM code below

If you push start again it never stops, an the led does not blink
Expected Results
It should stops at the line 21
If problems with PlatformIO Build System:
The content of platformio.ini:
[env:esp wrover kit]
platform = espressif32
framework = arduino
board = esp-wrover-kit
monitor_speed = 115200
build_flags =
    ; https://docs.espressif.com/projects/esp-idf/en/latest/get-started/get-started-wrover-kit.html#rgb-led
    -D LED_BUILTIN=2
debug_tool = ftdi
Source file to reproduce issue:
/*
 * Blink
 * Turns on an LED on for one second,
 * then off for one second, repeatedly.
 */

#include <Arduino.h>

// Set LED_BUILTIN if it is not defined by Arduino framework
// #define LED_BUILTIN 2

void setup()
{
  // initialize LED digital pin as an output.
  pinMode(LED_BUILTIN, OUTPUT);
}

void loop()
{
  // turn the LED on (HIGH is the voltage level)
  digitalWrite(LED_BUILTIN, HIGH);
  // wait for a second
  delay(500);
  // turn the LED off by making the voltage LOW
  digitalWrite(LED_BUILTIN, LOW);
   // wait for a second
  delay(1000);
}
Additional info
More info about this bug in the forum: https://community.platformio.org/t/esp32-pio-unified-debugger/4541/57
 Navis-Raven
All 26 comments
Could you try the latest openOCD for ESP32? See https://github.com/espressif/openocd-esp32/releases
Please replace it in $HOMEDIR/.platformio/packages/tool-openocd-esp32 and keep package.json file unchanged.
If it does not work, just remove this package at all. PlatformIO Core will install the latest from our registry.
 ivankravets
on 10 Oct 2018
ivankravets
on 10 Oct 2018
I'll try this as soon as my PC is repaired (I have some PC problems)
Navis-Raven
on 13 Oct 2018
@ivankravets
Test 1:
Please replace it in $HOMEDIR/.platformio/packages/tool-openocd-esp32 and keep package.json file unchanged.
Result: nothing changed
Test 2:
just remove this package at all.
I removed open-ocd packages.
Results: nothing changed same problem
Navis-Raven
on 20 Oct 2018
Please open PlatformIO IDE Terminal and type
pio update
pio upgrade --dev
Does it work now?
ivankravets
on 22 Oct 2018
@ivankravets no
Navis-Raven
on 24 Oct 2018
Could you try to "Clean" project and build again? Or change something in platformio.ini, PlatformIO will automatically rebuild project. This issue should be fixed recently.
ivankravets
on 26 Oct 2018
no its still here
Navis-Raven
on 30 Oct 2018
I’m trying to build and debug Arduino app with ESP32. Es development board I’m using Esp32-Wrover-Kit
My development system:
Lenovo T460 with Ubuntu 18.04
system (read from VSCode)
Version: 1.29.1
Commit: bc24f98b5f70467bc689abf41cc5550ca637088e
Date: 2018-11-15T19:07:43.495Z
Electron: 2.0.12
Chrome: 61.0.3163.100
Node.js: 8.9.3
V8: 6.1.534.41
Architecture: x64PIO
platformio --version
PlatformIO, version 3.6.2Debugging LED blink app
Experience: the same as depicted in github issue by Navis-Ravenchanging line 271 in main.py to
env.Append(UPLOADERFLAGS=[image[0], “%s” % image[1]])
as sugessted by Botofancalin in
https://community.platformio.org/t/esp32-pio-unified-debugger/4541/78
After start Debug session in PlatformIO, results in :
SyntaxError> Non-ASCII character ‘\xe2’ in file.../builder/main.py on line 271, but no encoding declared
To compare, the debugging of ESP32 in Eclipse with freeRTOS app, as described in in esp-idf documentation is working OK.
Jan
 JanDebiec
on 9 Dec 2018
JanDebiec
on 9 Dec 2018
@JanDebiec have you tried upstream version? https://docs.platformio.org/en/latest/platforms/espressif32.html#upstream
ivankravets
on 14 Dec 2018
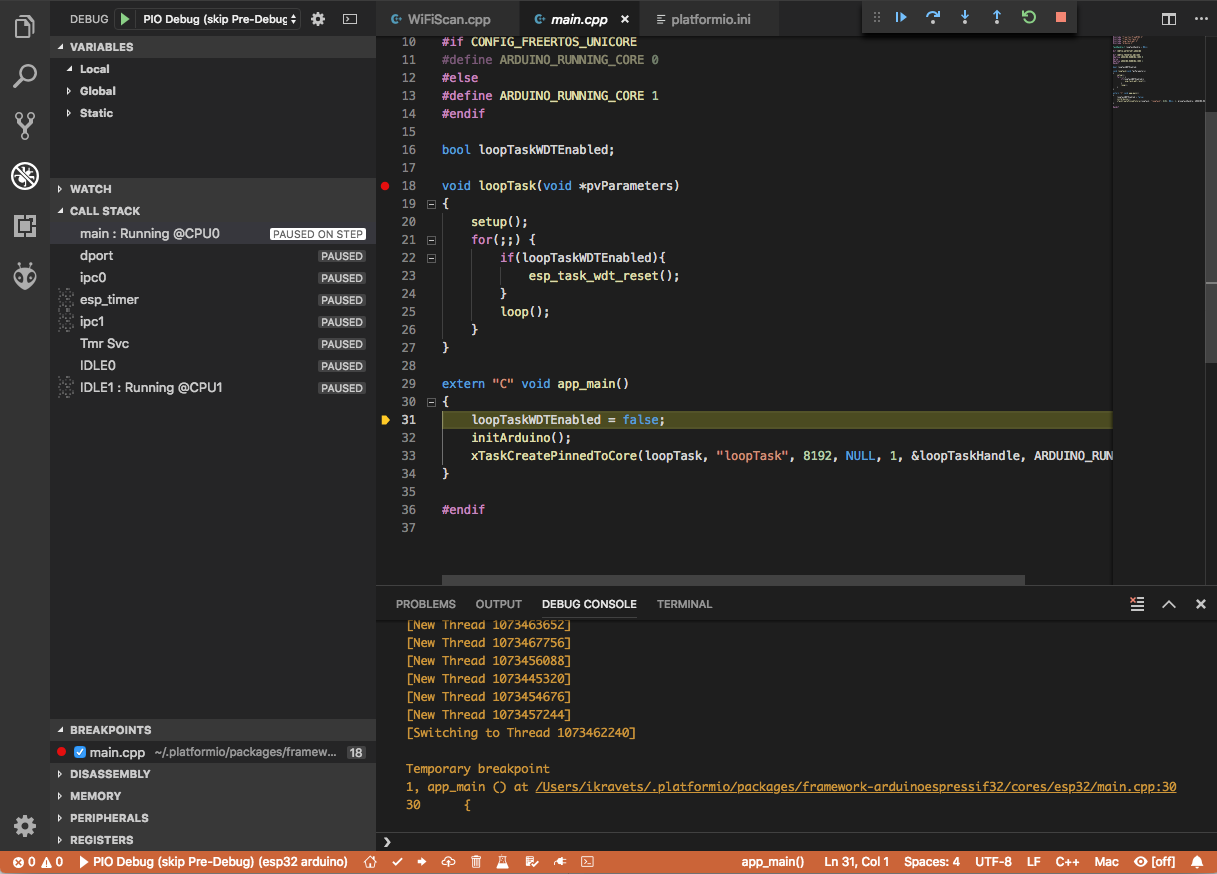
today I've updated vscode and PIO, PIO version 3.6.3
the experience the same as before. I attach the screenshot
With the same hardware configuration, Wrover-Kit and Eclipse, the debugging of ESP32 project based on ESP-IDF is working OK.
I'll try as you suggested the upstream version
In the next days, I'll try another hardware with PIO: debugger Olimex with ESP32 dev-kitc

JanDebiec
on 18 Dec 2018
Could you try to use in platformio.ini
[env:myenv]
platform = [email protected]
See https://github.com/platformio/platform-espressif32/releases
Does it work? I see that we enabled PSRAM for this board recently https://github.com/platformio/platform-espressif32/blob/develop/boards/esp-wrover-kit.json#L4
ivankravets
on 18 Dec 2018
with upstream version, debugging is not better
two screenshots, first from start-Debugging, second after F9, third: second time F9

third after secon F9
JanDebiec
on 18 Dec 2018
and with platform = [email protected]?
ivankravets
on 18 Dec 2018
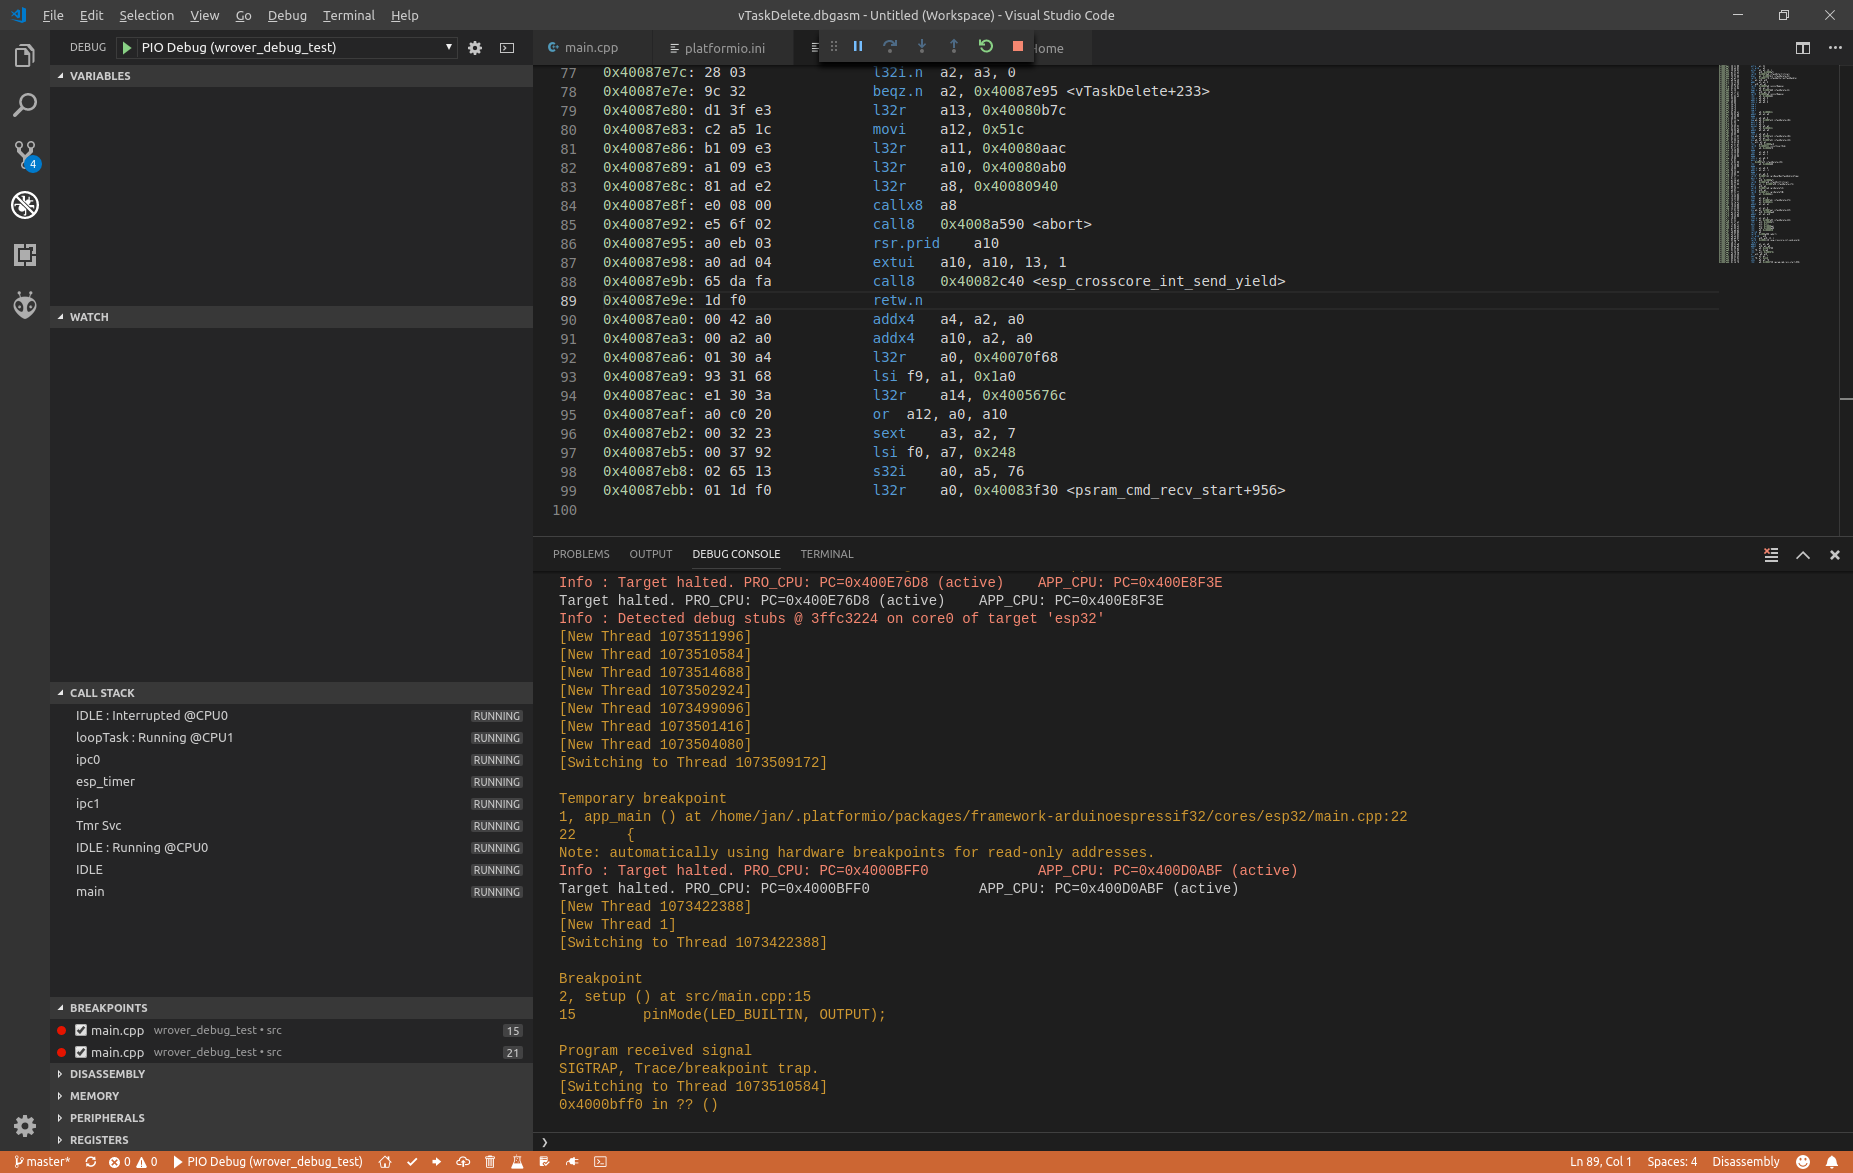
Hi Ivan,
with platform = [email protected]
the similar experience, can not be debugged, but another infos in debug-console
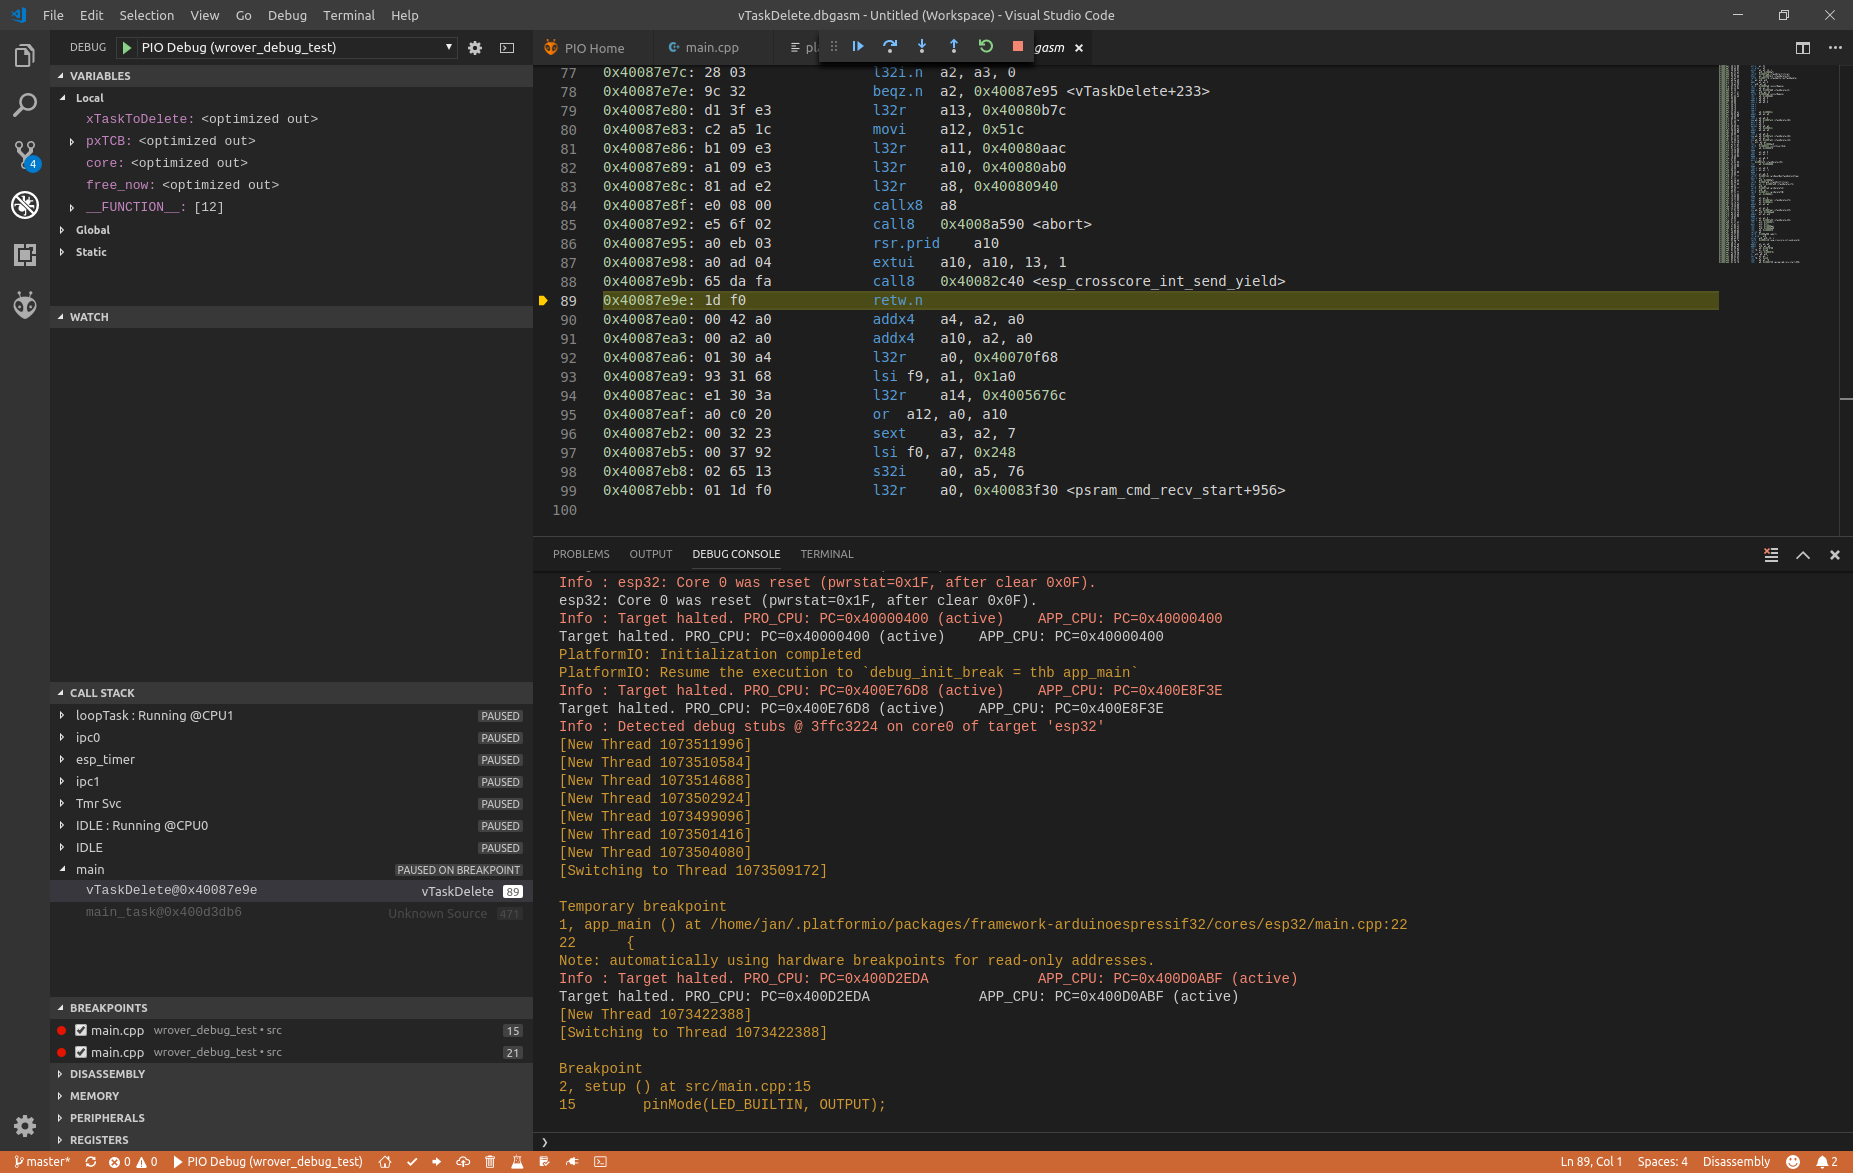
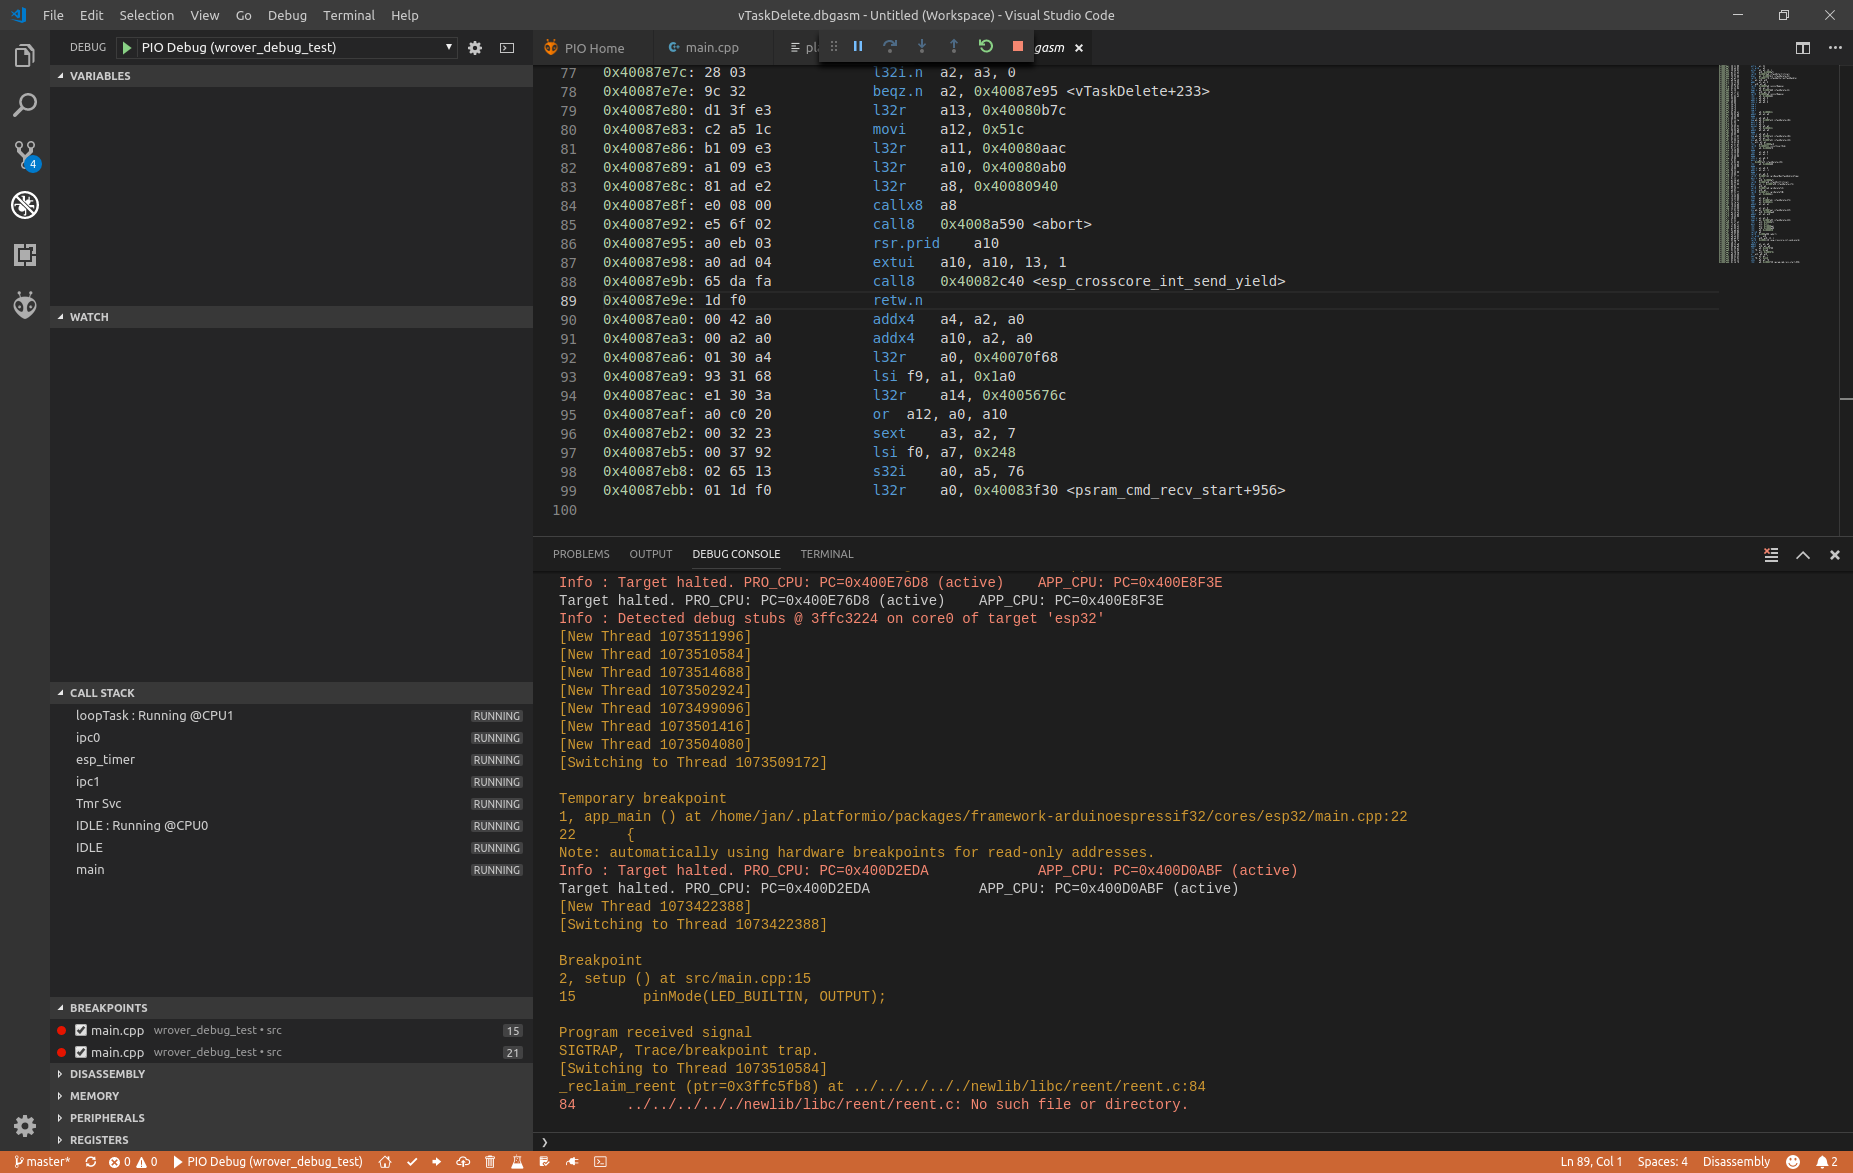
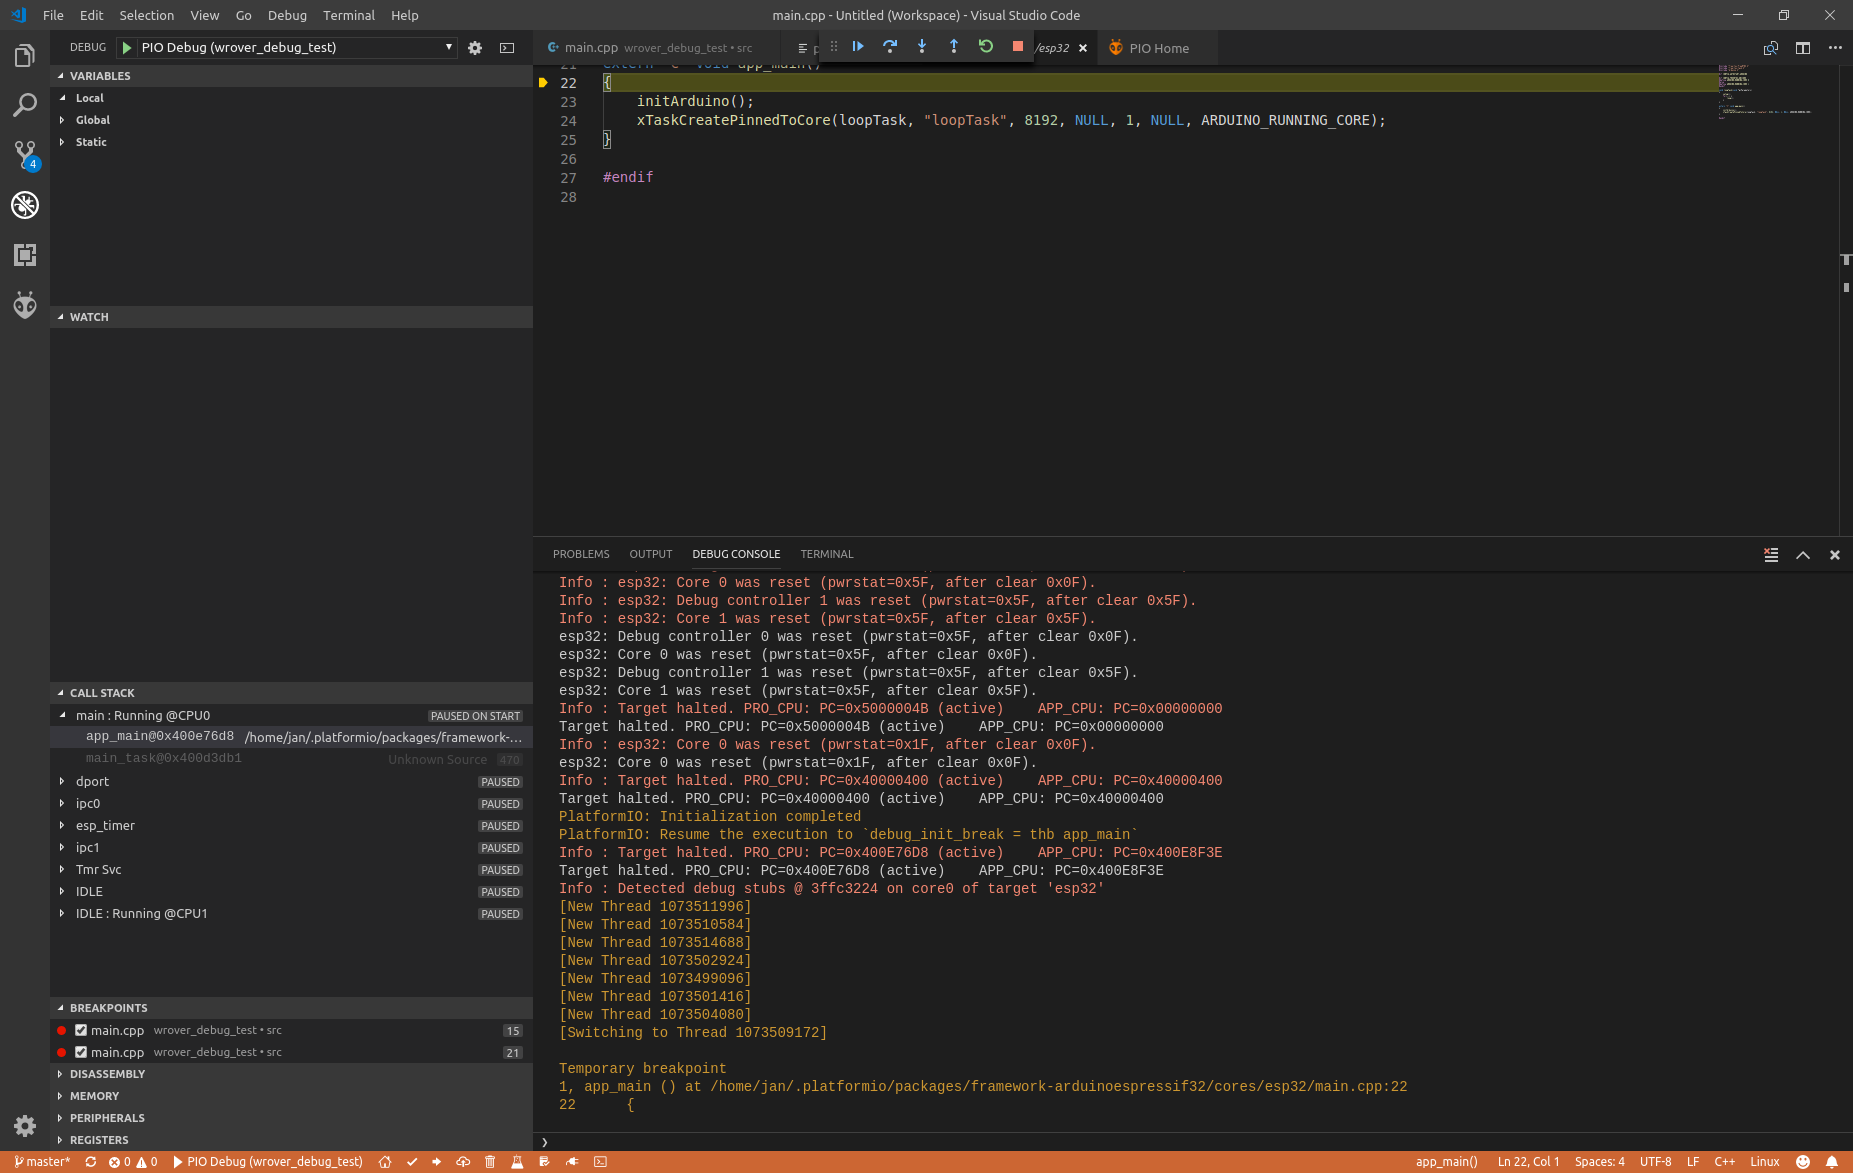
Attached three screenshots:
one after StartDebugging, stopped @ app_main,
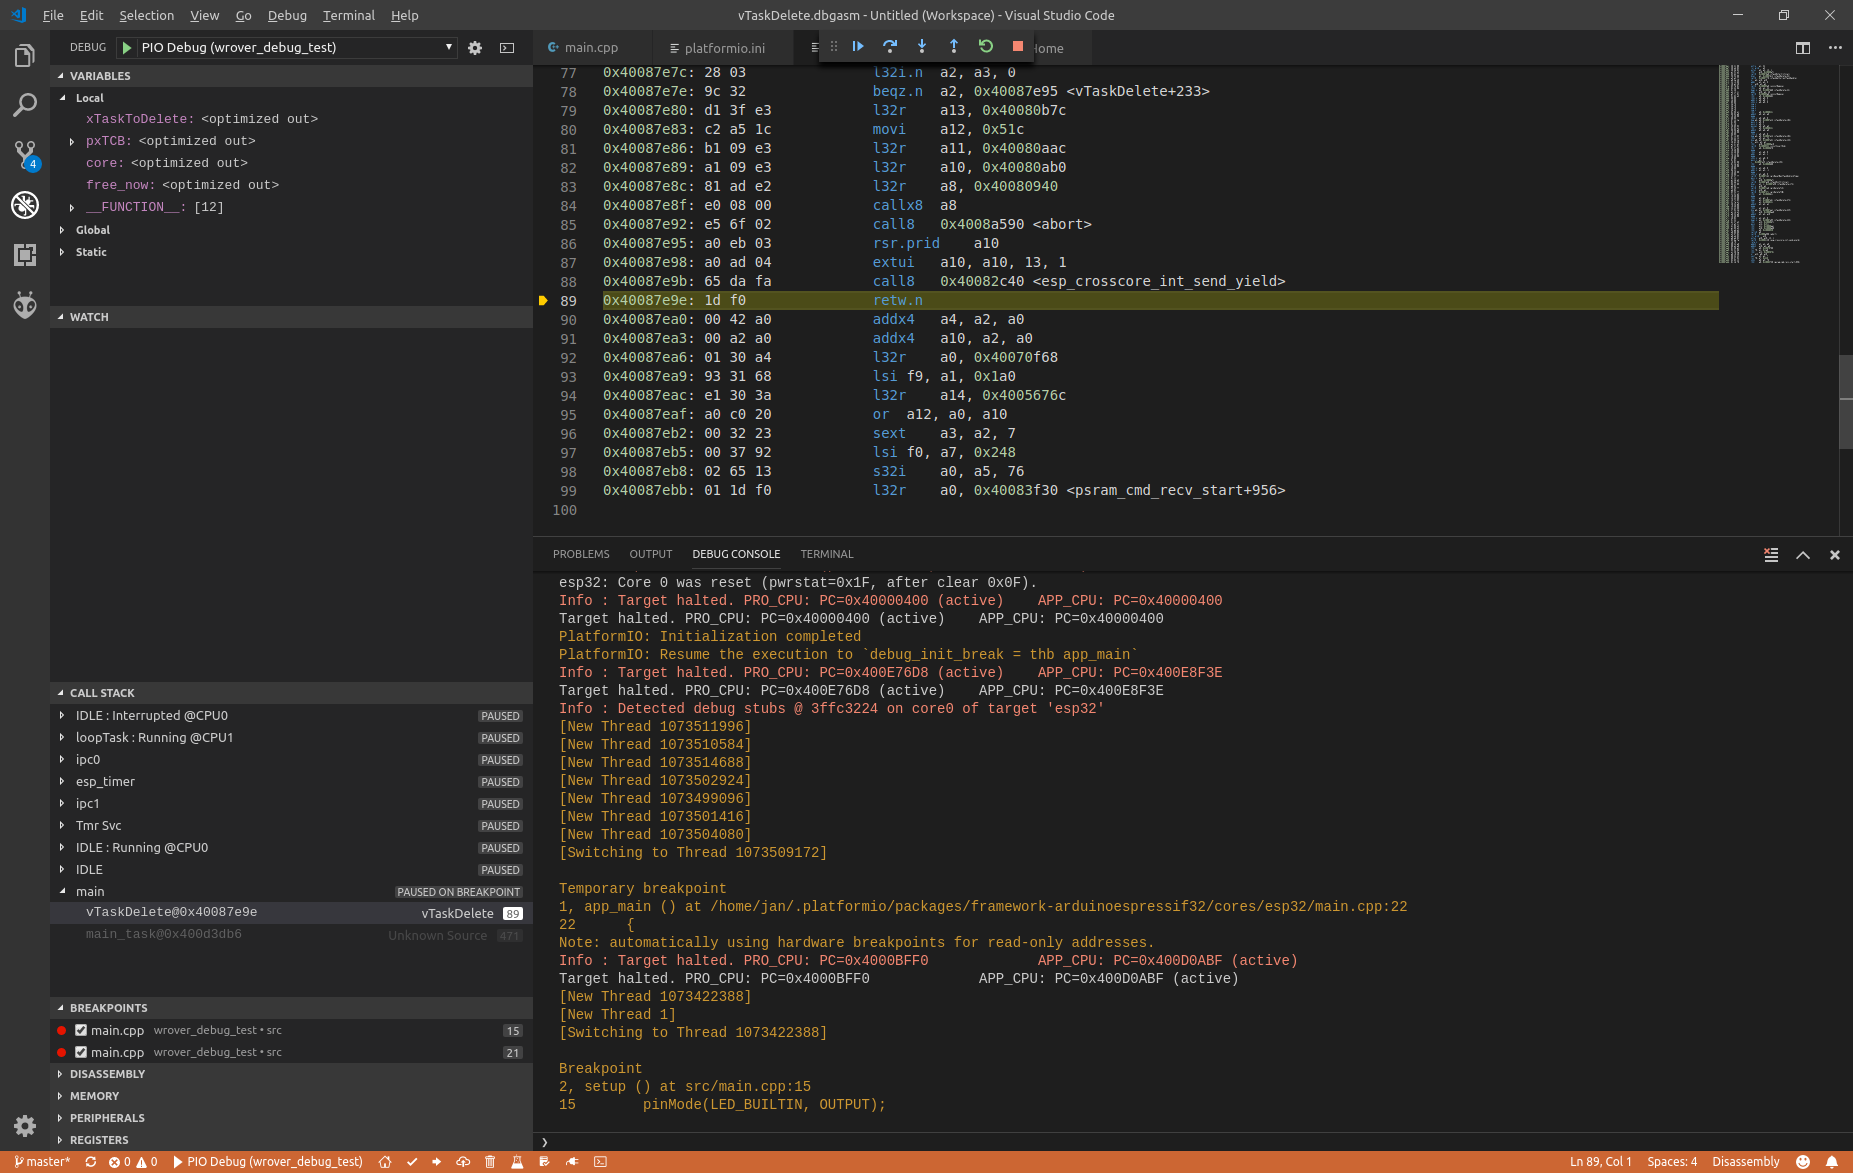
second at line 89,
again F9 and second time at line 89
As said before, i'll try to check another debugger and esp32 board.
I'll let you know about results
JanDebiec
on 18 Dec 2018
Please mail me directly to [email protected].
ivankravets
on 18 Dec 2018
@ivankravets Has there been any progress on this? Last autumn I bought an Olimex ARM-USB-OCD-H debugger to use for ESP32 debugging with PlatformIO. I got it working then but now when I finally have the time and motivation to dig more into it I can't get it to work anymore. I even had the wires still connected as I had hard time figuring them out back then.
Similarly the @Navis-Raven reported, the debugger stops at the default breakpoint. If I press F10, I get to the next line just fine but if I press continue, expecting it to stop at my breakpoint inside the void setup() function, it'll jump somewhere in vTaskDelete.dbgasm from where I cannot continue anymore.
If I restart the debugging several times, randomly (less than 1/10) it might stop at my breakpoint and I can step the code there a bit. But eventually only "pause" and "stop" buttons will be available.
I've tried it with:
platform = espressif32
and with
platform = https://github.com/platformio/platform-espressif32.git#feature/stage
The board is "mhetesp32minikit".
 ristomatti
on 6 Feb 2019
ristomatti
on 6 Feb 2019
Typically when the debugging gets stuck, this is what's in the log:
Breakpoint
2, setup () at src/olimex-debug.cpp:6
6     Serial.begin(230400);
Program received signal
SIGTRAP, Trace/breakpoint trap.
[Switching to Thread 1073463652]
idle_hook_cb () at /Users/ficeto/Desktop/ESP32/ESP32/esp-idf-public/components/esp32/task_wdt.c:79
79  /Users/ficeto/Desktop/ESP32/ESP32/esp-idf-public/components/esp32/task_wdt.c: No such file or directory.
So it seems like it attempted to stop at the breakpoint I had set but then jumped to the disassembled code and spit out that error.
ristomatti
on 6 Feb 2019
@ivankravets Nevermind, I got it working! I basically just brute forced through different settings/options without having much clue what I am going. The trick for me was to disable RTOS support in ~/.platformio/packages/tool-openocd-esp32/share/openocd/scripts/board/esp32-wroom.cfg:
# To disable RTOS support, uncomment the following line
set ESP32_RTOS none
Could you try the next?
- Please collapse Registers view before debugging session
- Start debugging, select
main:...thread in the CALLSTACK view and do 1 step - Set breakpoint at
void loopTask(void *pvParameters)in main.cpp - Do "Continue", you should stop at
loopTask - Now you can debug Arduino setup/loop code.
Did it help?
ivankravets
on 7 Feb 2019
Sure, I can try tomorrow. I'll report back then.
ristomatti
on 7 Feb 2019
@ivankravets Sorry, it does not help. Just to make sure I did it correctly:
- I started debug, then it halts at
extern "C" void app_main()
- I added a breakpoint on the line
loopTaskWDTEnabled = false;and pressed "Continue" - Execution halts on the line, i then press contnue
- View stays on main.cpp, only _Pause_, _Restart_ and _Stop_ buttons are active. Debug console shows:
Breakpoint
5, app_main () at /home/ristomatti/.platformio/packages/framework-arduinoespressif32/cores/esp32/main.cpp:31
31      loopTaskWDTEnabled = false;
Warn : xtensa_add_breakpoint: max HW slot reached, slot=2
Info : Target halted. PRO_CPU: PC=0x4009171A (active)    APP_CPU: PC=0x400E996E
Warn : xtensa_add_breakpoint: max HW slot reached, slot=2
Info : Target halted. PRO_CPU: PC=0x4009171A (active)    APP_CPU: PC=0x400E996E
Info : Target halted. PRO_CPU: PC=0x400E996E             APP_CPU: PC=0x400D0C59 (active)
Target halted. PRO_CPU: PC=0x400E996E             APP_CPU: PC=0x400D0C59 (active)
[New Thread 1073447000]
[Switching to Thread 1073447000]
Info : Target halted. PRO_CPU: PC=0x400E996E             APP_CPU: PC=0x4009171A (active)
Info : Target halted. PRO_CPU: PC=0x400E996E             APP_CPU: PC=0x4009171A (active)
Breakpoint
2, setup () at src/olimex-debug.cpp:7
7     pinMode(LED_BUILTIN, OUTPUT);
But like I mentioned on my earlier post, if I remove the comment on esp-wroom.cfg to disable RTOS support, then it works. To me it looks like the debugger is trying to go through some binary only code from the ESP32 core, and then fails for some reason or another.
I'm not interested in the RTOS internals while debugging Arduino code (for now at least), so this is a good enough workaround for me. Even though the issue is about ESP-WROVER KIT, maybe this could work for @Navis-Raven also as the symptoms are so similar?
ristomatti
on 7 Feb 2019
I forgot to mention that when I have RTOS support disabled, the only thing I need to do is set some breakpoints to my Arduino code and press _Continue_ after the default breakpoint. Then everything works as expected. I did not need to do anything on the call stack or the registers views, I can even have them closed.
Aside: while repeatedly trying this yesterday I got really frustrated with having to open the debug console manually after a quick restart. It turns out there's a setting that will make it automatically open on each session start and not only on the first session start (which is the default setting):

ristomatti
on 7 Feb 2019
- I added a breakpoint on the line
loopTaskWDTEnabled = false;and pressed "Continue"
No, please set breakpoint at void loopTask(void *pvParameters). You should stop at setup();, line 20 in main.cpp
ivankravets
on 8 Feb 2019
Uh, sorry I read your original reply too quickly it seems. And you're absolutely correct - it does work. Awesome! It's obvious how busy you are, so I don't mind if you don't reply to this but I would love to understand:
- Why does it it work when the first breakpoint is set there instead of just inside
void setup()where it goes on the next line? It worked also by setting it the breakpoint directly on line 20 atsetup();BTW. - Would it cause some issues later on if I were to just disable the RTOS support (other than not being able to debug RTOS internals)?
This should probably be mentioned here if it's a necessary step:
https://docs.platformio.org/en/latest/tutorials/espressif32/arduino_debugging_unit_testing.html#debugging-the-firmware ?
Regardless if you can take the time to answer - thank you for all the impressive work you've put into PlatformIO! It gives the chance to people like me to do things which we might never have time to dig into otherwise. Being able to step through code makes a huge dfiference!
ristomatti
on 8 Feb 2019
See updated docs https://docs.platformio.org/en/latest/tutorials/espressif32/arduino_debugging_unit_testing.html#debugging-the-firmware
Thanks!
ivankravets
on 9 Feb 2019
@ivankravets thanks, at last there is a solution.
but why it takes all these steps to debug ?
Is it because of an imperfection of open-ocd ? or a bug ?
Navis-Raven
on 15 Feb 2019
Related issues
 maxgerhardt
·
4Comments
maxgerhardt
·
4Comments
 malachib
·
3Comments
malachib
·
3Comments
 simonvanderveldt
·
3Comments
simonvanderveldt
·
3Comments
 0x587
·
3Comments
Navis-Raven
·
3Comments
0x587
·
3Comments
Navis-Raven
·
3Comments
Most helpful comment
See updated docs https://docs.platformio.org/en/latest/tutorials/espressif32/arduino_debugging_unit_testing.html#debugging-the-firmware
Thanks!