Pipeline: Memory requirement increase for the same pipeline using beta
Expected Behavior
I shouldn't be requiring so much more memory for the same Tekton Pipeline - in my case I had to both expand my cluster's memory settings (from 2 GB to 12 GB) and introduce LimitRange
Update: see my post involving the Prometheus graphs, the increase isn't so big as I figured actually, and in my case using the LimitRanges wasn't helpful
Actual Behavior
As part of https://github.com/tektoncd/dashboard/pull/1265#issuecomment-614719583 I noticed consistent out of memory problems running the webpack stage of our release pipeline used to publish the Tekton Dashboard
I had a 2 GB Docker Desktop cluster at the time, with no LimitRange set
I then added a LimitRange trying 1 GB limits, 1.5 GB limits, and then 2 GB limits - all but the 2 GB limit settings resulted in the same out of memory problems, requiring me to expand my cluster memory allocation limit to 12 GB
Here are my LimitRange settings when it worked - lemme know if I'm doing something crazy here because I'd love to be wrong!
With 1.5Gi for every memory mention, or 1Gi, my Task went OoM (so specifically you get an error 137 from the above mentioned webpack command used in a step).
apiVersion: v1
kind: LimitRange
metadata:
  name: limit-mem-cpu-per-container
spec:
  limits:
  - max:
      cpu: "800m"
      memory: "2Gi"
    min:
      cpu: "100m"
      memory: "2Gi"
    default:
      cpu: "700m"
      memory: "2Gi"
    defaultRequest:
      cpu: "110m"
      memory: "2Gi"
    type: Container
---
apiVersion: tekton.dev/v1beta1
kind: Pipeline
metadata:
  name: dashboard-release
spec:
  params:
    - name: package
      description: package to release
      default: github.com/tektoncd/dashboard
    - name: imageRegistry
      default: gcr.io/tekton-releases
    - name: versionTag
      description: The X.Y.Z version that the artifacts should be tagged with
    - name: bucketName
      description: The name of the bucket to use
  resources:
    - name: dashboard-source-repo
      type: git
    - name: bucket-for-dashboard
      type: storage
    - name: builtDashboardImage
      type: image
  tasks:
    - name: build
      taskRef:
        name: build-tekton-dashboard
      resources:
        inputs:
          - name: dashboard-source-repo
            resource: dashboard-source-repo
        outputs:
          - name: dashboard-source-repo
            resource: dashboard-source-repo
    - name: publish-images
      runAfter: [build]
      taskRef:
        name: publish-tekton-dashboard
      params:
        - name: pathToProject
          value: $(params.package)
        - name: versionTag
          value: $(params.versionTag)
        - name: imageRegistry
          value: $(params.imageRegistry)
        - name: bucketName
          value: $(params.bucketName)
      resources:
        inputs:
          - name: dashboard-source-repo
            resource: dashboard-source-repo
            from: [build]
          - name: bucket-for-dashboard
            resource: bucket-for-dashboard
        outputs:
          - name: bucket-for-dashboard
            resource: bucket-for-dashboard
          - name: builtDashboardImage
            resource: builtDashboardImage
Steps to Reproduce the Problem
- Run the Tekton Dashboard release process using the existing (checked in) v1alpha1 based pipeline (done by applying the
tektonfolder and following the readme in there). Observe no failing build. - Reset your Kubernetes cluster so you can apply v1beta1 of Tekton Pipelines
- Apply the PR from @AlanGreene (https://github.com/tektoncd/dashboard/pull/1265) - which switches to using v1beta1 resources
Additional Info
Kubernetes version:
1.15.5Output of
kubectl version:
Client Version: version.Info{Major:"1", Minor:"17", GitVersion:"v1.17.0", GitCommit:"70132b0f130acc0bed193d9ba59dd186f0e634cf", GitTreeState:"clean", BuildDate:"2019-12-07T21:20:10Z", GoVersion:"go1.13.4", Compiler:"gc", Platform:"darwin/amd64"}
Server Version: version.Info{Major:"1", Minor:"15", GitVersion:"v1.15.5", GitCommit:"20c265fef0741dd71a66480e35bd69f18351daea", GitTreeState:"clean", BuildDate:"2019-10-15T19:07:57Z", GoVersion:"go1.12.10", Compiler:"gc", Platform:"linux/amd64"}
- Tekton Pipeline version:
Between 0.10.1 and 0.11.1
🤞 it's just me, otherwise the increase is huuuge!
 a-roberts
All 14 comments
One "guess" might be the entrypoint "logging" methods.. maybe ?
Looking at the changes, the only change related to the entrypoint is https://github.com/tektoncd/pipeline/commit/d7820215df7132b168c84a3b03a586f079eb098e#diff-4dbf8b042dd60907e07ee142e3c31b40
/kind bug
 vdemeester
on 16 Apr 2020
vdemeester
on 16 Apr 2020
Just wanted to add here that specifying a LimitRange minimum for containers applies that much memory to each container part of a TaskRun/entire PipelineRun. So that is most likely the cause. Would it perhaps make more sense to not specify a minimum?
In that case, the max memory values for CPU, storage, and memory specified by a container would be the total amount of memory specified and then utilized by each containers as part of TaskRun.
So maybe try specifying resources to allocate directly on the step defined via your Task.
 danielhelfand
on 17 Apr 2020
danielhelfand
on 17 Apr 2020
Just wanted to add here that specifying a LimitRange minimum for containers applies that much memory to each container part of a TaskRun/entire PipelineRun. So that is most likely the cause. Would it perhaps make more sense to not specify a minimum?
In that case, the max memory values for CPU, storage, and memory specified by a container would be the total amount of memory specified and then utilized by each containers as part of TaskRun.
So maybe try specifying resources to allocate directly on the step defined via your Task.
Yeah definitely, and I'm gonna play with the numbers some more today, I bet I can narrow it down to just needing 2 GB max for the one container and not however much the default was so I can add more information here then (so perhaps it's gone from needing a maximum of 1 GB to 2 GB, while that's a 2x jump at least it wouldn't be 6x!). Thanks for the suggestion
a-roberts
on 17 Apr 2020
Done another experiment that's a little more fine-grained.
So I set my max amount as per @danielhelfand's suggestion to 2 GB, instead of 1 GB, LimitRange now resembles:
apiVersion: v1
kind: LimitRange
metadata:
  name: limit-mem-cpu-per-container
spec:
  limits:
  - max:
      cpu: "800m"
      memory: "2Gi"
    min:
      cpu: "100m"
      memory: "1Gi"
    default:
      cpu: "700m"
      memory: "1Gi"
    defaultRequest:
      cpu: "110m"
      memory: "1Gi"
    type: Container
---
I get the same out of memory problem though, I'm wondering if it's not growing in time - if this worked I planned to then start shifting the memory amount lower and lower to see what the threshold is.
For not setting minimums, I first had to delete my existing Tekton resources (kinda weird, so kubectl delete on my tekton resources folder), then I applied this and ran my Pipeline again:
apiVersion: v1
kind: LimitRange
metadata:
  name: limit-mem-cpu-per-container
spec:
  limits:
  - max:
      cpu: "800m"
      memory: "2Gi"
    type: Container
I spotted something watching docker stats
... k8s_step-build-static_dashboard-release-run-5s92f-build-82hxr-pod-wzxpl_default_c87243b2-c8f2-4804-9ad0-61c67e0166aa_0 89.88% 496.5MiB / 2GiB 24.24% 0B / 0B 0B / 0B 73
this keeps growing at a rate of 3 MB per second, It's the npm ci step in our Task.
It becomes
... k8s_step-build-static_dashboard-release-run-5s92f-build-82hxr-pod-wzxpl_default_c87243b2-c8f2-4804-9ad0-61c67e0166aa_0 90.51% 595.5MiB / 2GiB 29.08%
then stabilises and completes at
... k8s_step-build-static_dashboard-release-run-5s92f-build-82hxr-pod-wzxpl_default_c87243b2-c8f2-4804-9ad0-61c67e0166aa_0 85.21% 670.1MiB / 2GiB 32.72%
This appears in the Task's output:
[build : build-static] (node:319) MaxListenersExceededWarning: Possible EventEmitter memory leak detected. 11 SIGINT listeners added. Use emitter.setMaxListeners() to increase limit
and then job fails due to a missing script problem, when it is defined in our package.json:
[build : build-static] npm ERR! missing script: bootstrap:ci
[build : build-static] npm ERR!
[build : build-static] npm ERR! Did you mean this?
[build : build-static] npm ERR!     bootstrap
[build : build-static]
I think for our case (the release pipeline) I need to chat with @AlanGreene about what's happening here.
For this particular issue from a pure Tekton Pipelines perspective, I'm wondering what a simpler test case would be and if we'd benefit from something like kubectl top with heapster installed, just using docker stats is too crude by the looks of it.
Update: no longer seeing the weird missing script issue, but do consistently see
[build : build-static] (42/42) Wrote github.com/openshift/[email protected]

[build : copy-files-to-output-resource] Input source path=/workspace/go/src/github.com/tektoncd/dashboard
[build : copy-files-to-output-resource] Output source path=/workspace/output/dashboard-source-repo


(base) Adams-MBP:dashboard aroberts$
(base) Adams-MBP:dashboard aroberts$ kgp
NAME                                                READY   STATUS      RESTARTS   AGE
dashboard-release-run-djspb-build-h5r5m-pod-ccqw6   0/6     OOMKilled   0          45m
dashboard-release-run-pgcjq-build-d72jk-pod-rghm6   0/6     OOMKilled   0          23m
with only
---
apiVersion: v1
kind: LimitRange
metadata:
  name: limit-mem-cpu-per-container
spec:
  limits:
  - max:
      cpu: "800m"
      memory: "2Gi"
    type: Container
Can you provide information from the Pod of the TaskRun doing a kubectl describe pod? Could help point out the resources being allocated for each container.
danielhelfand
on 17 Apr 2020
Can you provide information from the Pod of the TaskRun doing a kubectl describe pod? Could help point out the resources being allocated for each container.
Yeah, so this is for the limit range where I'm tryna just set the max:
(there's a v1alpha1 mention in here, so this might be where I applied v1alpha1 resources, but tried to run with beta, so lemme just check and I'll upload a new run if that's the case - this time without a LimitRange so it's just what's in the PR for beta).
Update: here, definitely v1beta1 describe, no LimitRange experiment:
webpack command with v1beta1 at its peak:
(base) Adams-MBP:prometheus-2.17.1.darwin-amd64 aroberts$ watch kubectl top pod

Every 2.0s: kubectl top pod                                                                     Adams-MBP.home: Fri Apr 17 16:26:11 2020

NAME                                                CPU(cores)   MEMORY(bytes)
dashboard-release-run-npdp9-build-dxlc2-pod-hbmkd   631m         2056Mi
dep ensure -v next, between 130 mb and 337 mb usage, then 462, then it drops to 170 mb for the final steps:
[build : copy-files-to-output-resource] Input source path=/workspace/go/src/github.com/tektoncd/dashboard
[build : copy-files-to-output-resource] Output source path=/workspace/output/dashboard-source-repo
before OoM killed. I'm wondering if it's due to the Pipeline itself, take a look at https://github.com/tektoncd/dashboard/blob/226ab395e3f8345189f624d9535fb59da509578a/tekton/build.yml#L42.
v1alpha1 experiment:
grows to 2570 MB the webpack step, sticks at 668 mb for the dep ensure and it's super fast, then the copy to output step happens and, then the dashboard-release-run-5mtd8-publish-images-8n6g4-pod-gbhsp appears and all continues fine. I never see the second pod with beta.
a-roberts
on 17 Apr 2020
^^ Updated with another experiment, looks like it's the copy to output step that's causing the problem specifically with Tekton beta.
a-roberts
on 17 Apr 2020
I'm pretty sure we're copying more in that step than we need, so could definitely slim it down (ignore node_modules etc.), but wouldn't expect it to be causing OoM
 AlanGreene
on 17 Apr 2020
AlanGreene
on 17 Apr 2020
crazy I know but... that volume backing the resources doesn't happen to be in-memory is it? That step is just doing a cp + entrypoint stuff. The creds-init mount -- /tekton/creds -- is the only one by default in memory and I see above the output path is /workspace/output/dashboard-source-repo so should be fine. I'd at least check the default storage class.
 skaegi
on 17 Apr 2020
skaegi
on 17 Apr 2020
crazy I know but... that volume backing the resources doesn't happen to be in-memory is it? That step is just doing a
cp+entrypointstuff. The creds-init mount --/tekton/creds-- is the only one by default in memory and I see above the output path is/workspace/output/dashboard-source-reposo should be fine. I'd at least check the default storage class.
Alas, it's hostpath in both cases (so I'm on Docker Desktop which gives me Kubernetes 1.15.5) 🤔
a-roberts
on 17 Apr 2020
Had another look today, this time armed with Prometheus.
Made it all the way to publish images (so basically worked), and this is weird because I now have metrics-server installed on my cluster as well as Grafana. No limit ranges.
This is the data I captured
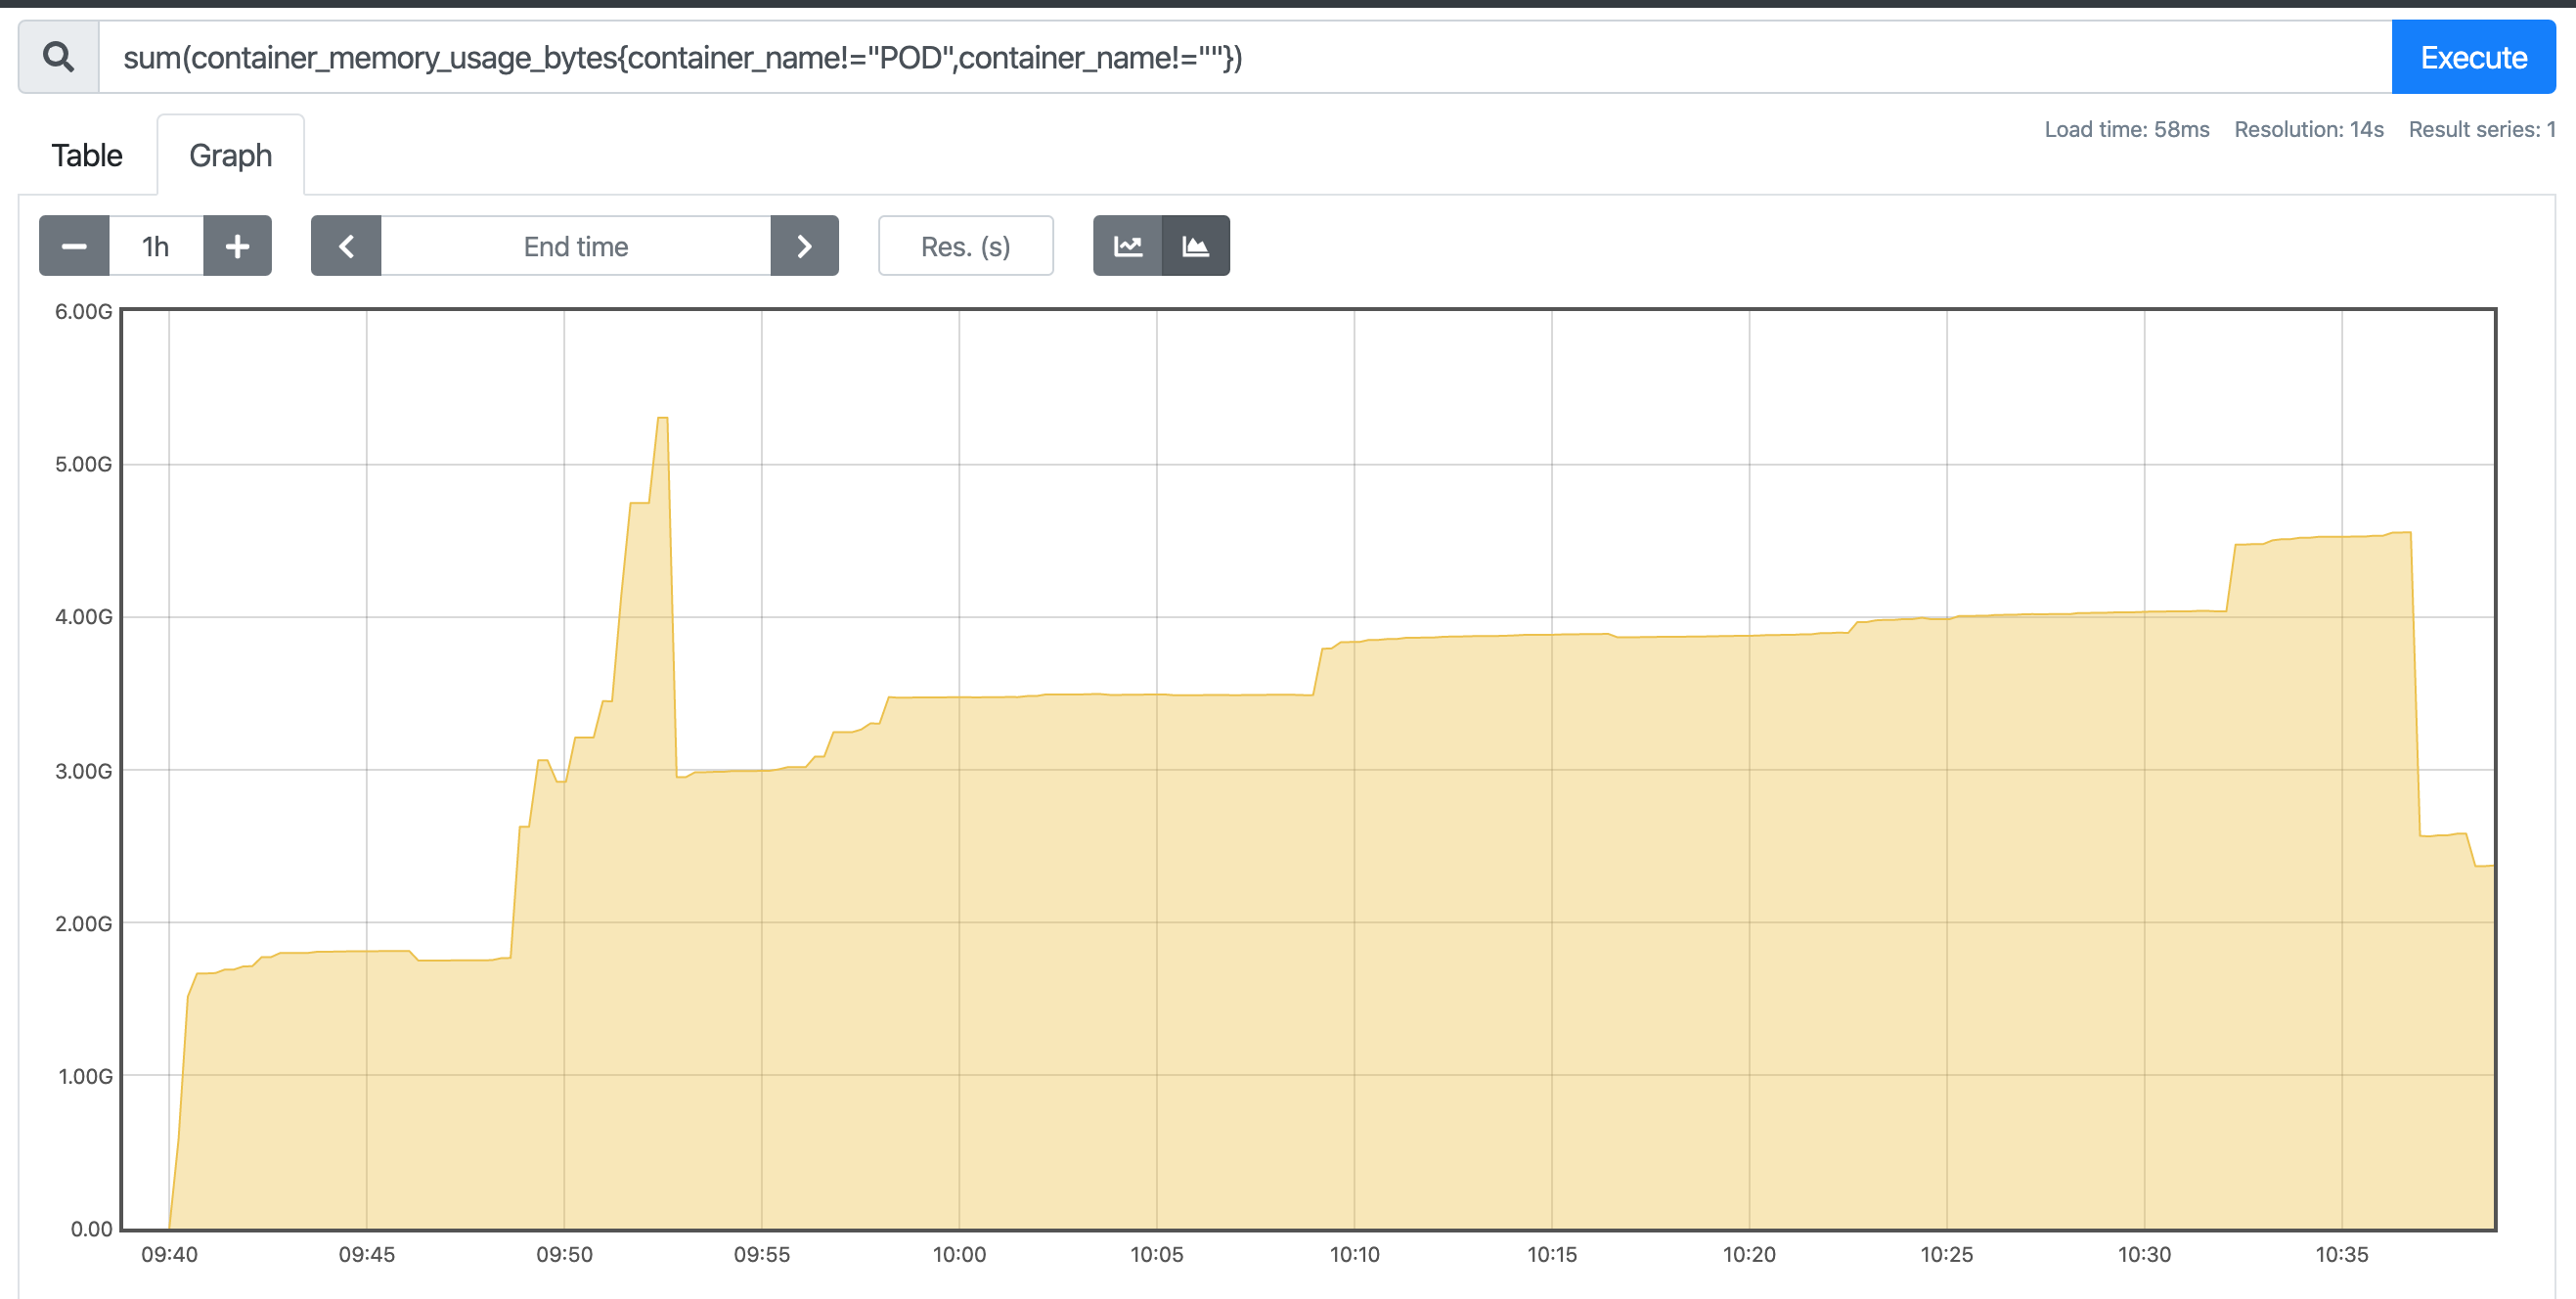
I'm going to do the same experiment with v1alpha1 again now and post that graph (so we can at least track memory usage again). The data on the left is container memory usage for the cluster in MB
Update, here's with alpha:
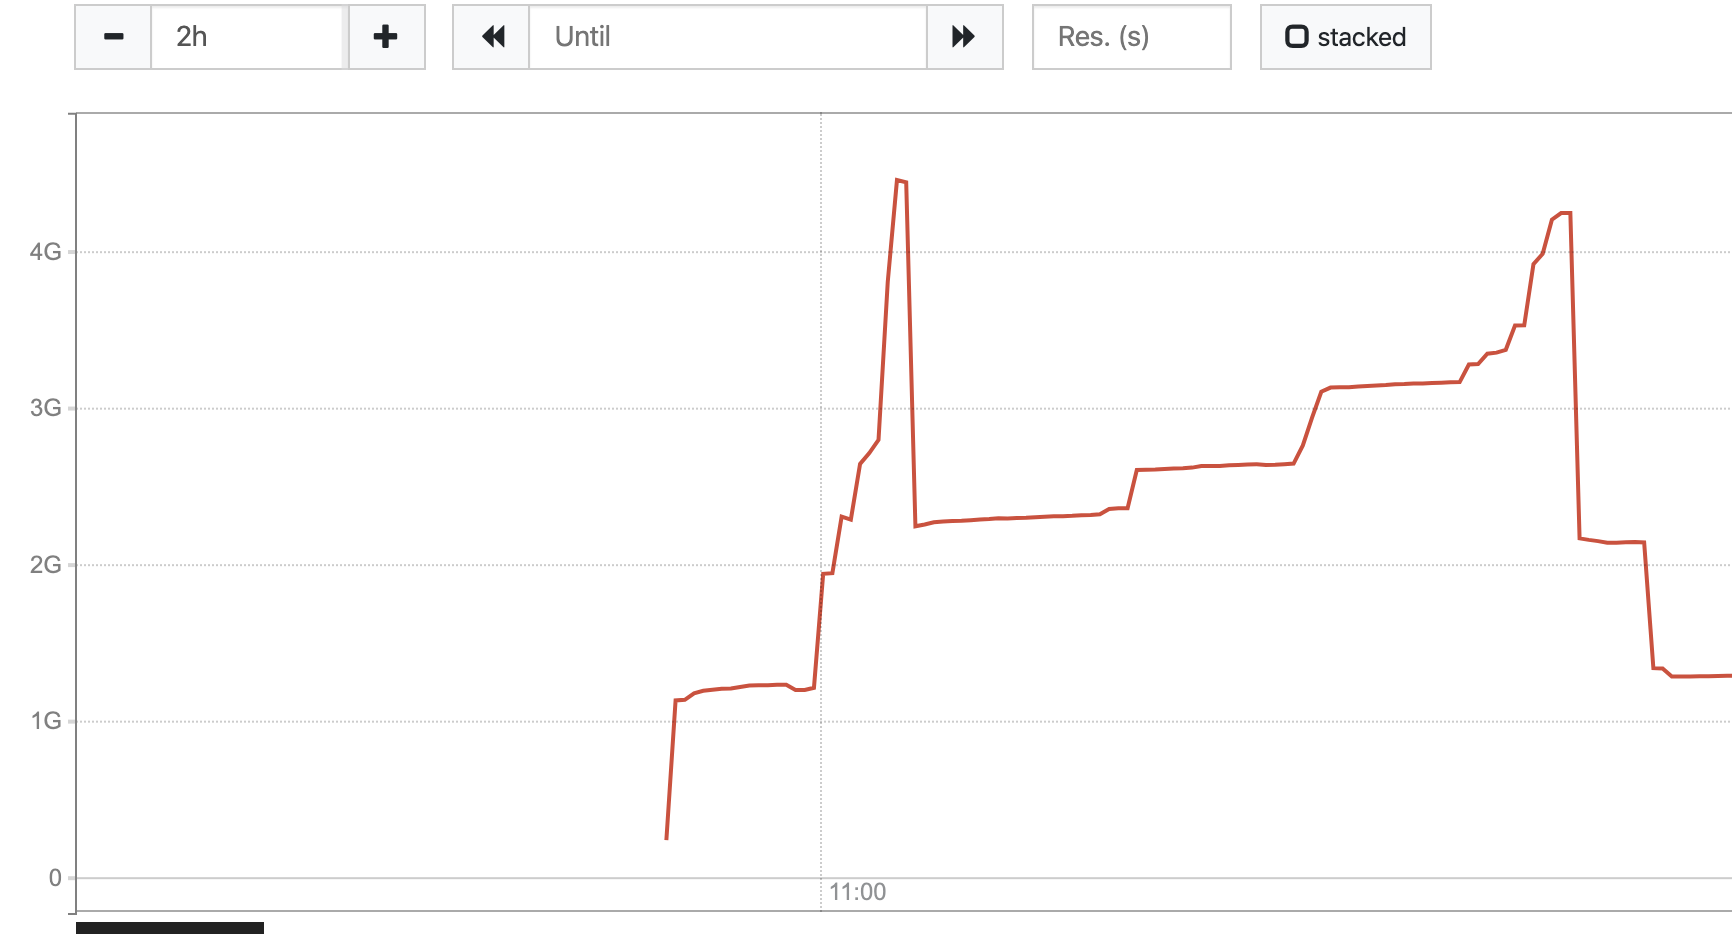
The only other change I made this morning is updating Docker Desktop (a patch version upgrade) and setting my IP subnet to something else.
a-roberts
on 20 Apr 2020
I took an initial look at this, and am just sharing results so far. I took the dashboard build pipeline and reduced it to just the build task. Then I ran that pipeline in 2 clusters: 1 with 0.11.2 and 1 with 0.10.2. Both clusters were on 1.15.9-gke.24 and each node is an n1-standard-1 machine with 2.77 GB of allocatable memory.
I would have liked to have tested each tekton version in the same cluster but got an error when I downgraded to 0.10.2 related to pipelines' webhook certificates.
The results I got differed in outcome. On the v1alpha1 PipelineRun the max consumed RAM was the higher, peaking around 1.95 GB used, while the v1beta1 PipelineRun consumed around 1.82 GB at its peak.
Can't draw any conclusions from this initial info. For others' reference, these were the pipelines, tasks and pipelineresources i used: https://gist.github.com/sbwsg/32eff1d2e04fe832ad6384d41bcfbc8c
 sbwsg
on 20 Apr 2020
sbwsg
on 20 Apr 2020
I took an initial look at this, and am just sharing results so far. I took the dashboard build pipeline and reduced it to just the build task. Then I ran that pipeline in 2 clusters: 1 with 0.11.2 and 1 with 0.10.2. Both clusters were on
1.15.9-gke.24and each node is an n1-standard-1 machine with 2.77 GB of allocatable memory.I would have liked to have tested each tekton version in the same cluster but got an error when I downgraded to 0.10.2 related to pipelines' webhook certificates.
The results I got differed in outcome. On the v1alpha1 PipelineRun the max consumed RAM was the higher, peaking around 1.95 GB used, while the v1beta1 PipelineRun consumed around 1.82 GB at its peak.
Can't draw any conclusions from this initial info. For others' reference, these were the pipelines, tasks and pipelineresources i used: https://gist.github.com/sbwsg/32eff1d2e04fe832ad6384d41bcfbc8c
Thanks @sbwsg for giving this a look, that's interesting to know and a relief, I'm going to do the necessary work to give this a spin and gather some data on OpenShift as well
RE
I would have liked to have tested each tekton version in the same cluster but got an error when I downgraded to 0.10.2 related to pipelines' webhook certificates.
yeah, that's the big pain I'm trying to get around (switching versions requiring a factory reset of my cluster, then going and making my resources again, setting up monitoring, etc), provided resources you've linked to all look good too
Update, here's some data on OpenShift for that specific pod, using beta (so, 0.11.2 notags:
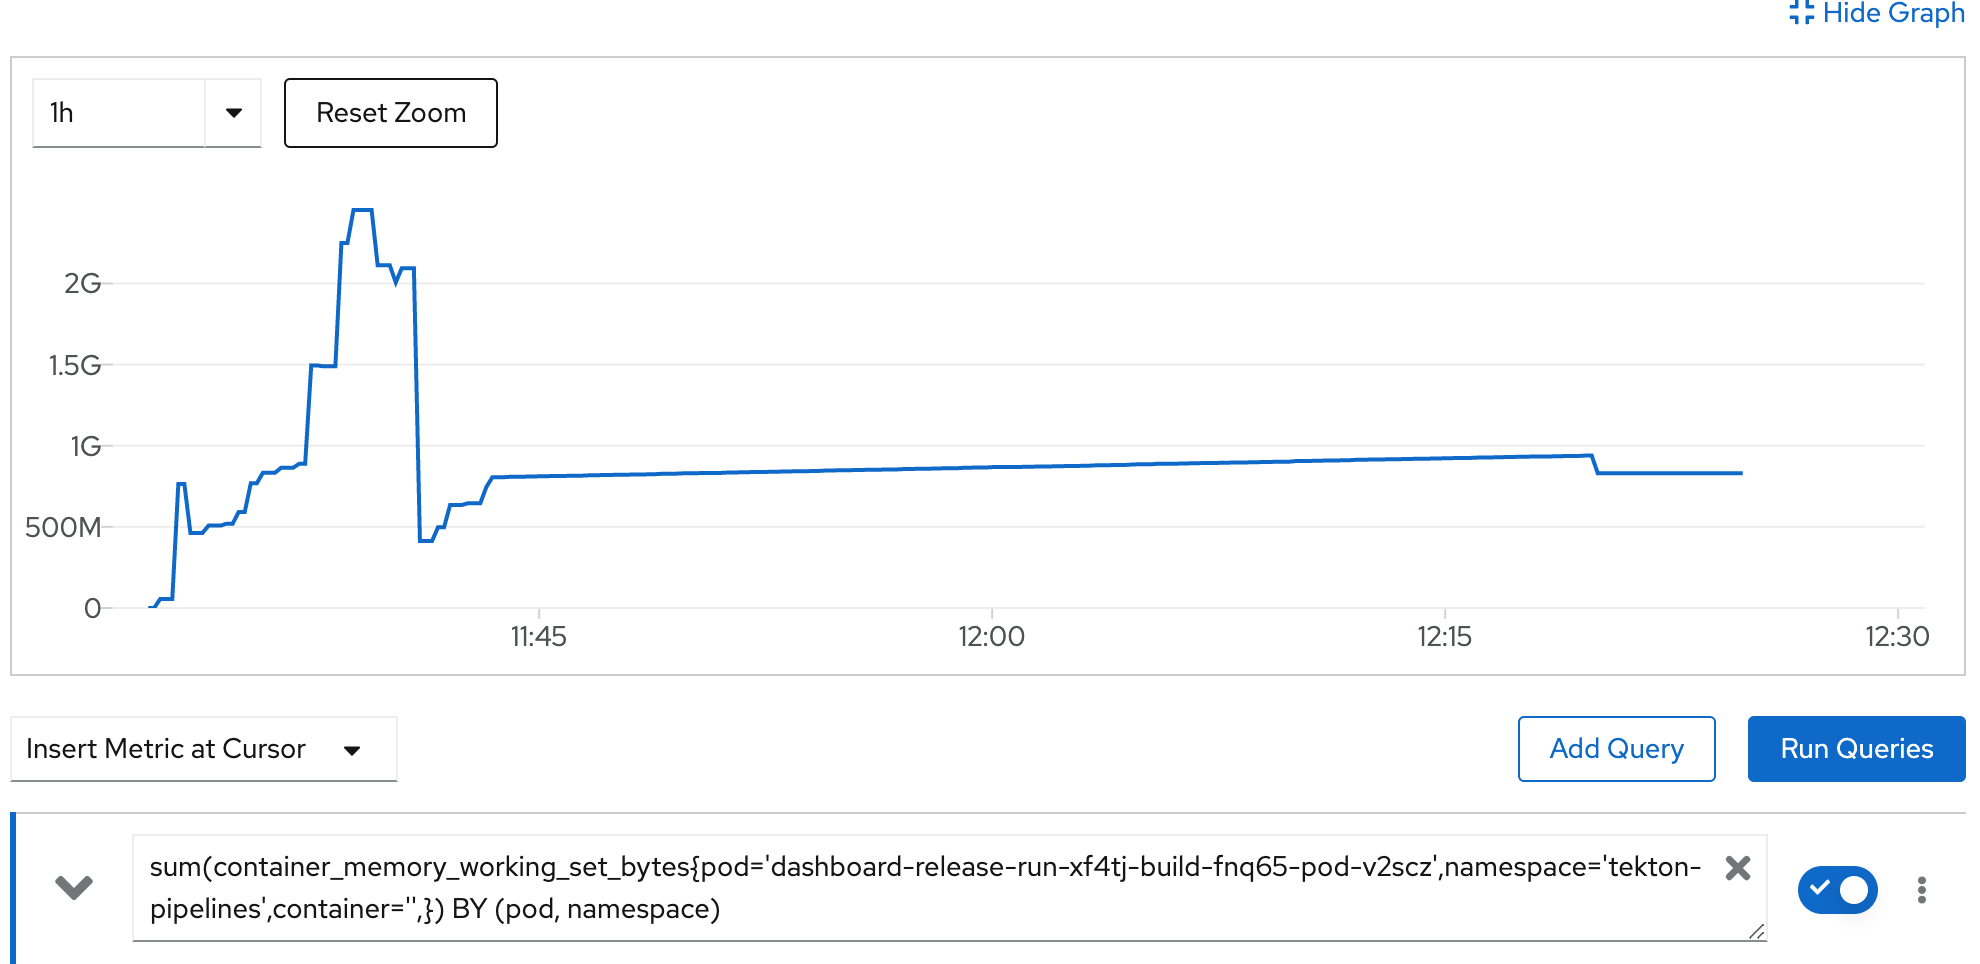
I'll do an alpha run soon, respinning the main Dashboard 0.6.1 release now and the OpenShift work doesn't fully complete, but the build part does.
Update:
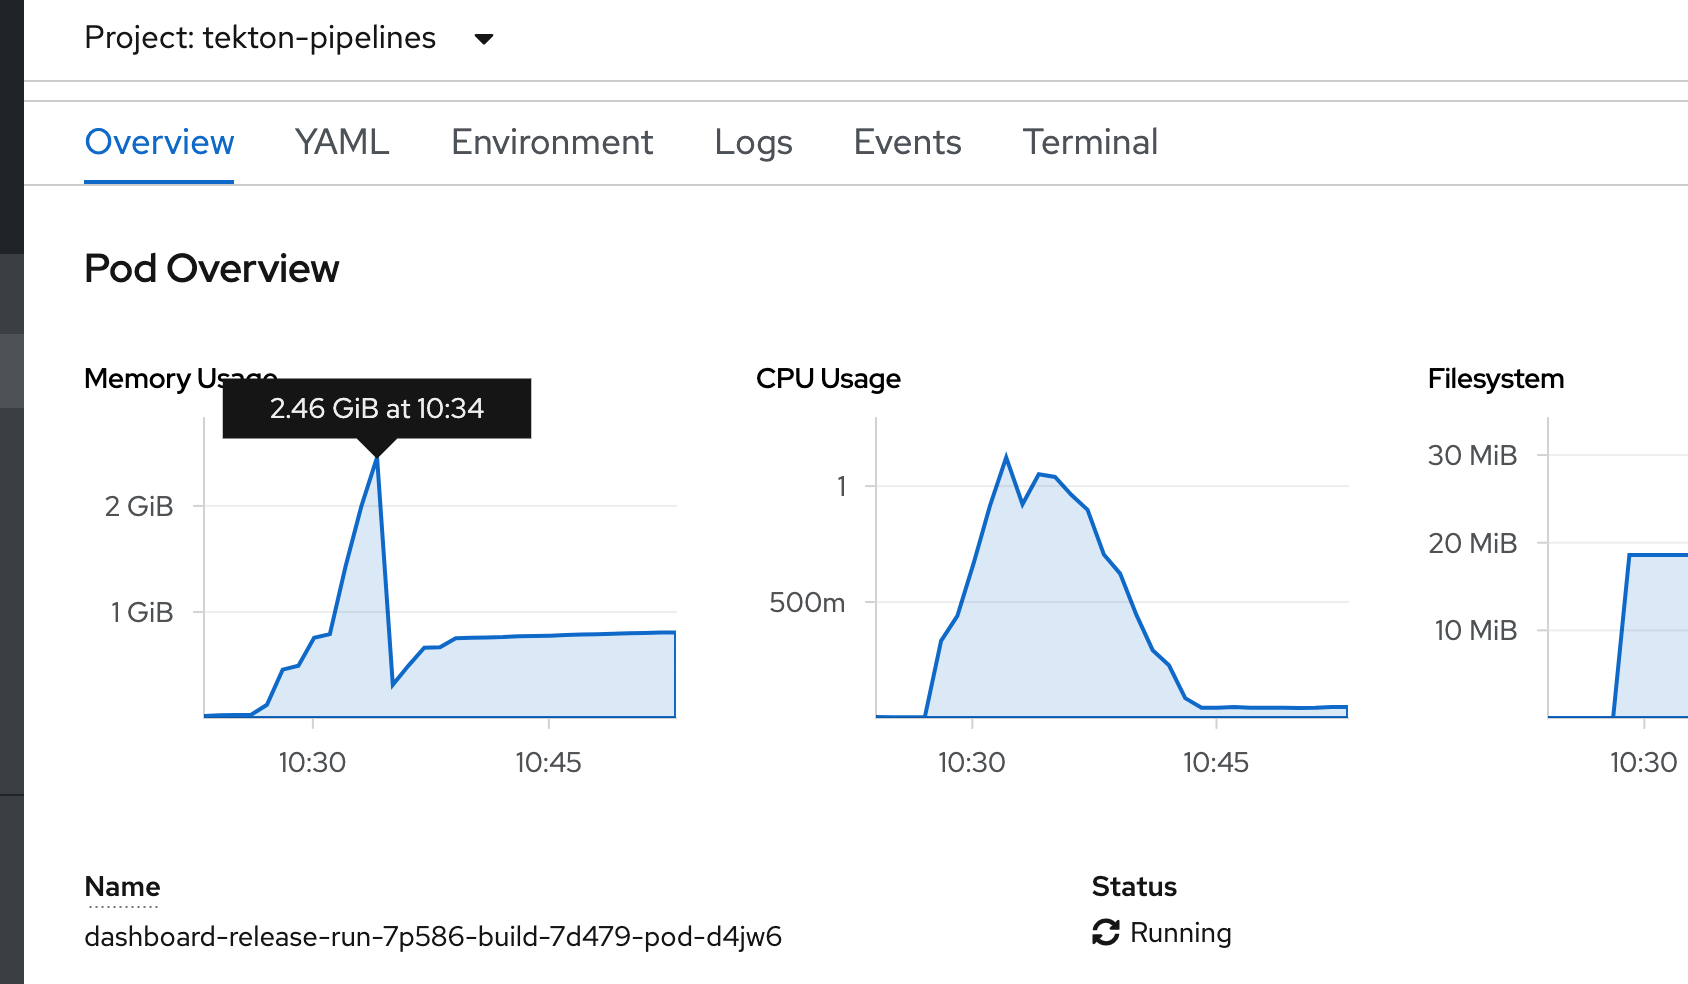
results from alpha.
Note that for Docker Desktop, I was tracking memory usage across all pods (with nothing else running apart from the monitoring set up itself), whereas with OpenShift I'm getting more fine-grained (pod level) metrics trivially and out of the box.
So my own conclusion is as follows.
1) LimitRanges didn't help (by increasing the min/maxes for containers)
2) There certainly isn't a substantial difference when looking at the pod memory consumption itself (on Google Cloud or OpenShift)
3) I couldn't trivially pod-level monitor on Docker Desktop but do see the biggest difference here- it's possible something else was requiring more memory instead.
Given the OpenShift and Google Cloud results I'm inclined to close this one out - it was a fun experiment though and the PRs for upgrading our release pipelines are now in.
a-roberts
on 21 Apr 2020
Discussed this one on Slack, there's nothing really actionable here now, there's lots of data above ^^ should anyone wish to run with similar experiments and it's useful evidence that, at least for our Task/Pipeline, there wasn't a noticeable difference in memory consumption after all (see my previous posts for the conclusions).
Thanks everyone for taking a look, I'm putting this down to "user error with LimitRanges" and my Docker Desktop set up being hardly experiment ready.
a-roberts
on 22 Apr 2020
Related issues
 pierretasci
·
35Comments
pierretasci
·
35Comments
 benke33
·
51Comments
sbwsg
·
27Comments
skaegi
·
26Comments
benke33
·
51Comments
sbwsg
·
27Comments
skaegi
·
26Comments
 bobcatfish
·
23Comments
bobcatfish
·
23Comments