Parse-server: Parse LiveQuery Excessive CPU
Issue Description
I've got a parse server in production in an IoT environment where it's processing around 100 requests a second. This all works great with CPU around 30% and 25ms response times. The parse server is clustered on AWS on two C5.Large instances.
I'm adding in LiveQuery as a separate C5.Large server. Both Parse server and LiveQuery are using Redis to communicate changes and this is working.
The problem I'm seeing is the LiveQuery server with just one client connected has CPU usage between 20-35%. Two clients connected and this jumps to around 40%. More than 3 clients connected and the server crashes within minutes.
I'm looking for some suggestions as to what to try to figure out why the excessive CPU usage and then server crash. To be clear, subscriptions all work from Parse Server to LiveQuery to the client.
More information:
- Parse Server version: 3.0.0
- Parse Client: 2.1.0
- Number of Classes monitored by Live Query: 12
- Using Role ACL
- Using Session Token in client subscriptions
Here is how Live Query server is configured:
let parseApi = new ParseServer({
    databaseURI: `mongodb://${config.get('/mongo/userName')}:${config.get('/mongo/password')}@${config.get('/mongo/uri')}`, // Connection string for your MongoDB database
    appId: config.get('/parse/appId'),
    masterKey: config.get('/parse/masterKey'), // Keep this key secret!
    serverURL: `http://127.0.0.1:${config.get('/port/webapp')}/parse`,
    logLevel: "ERROR",
    sessionLength: ONE_DAY, // in seconds. Set to 24 hours.
    schemaCacheTTL: ONE_MONTH_MS, //"The TTL for caching the schema for optimizing read/write operations. You should put a long TTL when your DB is in production. default to 5000; set 0 to disable."
    cacheTTL: ONE_DAY_MS, //"Sets the TTL for the in memory cache (in ms), defaults to 5000 (5 seconds)"
    cacheMaxSize: 1000000, //"Sets the maximum size for the in memory cache, defaults to 10000"
    enableSingleSchemaCache: true //"Use a single schema cache shared across requests. Reduces number of queries made to _SCHEMA. Defaults to false, i.e. unique schema cache per request."
});

// Serve the Parse API on the /parse URL prefix
app.use('/parse', parseApi);

let port = config.get('/port/webapp');
let server = app.listen(port);

// Initialize a LiveQuery server instance, app is the express app of your Parse Server
if (config.get('/parseAppServerIsLocal')) {
    debug(`Starting Live Query Server on port ${config.get('/port/parseLiveQuery')}`);
    let httpServer = require('http').createServer(app);
    httpServer.listen(config.get('/port/parseLiveQuery'));
    let liveQueryParams = {
        redisURL: config.get('/server/redis')
    };
    let parseLiveQueryServer = ParseServer.createLiveQueryServer(httpServer,liveQueryParams);
}
Steps to reproduce
Configure Parse server/LiveQuery per above with Redis and connect one client that subscribes to all 12 classes. Queries are not complex. Example:
const nodeStatusesQuery = new ParseObj.Query('NodeStatus').limit(10000);
Observer jump in CPU usage in high-throughput (100 requests per second to parse server).
Expected Results
I'm not sure what the CPU usage should be, but 30% for one client, 40-50% for two and crashing after that doesn't seem right.
Actual Outcome
LiveQuery server with just one client connected has CPU usage between 20-35%. Two clients connected and this jumps to around 40%. More than 3 clients connected and the server crashes within minutes.
Environment Setup
Server
- parse-server version (Be specific! Don't say 'latest'.) : 3.0.0
- Operating System: Linux
- Hardware: AWS ELB C5.Large instance
- Localhost or remote server? (AWS, Heroku, Azure, Digital Ocean, etc): AWS
Database
- MongoDB version: 3.4.14
- Storage engine: Not sure
- Hardware: mLab hosted on AWS
- Localhost or remote server? (AWS, mLab, ObjectRocket, Digital Ocean, etc): mLab
Logs/Trace
 wfilleman
All 76 comments
While this may seem excessive, this ‘kindof’ make sense. Would you be able to provide profiling info on the liveQuery server? Perhaps an obvious optimization can be made. I’m thinking JSON serialization bottlenecks
 flovilmart
on 7 Oct 2018
flovilmart
on 7 Oct 2018
Absolutely, what would you recommend? I’ve never had to do profiling with Node before.
wfilleman
on 7 Oct 2018
So that's almost easy :)
Enable inspect mode on your node process
- Get the
<pid>of your live query process withps aux | grep node - Send the USR1 signal to this process
kill -usr1 <pid>(This will not kill the node process but send the USR1 signal. node is built to enable the inspector when receiving this signal).
Forward the port
By default the debugger interface for your process should start on port 9229, if you're running the process on a remote server, then you need to ensure the port 9229 is properly open for inspection.
Chrome inspector
We use the chrome inspector to gather the profiles and process, open a new chrome tab an in the URL bar, enter: chrome://inspect

Locally this is what I see when debugging the parse-live-query-server process locally, in your case, this may be different:

Hit the inspect link and start recording the profile

flovilmart
on 7 Oct 2018
Awesome, I can get the results posted tomorrow. Thanks!
wfilleman
on 8 Oct 2018
Nice, also, do not profile for too long, profiles are huge :) given what you describe we should hopefully be able to see bottlenecks without too much digging
flovilmart
on 8 Oct 2018
Good point. Will do.
wfilleman
on 8 Oct 2018
Hi @flovilmart,
See attached for the 3 node processes running on the live query server. One process is the watchdog/master that spawns the other two node servers for each of the 2 available CPUs on a C5.Large.
Each was captured for about 60 seconds of profile data while there was one client connected and the CPU was around 30%.
Let me know what else I can capture for you. I really appreciate the help!
Wes
wfilleman
on 8 Oct 2018
FYI: Your directions were nearly perfect. The one step I had to do on the remote server was to start the node app/Live Query with:
node --inspect=10.0.1.77 server.js
The --inspect=10.0.1.77 line tells the inspector to attach to it's local IP address.
wfilleman
on 8 Oct 2018
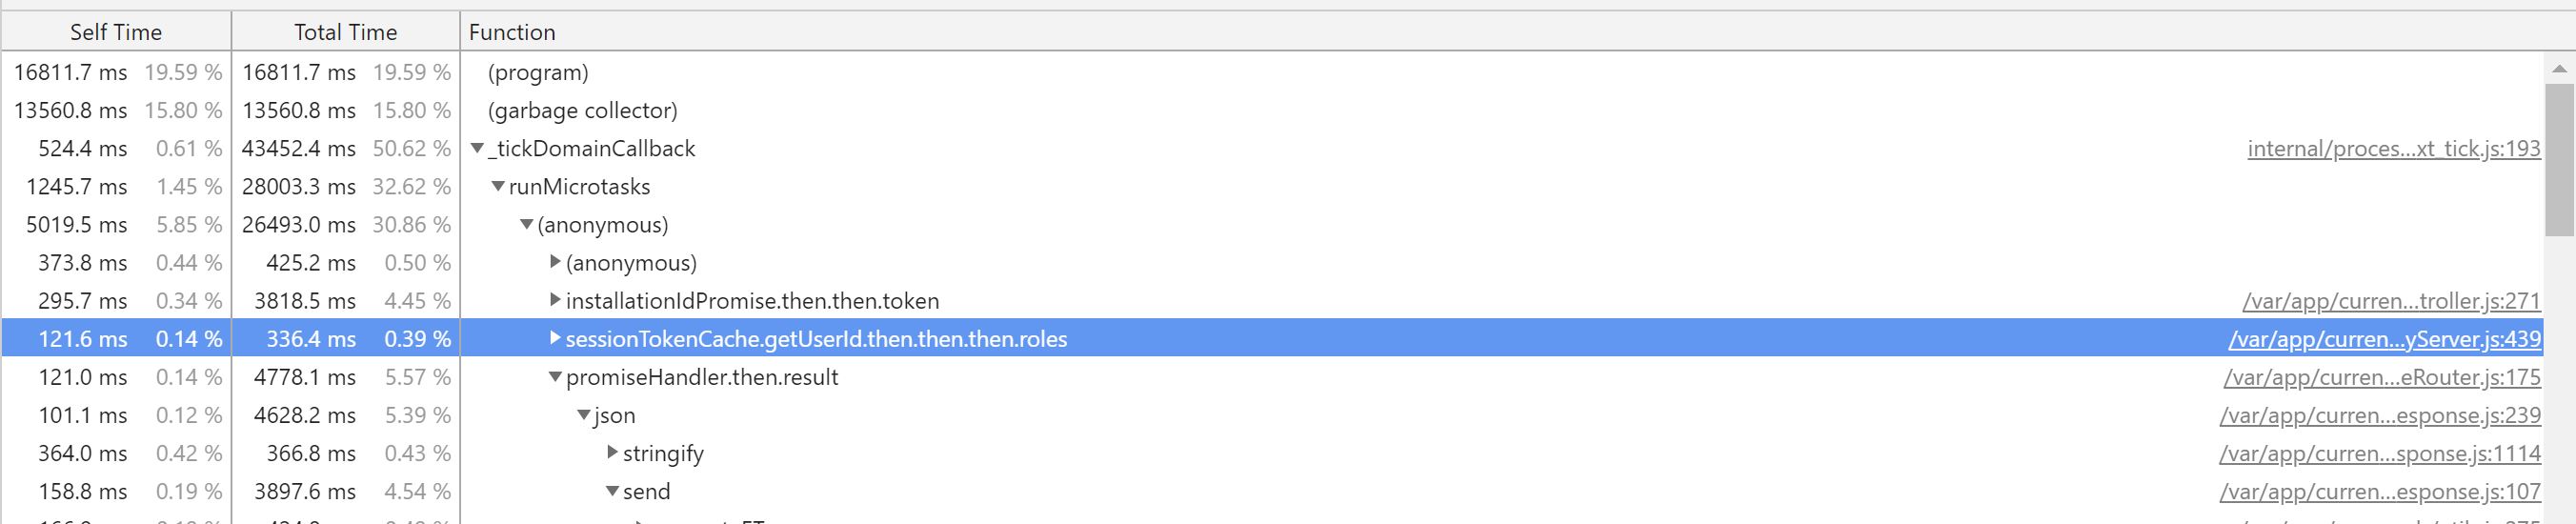
Thanks @wfilleman. Are you able to record a profile when your CPU saturates? At this time the profile doesn't show any particular bottleneck on the live query server beside the fact we spend a lot of time in internals of process.nextTick() See below the time usage of runMicrotasks internal:

flovilmart
on 8 Oct 2018
Hi @flovilmart,
I connected 4 clients to my LiveQuery server and was able to capture 2 of the 3 processes for about 60 seconds each before the server crashed. Hopefully, this will give you better insight as to what's happening. I'm pretty sure the one titled Process2-10-8-2018 is the LiveQuery instance. The process3 one is the watchdog.
Thanks!
Wes
LiveQuery-HighCPU-10-8-2018.zip
wfilleman
on 8 Oct 2018
Awesome thanks! I’ll have a look
flovilmart
on 8 Oct 2018
@flovilmart,
Managed to grab that first process after a server reboot. The server looks like it's crashing due to running out of RAM. In watching the metrics on the server this time, the LiveQuery RAM use gets to about 80% of the available RAM (on the C5.Large it's 4GB) and then the server crashes. My guess is the garbage collector can't run due to the excessive CPU.
Thanks!
Wes
Process1-10-8-2018-V2.zip
wfilleman
on 8 Oct 2018
@flovilmart, One more data point: With no clients connected, the CPU is 1-2%. Stable. Whatever is happening, it's only once there are 1+ clients connected.
Wes
wfilleman
on 8 Oct 2018
@wfilleman are you able to test against a particuarl branch like: schemaController-performance? I've identified one way things can improve https://github.com/parse-community/parse-server/pull/5107
flovilmart
on 8 Oct 2018
@wfilleman the more I look at your trace in Process3, it seems to spend most of it's time on the internal connect calls. Are you sure the client connections are steady and stable? If you have your 3 clients connected and no activity on the server, what is your CPU usage like? It looks like all your clients keep connecting and disconnecting all the time. Do you have a reverse proxy in front?
flovilmart
on 8 Oct 2018
@flovilmart, yes, absolutely. Loading it up now and will report shortly.
Wes
wfilleman
on 8 Oct 2018
@flovilmart, let me double-check the load balancer. It may be killing the websocket every 10 seconds. When I look at the client logs, I'll see the connection drop and it reconnects occasionally when in the high CPU usage case.
Wes
wfilleman
on 8 Oct 2018
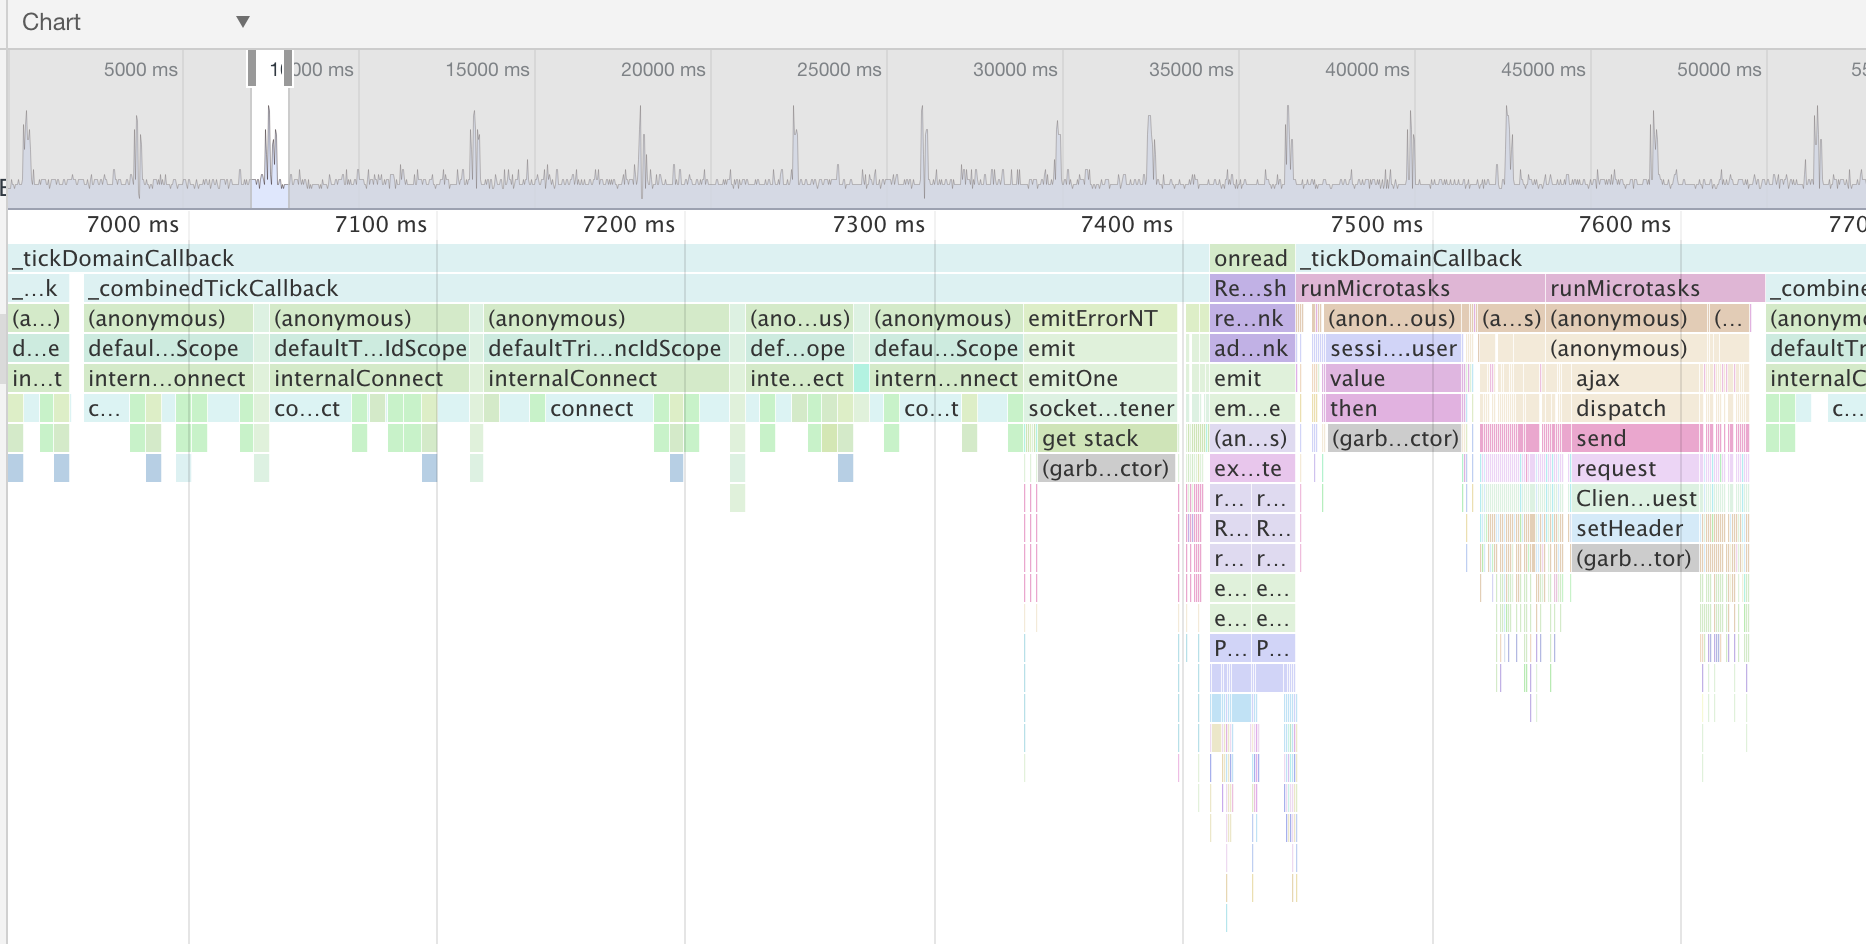
It may be killing the websocket every 10 seconds.
This may explain a few things if you look at this:

your program has spent:
- 36% of it's time garbage collecting
- 26% on connection
- 6% emitting errors + 3% collecting the stacks :)
That's about 75% of CPU time just handling the conections, and not doing anything.
From the trace we see connect calls every 150ms :)
flovilmart
on 8 Oct 2018
Wow, ok. In the client logs, I'm logging when the connection to live query is opened and closed and errored. There's a handful of these messages...definitely not one every 150ms. I'm using parse client 2.1.0.
Pulling the master branch now to test your change.
Wes
wfilleman
on 8 Oct 2018
I've also changed the load balancer to keep connections open for 20 minutes to see if that changes anything as well.
wfilleman
on 8 Oct 2018
Any client / server pair should properly work. It definitely reaches the node process, but never the server itself can you print the result of npm ls
flovilmart
on 8 Oct 2018
@flovilmart I pulled the master branch, but I'm seeing this error:
dyld: lazy symbol binding failed: Symbol not found: __ZN4node19GetCurrentEventLoopEPN2v87IsolateE
  Referenced from: /LiveQueryServer/node_modules/parse-server/node_modules/bcrypt/lib/binding/bcrypt_lib.node
  Expected in: flat namespace
Looks like it may be related to 3.0.1 of Bcrypt: https://github.com/kelektiv/node.bcrypt.js/issues/656
wfilleman
on 8 Oct 2018
can you print the result of npm ls
@flovilmart Sure thing, here's the result of npm ls with parse-server#main branch
wfilleman
on 8 Oct 2018
@wfilleman alright, we're making progress there, if bcrypt is problematic this seems to be related to a particular version of node.js what version are you using?
flovilmart
on 8 Oct 2018
Can you try with node 8.11.2 (what the CI run with) or 8.11.3 (latest LTS)
flovilmart
on 8 Oct 2018
@flovilmart I'm using the latest version available from AWS: 8.11.4, however, I've also tried this with the same results on 8.9.3 (Another production box I have running parse server).
wfilleman
on 8 Oct 2018
@flovilmart Maybe I didn't understand which issue we're looking at. My local dev machine is 8.9.3, are you suggesting upgarding my local node to 8.11.2(3,4)?
wfilleman
on 8 Oct 2018
let's keep the focus here, bcrypt is used for encrypting passwords in the DB' not the livequery server. So this doesn't seem related at first look. What are the errors you see in your client? if the connection fails, then this is where it should be fixed. Also, are you sure throng is working fine with websockets?
flovilmart
on 8 Oct 2018
@flovilmart Agreed. However, I can't run the master branch on 8.9.3 (my local setup) or AWS 8.11.4. I've moved back to release 3.0.0 and removed throng so there's only one node process. Will post the CPU profile shortly.
wfilleman
on 8 Oct 2018
However, I can't run the master branch on 8.9.3 (my local setup) or AWS 8.11.4
bcrypt is an optional dependency as it can explicitly fail to build. Why can't you run locally?
removed throng so there's only one node process
Good idea, I'm also curious if you're using nginx in front, this may cause the errors. Did you make sure it's properly configured: https://www.nginx.com/blog/websocket-nginx/
flovilmart
on 8 Oct 2018
@flovilmart
Ok, here's the run with a single process (no Throng). The AWS loadbalancer IS using nginx, however, it's their Application Load Balancer that is advertised to be websocket compatible. I can change the host to Apache as a test.
During the test, I had 4 clients connected that maxed out the CPU. All four were connected with no connection errors during the profiling.
Wes
RemovedThrong-Process1.zip
-- Parse Server release 3.0.0. Not main branch.
-- Load Balancer timeout set to 20 minutes.
wfilleman
on 8 Oct 2018
@flovilmart
bcrypt is an optional dependency as it can explicitly fail to build. Why can't you run locally?
It doesn't fail to build, but when I attempt to run the server, as the node process starts up I get this error I reported above:
dyld: lazy symbol binding failed: Symbol not found: __ZN4node19GetCurrentEventLoopEPN2v87IsolateE
  Referenced from: /LiveQueryServer/node_modules/parse-server/node_modules/bcrypt/lib/binding/bcrypt_lib.node
  Expected in: flat namespace
@flovilmart
Ran another profile test this time with Apache as the load balancer front. 4 clients connected. Maxed out CPU. No connection errors reported by the clients.
-- Parse Server release 3.0.0. Not main branch.
-- Load Balancer timeout set to 20 minutes.
wfilleman
on 8 Oct 2018
I beleive the apache trace you gave me is for the webserver not the websocket server. the traces don't match the activity of the websocket server.
flovilmart
on 8 Oct 2018
It doesn't fail to build, but when I attempt to run the server, as the node process starts up I get this error I reported above:
this should be fine, importing bcrypt is conditional as well as your server will fallback to another non native bcrypt library
flovilmart
on 8 Oct 2018
@flovilmart I've got my local dev machine using 8.11.4 to match AWS and I'm loading up #master branch now.
I'm also attempting to bypass the load balancer to get that out of the way.
Should have results very soon. Thank you for your patience.
Wes
wfilleman
on 8 Oct 2018
@wfilleman I ran it also locally, creating multiple clients and subscriptions. I don't experience the connect flood you have on the server. As for the one behind apache, I'm not sure but it didn't contain the livequery server trace.
flovilmart
on 8 Oct 2018
@flovilmart Not sure what happened with the Apache Front capture. It was definetly attached to the LiveQuery Node process. No matter, here's another profile run:
- Direct to the AWS instance and bypassing the load balancer.
- CPU Maxed with 4 clients.
- 1 Node process (no throng)
- Main Branch of Parse
- Node 8.11.4
wfilleman
on 8 Oct 2018
@flovilmart For your local testing, how many parse server updates are happening per second? Also, how many LiveQuery classes? That seems to be a big part of this. Locally, I have no issues with next to zero activity from the local dev parse server, but when hooked into a deployed Parse server that's doing 100 updates a second with 12 classes (using REDIS as the middleman between Parse Server and LiveQuery) that's when LiveQuery spikes its CPU with just a couple of clients connected.
Wes
wfilleman
on 8 Oct 2018
look, the (original) profile shows your node process has spent about 75% of the available CPU time in connect. This is somehow unrelated to the number of messages your receive. Your CPU profile doesn't show that any of the live query server code is the bottleneck.
On the last file you shared me this is again the parse server, not the live query server's trace. (process1-DirectWebsocket-MainBranch.zip)
flovilmart
on 8 Oct 2018
@flovilmart Maybe I'm not fully understanding then how to do a proper profile capture. Here's what I'm seeing. Please tell me what I'm doing wrong:
- Logged into the instance, running
topI see just one nodejs process that's using all CPU. - When I attach the V8 profiler to the instance the PID it reports, matches the PID reported in top.
- The LiveQuery server and parse server are both in the one node process, correct? IE Live Query isn't breaking out a new Nodejs process...Which I'm not seeing in
top. - When I look at the profile capture, I see this LiveQuery file getting referenced which leads me to believe that the profiler is capturing the LiveQuery data.
This stuff is definetly complex. My apologies if I've misunstood you at some point.
Wes
wfilleman
on 8 Oct 2018
@flovilmart Another data point: All 4 clients are using the same username/password to log in. Could there be an issue with multiple clients using the same user and stepping on each other?
Also, all 4 are logging into the production Parse server...not the parse server that gets stood up only to launch LiveQuery on my separate LiveQuery server.
Wes
wfilleman
on 8 Oct 2018
SO you're running both the live query server withing parse server and also externally with redis to communicate?
You said: I'm adding in LiveQuery as a separate C5.Large server. so definitely your server should not take any http calls hits, only websocket hits.
The LiveQuery server and parse server are both in the one node process, correct?
Well, originally you said it was separated, so stop changing the variables. is it separated or not?
When I look at the profile capture, I see this LiveQuery file getting referenced which leads me to believe that the profiler is capturing the LiveQuery data.
The weight and CPU time of the trace you show is kind of insignificant in terms of time so the problem is not there.
All 4 clients are using the same username/password to log in. Could there be an issue with multiple clients using the same user and stepping on each other?
I don't think so.
in summary:
Originally, you provided 3 traces, 1 that matched the server code, the second one that matched the live query server traces. I dunno why you stopped
All the traces you share show plenty of CPU time available the process is not maxing out.
The trace that shows the issues was the one I responded with here: (
https://github.com/parse-community/parse-server/issues/5106#issuecomment-427934225)
If you open this trace again you'll see that your process keeps doing connect / error
Process3-10-8-2018.cpuprofile.zip
And unless you fix this issue (or provide another trace of only the live query server that shows it's not an issue), i can't do much.
Also, if you see live query server calls within your parse-server process, this means you're still running the live query server in parse-server, therefore all messages will still be sent to this server even though no client may be connected.
flovilmart
on 8 Oct 2018
My apologies if we're misunderstanding each other. Let me try to rephrase and clear up the setup.
Well, originally you said it was separated, so stop changing the variables. is it separated or not?
No variables are changing outside of what we're asking each other to look let. Here's the setup:
- The production Parse server is running on AWS/ELB.
- It's clustered and all parse servers connect to the same one REDIS instance to send livequery information about the 12 classes production parse server is monitoring.
- I have a test server that is only live query. However, they only way I can get live query to work is if I follow the parse community directions to stand up a basic parse server first THEN use that to launch live query. At the very top of this issue, I posted the exact server config for my live query server instance.
- The LiveQuery server instance does have a parse server running on it (connected to the production mongo db), but nothing should be connecting to that parse server aside from whatever LiveQuery needs.
- React Native clients are connecting to Parse Server on the production AWS to log in and get initial data dumps.
- React Native clients are connecting to the separate Live Query server for real-time data update.
Originally, you provided 3 traces, 1 that matched the server code, the second one that matched the live query server traces. I dunno why you stopped
I stopped to remove Throng from the equation and focus on just one node process. I will move back to using Throng and will capture all three node processes and report back in a few minutes.
Wes
wfilleman
on 8 Oct 2018
Here's what I'm seeing for CPU in https://github.com/parse-community/parse-server/files/2457685/process1-DirectWebsocket-MainBranch.zip
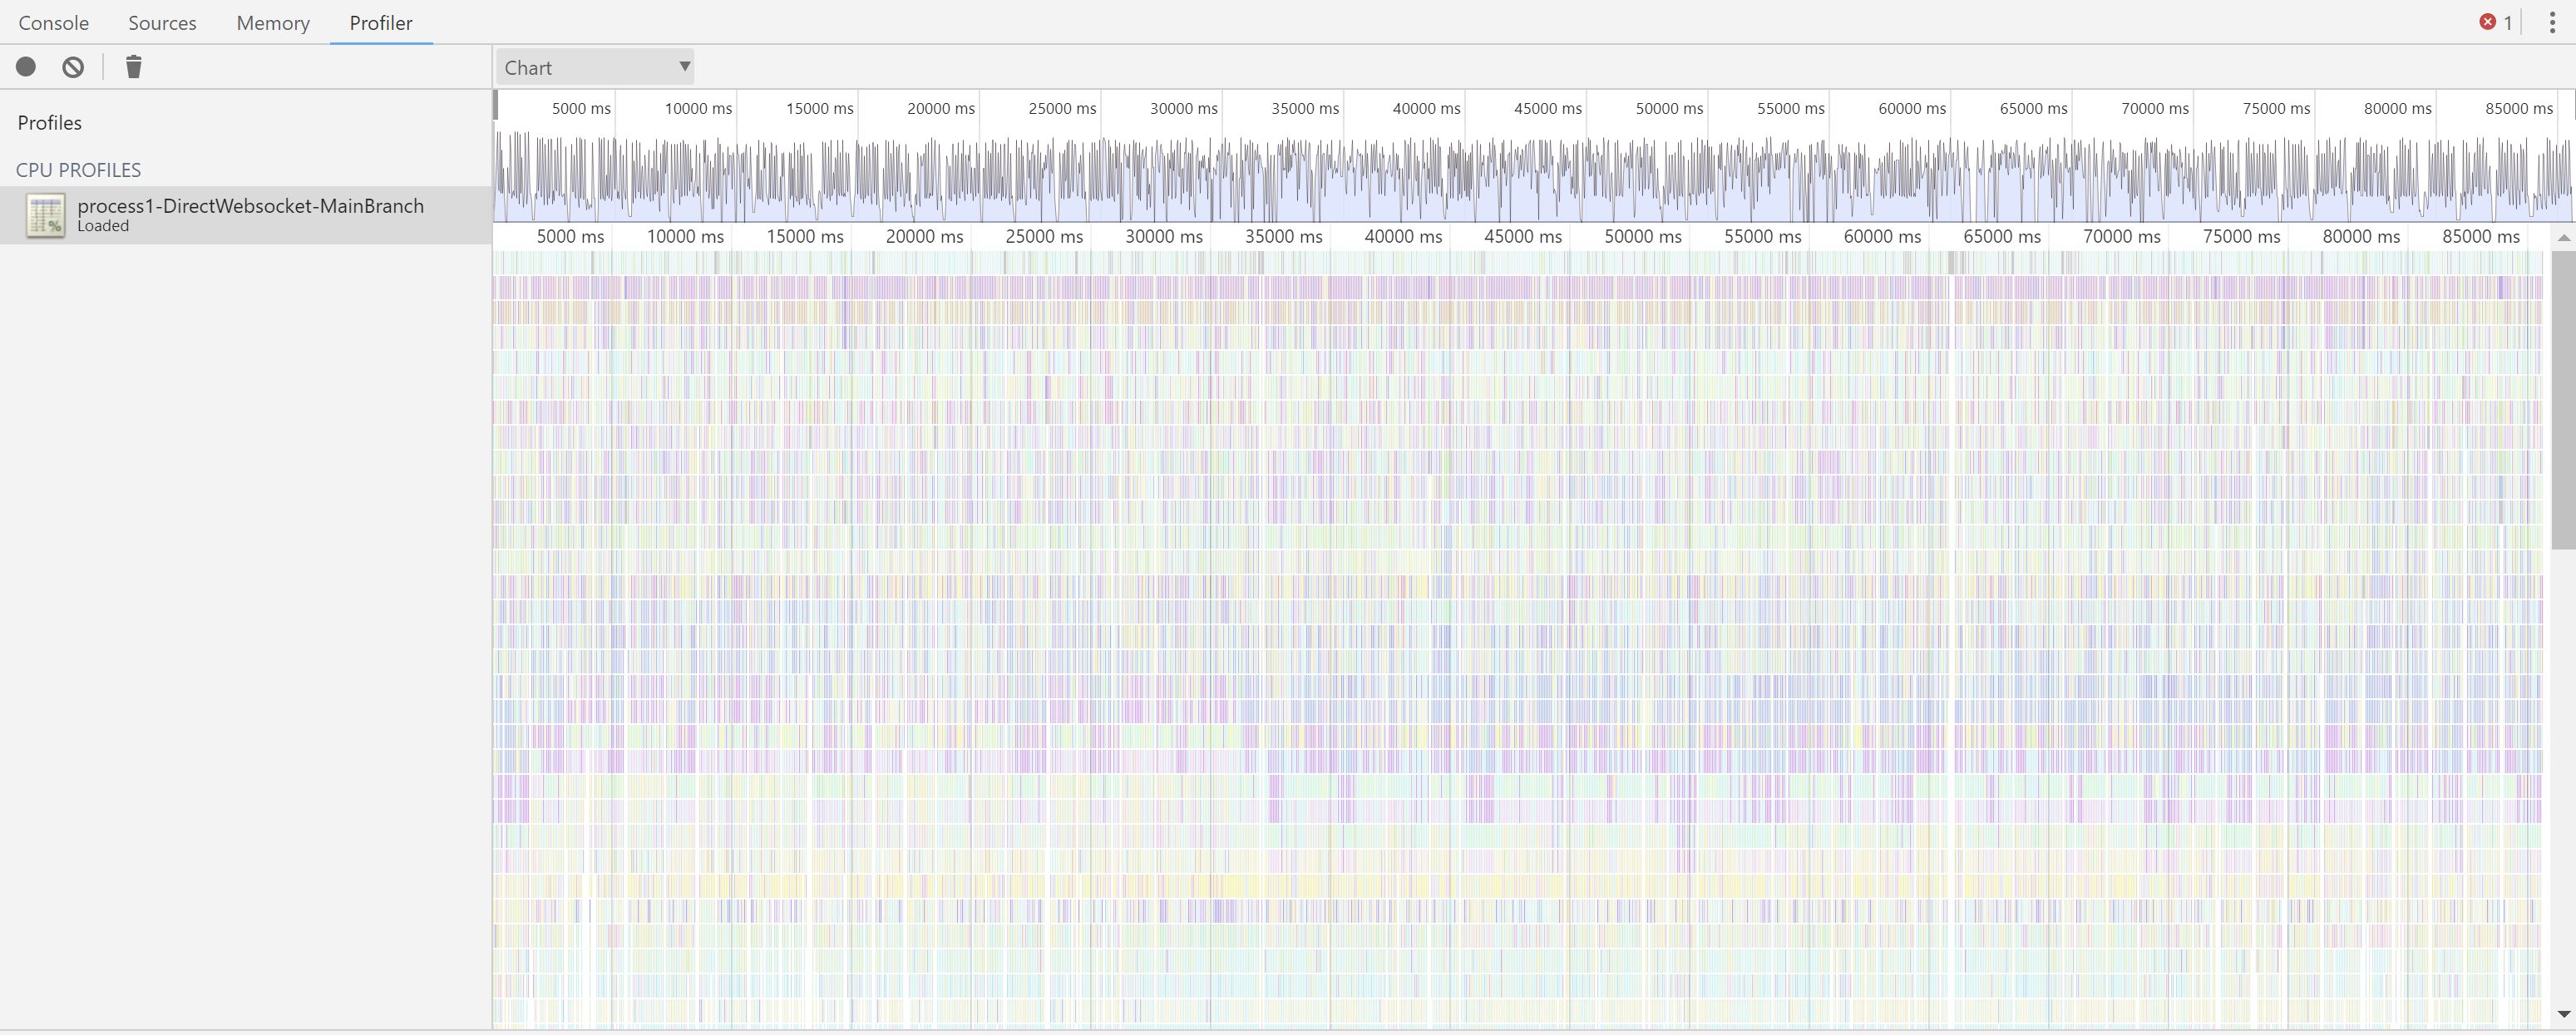
If I read that right, the CPU is frequenly spiking/staying busy.
The chart you referenced was when we were testing with just one client connected and we were specifially NOT maxing the CPU.
Wes
wfilleman
on 8 Oct 2018
The chart you referenced was when we were testing with just one client connected and we were specifically NOT maxing the CPU.
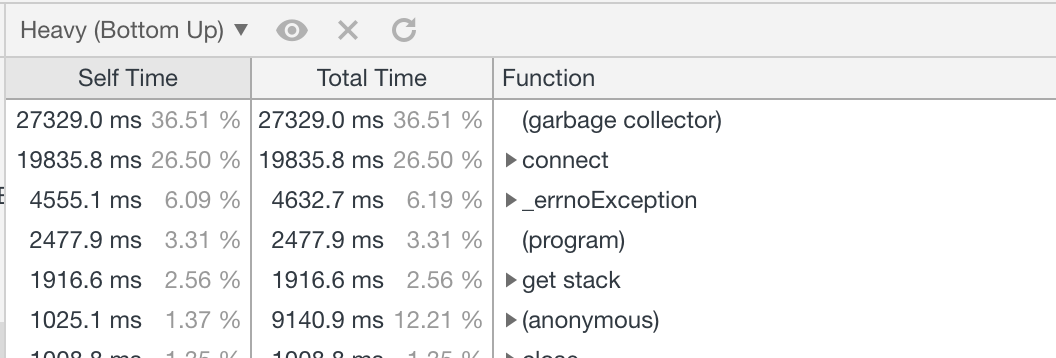
Well, consuming 75% of CPU time when only 1 client is connected is exactly your problem... It is not 'maxing' the CPU but still consuming an insane amount of resources. When you have 1 idle client sitting the whole trace should be 'program', not 'connect' / exception
If I read that right, the CPU is frequenly spiking/staying busy.
What you're reading here, is the full trace of your parse-server, handling many requests per seconds. Yes it is quite busy, that makes sense, but that's not related to live query at all. So I'm not sure what's the value at looking at it.
If you remove live query out of the equation, that will be the same no?
What I know fail to understand is:
- How is parse-server started
- How are the live query server stated
- How is the routing done in nginx
From your issue you say you added pure live query servers on C5.large, but for all it takes, the live query server is run in the same process as the parse-server.
So now if you really want ot debug your issue:
- start 'pure' live query servers, in their own processes, outside parse-server API (I thought that's what you did)
- use redis as you do.
- do not drive any http traffic to your live query server
You can also debug by connecting your local live query server to the production redis instance, this way it may be easier to understand the bottleneck. Without any client connection, your server would be hit by many messages per second, and you can perphaps see if the CPU is getting hit hard even without serving any data.
Also:
let parseApi = new ParseServer({
    databaseURI: `mongodb://${config.get('/mongo/userName')}:${config.get('/mongo/password')}@${config.get('/mongo/uri')}`, // Connection string for your MongoDB database
    appId: config.get('/parse/appId'),
    masterKey: config.get('/parse/masterKey'), // Keep this key secret!
    serverURL: `http://127.0.0.1:${config.get('/port/webapp')}/parse`,
    logLevel: "ERROR",
    sessionLength: ONE_DAY, // in seconds. Set to 24 hours.
    schemaCacheTTL: ONE_MONTH_MS, //"The TTL for caching the schema for optimizing read/write operations. You should put a long TTL when your DB is in production. default to 5000; set 0 to disable."
    cacheTTL: ONE_DAY_MS, //"Sets the TTL for the in memory cache (in ms), defaults to 5000 (5 seconds)"
    cacheMaxSize: 1000000, //"Sets the maximum size for the in memory cache, defaults to 10000"
    enableSingleSchemaCache: true //"Use a single schema cache shared across requests. Reduces number of queries made to _SCHEMA. Defaults to false, i.e. unique schema cache per request."
});
~the code above look wrong as you don't specify the list of live query classes. Why is that?~
You don't have to do all that, just use:
let httpServer = require('http').createServer(express());
httpServer.listen(config.get('/port/parseLiveQuery'));
let liveQueryParams = {
  appId: 'appId',
  javascriptKey: '',
  masterKey: '',
  serverURL: '...',
  redisURL: config.get('/server/redis')
};
let parseLiveQueryServer = ParseServer.createLiveQueryServer(httpServer, liveQueryParams);
@flovilmart
Thank you for that commentary. We may be getting to the root of the problem. The profile trace is only from my LiveQuery server, however, since it is also starting a parse server (un-used, BUT connected to the production Mongo) is that why we're seeing lots of parse server traffic?
Ok, first question then. How do you start just a pure live query server connected to redis?
This is what I'm using on the LiveQuery server to launch LiveQuery:
let parseApi = new ParseServer({
    databaseURI: `mongodb://${config.get('/mongo/userName')}:${config.get('/mongo/password')}@${config.get('/mongo/uri')}`, // Connection string for your MongoDB database
    appId: config.get('/parse/appId'),
    masterKey: config.get('/parse/masterKey'), // Keep this key secret!
    serverURL: `http://127.0.0.1:${config.get('/port/webapp')}/parse`,
    logLevel: "ERROR",
    sessionLength: ONE_DAY, // in seconds. Set to 24 hours.
    schemaCacheTTL: ONE_MONTH_MS, //"The TTL for caching the schema for optimizing read/write operations. You should put a long TTL when your DB is in production. default to 5000; set 0 to disable."
    cacheTTL: ONE_DAY_MS, //"Sets the TTL for the in memory cache (in ms), defaults to 5000 (5 seconds)"
    cacheMaxSize: 1000000, //"Sets the maximum size for the in memory cache, defaults to 10000"
    enableSingleSchemaCache: true //"Use a single schema cache shared across requests. Reduces number of queries made to _SCHEMA. Defaults to false, i.e. unique schema cache per request."
});

// Serve the Parse API on the /parse URL prefix
app.use('/parse', parseApi);

let port = config.get('/port/webapp');
let server = app.listen(port);
and then I use this to launch LiveQuery:
// Initialize a LiveQuery server instance, app is the express app of your Parse Server
if (config.get('/parseAppServerIsLocal')) {
    debug(`Starting Live Query Server on port ${config.get('/port/parseLiveQuery')}`);
    let httpServer = require('http').createServer(app);
    httpServer.listen(config.get('/port/parseLiveQuery'));
    let liveQueryParams = {
        redisURL: config.get('/server/redis')
    };
    let parseLiveQueryServer = ParseServer.createLiveQueryServer(httpServer,liveQueryParams);
}
To be clear this is only code on my LiveQuery server. For production servers, I include the LiveQuery class params for ParseServer:
On Production:
classNames: [...List of 12 classes...], // List of classes to support for query subscriptions
        redisURL: config.get('/server/redis')
How should I remove Parse Server from launching Live Query and just use Live Query? That, I haven't been able to figure out.
Just to be clear, the Parse Server that's standing up to support Live Query is connected to the production MongoDB, but it definetly is not exposed to the outside world and cannot accept parse server connections.
wfilleman
on 8 Oct 2018
Just to be clear, the Parse Server that's standing up to support Live Query is connected to the production MongoDB, but it definetly is not exposed to the outside world and cannot accept parse server connections.
That should be fine then, but I'd rather have the full parse-server separated which is the way for scaling it up. I would not expect the need to make calls to parse-server on each message.
See:
let httpServer = require('http').createServer(express());
httpServer.listen(config.get('/port/parseLiveQuery'));
let liveQueryParams = {
  appId: 'appId',
  javascriptKey: '',
  masterKey: '',
  serverURL: '...', // public URL for the parse-server to use
  redisURL: config.get('/server/redis')
};
let parseLiveQueryServer = ParseServer.createLiveQueryServer(httpServer, liveQueryParams);
One thing I overlooked, you mentioned ACL’s used roles, can you do the same with the server running with VERBOSE=1. It is fine to have a ‘sidekick’ parse-server as you have to prevent network.
I would guess that the roles queries are making your server slow.
Putting them externally may speed things up, but not guaranteed. Can you confirm?
flovilmart
on 9 Oct 2018
I'm deploying with your "lite" live query as you describe...Will report in a few min.
Yes. I'm using ACLs and the user's session token to get notified about changes to object in classes that the user "owns" via their ACL.
Wes
wfilleman
on 9 Oct 2018
Ok, the initial results are looking positive. I have another commitment right now, so I will let this run and will report back later tonight or first thing tomorrow.
Thank you so much for your time and help today. I think we're getting very close.
Wes
wfilleman
on 9 Oct 2018
@wfilleman can you check the branch on #4387 's PR (liveQuery-CLP) as it contains a shared cache for roles and it may impact your issue in a good way.
flovilmart
on 9 Oct 2018
@flovilmart WOW! Just loaded up https://github.com/parse-community/parse-server/pull/4387 and attached my 4 clients. CPU is between 1-3%. Incredible.
Confirmed: My issue was with the frequent accessing of the roles saturating the CPU. Your caching approach nailed my issue perfectly! THANK YOU!
Is there anything you want me to test? I'll leave these clients running here for a few hours and see how it does and report back.
Wes
wfilleman
on 9 Oct 2018
Keep those up, and add more perhaps, this Pr is a long time standing and we need to merge it somehow
flovilmart
on 9 Oct 2018
Can you test that all the ACL’s and roles are working properly? In the sense of only authorized objects are properly forwarded?
flovilmart
on 9 Oct 2018
@flovilmart I can confirm that the ACL's and roles are working perfectly so far. Just to give you a sense of scale, my production Parse Server is tracking nearly 1M objects and their status in real time. These are split between approx 2100 roles.
My test clients are logged in with a user with one role, and I'm correctly seeing the objects propagate to my clients with the role of the logged in user. So, the remaining 1.9M objects are correctly NOT flowing outside of their assigned roles.
Update:
With the initial good results this morning I switched back to using the Load Balancer and reduced the server way down to a t3.micro. I also went back to standing up my helper Parse Server on the LiveQuery server to reduce network traffic to the production Parse Server cluster. Four clients connected, and CPU is around 5-10%, and the CPU is tracking with the overall rate of object updates from my production servers. Daytime or after 8:00-9:00 am local the rate of updates are elevated till evening when they drop off.

I'm going to keep watching this today to make sure the CPU tracks with the object update rate and falls back down tonight with the frequency dropoff of object updates as expected tonight.
Tomorrow, once this test is complete, I'll work on standing up more clients to put a stress on this LiveQuery server deployment to see where it starts to max out.
So far, so good.
Wes
wfilleman
on 9 Oct 2018
So on a t3.micro you’re using 10% CPU, it ain’t bad given the quantity of traffic it gets :)
flovilmart
on 9 Oct 2018
I 100% agree. Here's the volume of network in/out on the LiveQuery Server as reference:

wfilleman
on 9 Oct 2018
I'm not sure I can explain the spike in network out from LiveQuery to the outside. Watching this today to see if I can correlate it with anything else. It's definitely related to the CPU doubling at the same time.
wfilleman
on 9 Oct 2018
@flovilmart Been running some long timed tests and running into an issue.
That last chart I posted with the jump in network out traffic is repeatable and with the jump in network out also spikes the CPU utilization. Here's what I'm testing and results:
- I changed the server size to a t3.small to stay under the 20% baseline CPU level as dictated by AWS.
- The t3.small is only hosting the LiveQuery server and it's helper Parse Server. It doesn't do any other work.
- I had 2 clients connected for 24 hours.
- CPU starts off at 2-3% but about 8 hours later jumps to 10-18%
Here's the moment that this happens:


In the logs of my clients, at the exact time of the CPU/network out spike, new updates of their monitored role objects stop flowing to the clients, but there are no errors. As in, the clients all think they are still connected to LiveQuery, but updates to their role objects stop flowing from LiveQuery to the client.
Thoughts/Questions:
- In LiveQuery are there any timeouts around caching that may explain the 8 hour window?
- In configuring the LiveQuery server are there any options to adjust cache values, timeout values, etc? For reference, this is how I'm configuring LiveQuery server based on your feedback:
let httpServer = require('http').createServer(express());
    httpServer.listen(config.get('/port/parseLiveQuery'));
    let liveQueryParams = {
        appId: config.get('/parse/appId'),
        javascriptKey: '',
        masterKey: config.get('/parse/masterKey'),
        serverURL: `http://127.0.0.1:${config.get('/port/webapp')}/parse`,
        redisURL: config.get('/server/redis')
    };
    let parseLiveQueryServer = ParseServer.createLiveQueryServer(httpServer, liveQueryParams);
I've reset the server and clients just now to reproduce this condition again. Yesterday it took about 8 hours with 2 clients connected to see the sudden spike in network out and CPU metric. If you have suggestions as to what to test or look for, I'm all ears. I'll report back this afternoon if the spike returns again.
Wes
wfilleman
on 12 Oct 2018
Hi @flovilmart,
Had that spike in network/cpu traffic this morning. This time LiveQuery made it 24 hours. Here's the network out graph from the last 2.5 days. You can see where I reboot LiveQuery and reconnect clients. The network out drops back to the 500-750KB range for a period of time:

Same effects on the clients. Clients were reporting receiving object updates until the spike in network/cpu and then no object updates after that. No errors in the client.
What can I test or get you to help figure out what's going on?
Wes
wfilleman
on 13 Oct 2018
Again profiling is your friend here, attaching the debugger to the process during the spikes and not during the spikes. We can probably compare which method is getting called more
flovilmart
on 13 Oct 2018
Ok, I can work on that. Another data point: Instead of rebooting the LiveQuery server, I just disconnected my two test clients and reconnected them. The Network Out dropped back to normal baseline levels (500KB).
So, now I'm thinking that maybe the client is getting into a weird state and putting a load on the LiveQuery server. What's the best way to log what's happening in the Parse/React Native LiveQuery client? I'm using Parse 2.1.0.
Wes
wfilleman
on 13 Oct 2018
The out network would mean that the server is sending the same events multiple times, this could occur perhaps if the client connects multiple times, and the server keeps all of those connections.
flovilmart
on 13 Oct 2018
Hi @flovilmart,
Took me a couple of days to reset and capture performance profiles, but here they are. Ok, here's the test setup:
- AWS t3.small server.
- LiveQuery Server ONLY. It is set up to connect to my production Parse Server so that we remove any Parse Server CPU cycles from the profile logs.
- Only one CPU/process.
- Two React Native clients.
With this test setup, I profiled two minutes of nominal activity. CPU was 1-2% and Network Out was around 500KB. This ran stable for 24 hours to the minute before the CPU jumped 4X and Network out went to 4MB (about 8X from baseline).
In the React Native clients, at the 24-hour mark, I see where the LiveQuery connection was closed and the client auto-retried to connect but was met with an error stating the "Session token is expired.". No further object updates flowed to the React Native clients (as expected if the session token expires). The React Native client isn't yet set up to detect this condition to re-login again.
At this exact moment, the LiveQuery server spiked CPU and NetworkOut and another 2-minute profile was captured. I'll let you take a look, but I'm seeing unhandled promise rejections in the profile capture and I'm wondering if that's due to the expired session token which then causes something in LiveQuery to cause the side-effects I'm seeing with 4X CPU and 8X Network out.
Thanks for sticking with me and investigating alongside. Let me know if you'd like me to capture anything else or run another test.
Wes
wfilleman
on 15 Oct 2018
Digging into the unhandled promise rejection, It looks like line 513 in ParseLiveQueryServer.js may be the source of my issue:
const roleNames = await auth.getUserRoles(); // Finally, see if any of the user's roles allow them read access
I suspect .getUserRoles() is throwing an exception due to the session token expiration. Buried in that call is a REST request to Parse Server which, I could see getting repeatedly hit if the cache no longer is preventing needless network traffic.
Wes
wfilleman
on 15 Oct 2018
Why would the session token expire so quickly?
flovilmart
on 16 Oct 2018
No idea. How can I change the expiration time?
wfilleman
on 16 Oct 2018
Well session tokens have expiration of a year. So that should not be problematic in the first place.
When you say ‘you suspect’ did you get any proof of it?
I don’t have the time to investigate further unfortunately.
flovilmart
on 16 Oct 2018
@wfilleman I see your config has this set
sessionLength: ONE_DAY, // in seconds. Set to 24 hours.
 dplewis
on 16 Oct 2018
dplewis
on 16 Oct 2018
Ah, there we go. I can remove that from production to use the default session lenght of one year. Thanks, @dplewis.
@flovilmart, The profile capture pointed to the exact top level promise that was throwing the uncaught promise exception. I looked at the source and there are two places inside this promise where await is used without a try/catch around it that is the likely source. Either line 513 or line 534 in ParseLiveQueryServer.js is throwing an uncaught exception when the session token expires which leads to the CPU/Network Out spike.
513 and 534 are marked by me below with **.
return Promise.resolve().then(async () => {
      // Resolve false right away if the acl doesn't have any roles
      const acl_has_roles = Object.keys(acl.permissionsById).some(key => key.startsWith('role:'));

      if (!acl_has_roles) {
        return false;
      }

      **const roleNames = await auth.getUserRoles(); // Finally, see if any of the user's roles allow them read access**

      for (const role of roleNames) {
        // We use getReadAccess as `role` is in the form `role:roleName`
        if (acl.getReadAccess(role)) {
          return true;
        }
      }

      return false;
    }).then(async isRoleMatched => {
      if (isRoleMatched) {
        return Promise.resolve(true);
      } // Check client sessionToken matches ACL


      const clientSessionToken = client.sessionToken;

      if (clientSessionToken) {
        const {
          userId
        } = **await this.getAuthForSessionToken(clientSessionToken);**
        return acl.getReadAccess(userId);
      } else {
        return isRoleMatched;
      }
    }).catch(() => {
      return false;
    });
Using the default of one year should be a fine workaround, but wanted to document here what we've uncovered incase there's a security need from other project use cases for a shorter session token length where this might become an issue.
Wes
wfilleman
on 16 Oct 2018
If you believe you have found the source of the issue, you should open a PR :)
flovilmart
on 16 Oct 2018
That is a good idea. I'm running a different set of tests currently to load up LiveQuery with a simulated 200 concurrent users with the kind of traffic my production server is producing to check that box. Assuming this looks good after 24 hours then I'll dig into the session token issue and see what that fix path looks like.
Wes
wfilleman
on 16 Oct 2018
Hi @flovilmart,
Everything is looking good. After running my 200 concurrent sessions for about 30 hours, CPU and Network Out metrics are stable at:
- CPU: 15-20%
- Network Out: 500KB-1MB
I think I am all set to move on with my project using LiveQuery. I saw that the https://github.com/parse-community/parse-server/pull/4387 pull hadn't been merged yet to main, if you were waiting on my test results, I think it's good to go from my perspective. In all my testing I've only ever seen object updates for roles my test users were assigned. Also, this fixes the original CPU issue.
I want to thank you for your patience and help to work through this with me. I'll take a look at the session token expiration issue I ran into and open a separate pull request. Otherwise, I'm considering this issue closed with the merging of https://github.com/parse-community/parse-server/pull/4387 into main.
Wes
wfilleman
on 17 Oct 2018
Thanks for providing the live production data that was invaluable and awesome! 😎
There is still this bug that screw up everything when session expire. That would need addressing.
flovilmart
on 18 Oct 2018
Thanks, @flovilmart! Parse has become my go-to for a stable and dev friendly backend on my (and client) projects. You and the maintenance team are doing great work.
Agreed about the session expire issue. It's on my list to investigate deeper but shouldn't hold up closing this original issue, now with the merge to main complete.
Wes
wfilleman
on 18 Oct 2018
Related issues
 jiawenzhang
·
4Comments
jiawenzhang
·
4Comments
 mohmagdy
·
3Comments
mohmagdy
·
3Comments
 yuzeh
·
3Comments
yuzeh
·
3Comments
 kilabyte
·
4Comments
kilabyte
·
4Comments
 lorki
·
3Comments
lorki
·
3Comments
Most helpful comment
So that's almost easy :)
Enable inspect mode on your node process
<pid>of your live query process withps aux | grep nodekill -usr1 <pid>(This will not kill the node process but send the USR1 signal. node is built to enable the inspector when receiving this signal).Forward the port
By default the debugger interface for your process should start on port 9229, if you're running the process on a remote server, then you need to ensure the port 9229 is properly open for inspection.
Chrome inspector
We use the chrome inspector to gather the profiles and process, open a new chrome tab an in the URL bar, enter:
chrome://inspectLocally this is what I see when debugging the parse-live-query-server process locally, in your case, this may be different:
Hit the
inspectlink and start recording the profile