Parity-ethereum: Archive node loses peers (stop syncing blocks)
- Parity Ethereum version: 2.4.6
- Operating system: Linux
- Installation: docker
- Fully synchronized: yes
- Network: ethereum mainnet
- Restarted: yes
Machine spec: 8 CPU 64GB ram, parity cache-size= 32GB
We have launched archive node and complete its sync. Today we update the node from 2.4.5. to 2.4.6 and run some software that fetch blocks information.
It's working, but peers connection is unstable and after some time node stop syncing blocks (it just displays Syncing 0.00 0.00 blk/s )
Below is examples of peers pump and down logs and last blocks (reversed order)
peers info
2019-06-05 20:32:52 UTC   12/25 peers     60 MiB chain   17 MiB db  0 bytes queue   79 KiB sync  RPC:  1 conn,    1 req/s, 34380 µs
--
2019-06-05 20:32:12 UTC   10/25 peers     54 MiB chain   17 MiB db  0 bytes queue   79 KiB sync  RPC:  1 conn,    1 req/s, 32475 µs
2019-06-05 20:31:40 UTC   10/25 peers     53 MiB chain   17 MiB db  0 bytes queue   79 KiB sync  RPC:  1 conn,    1 req/s, 32475 µs
2019-06-05 20:31:05 UTC    9/25 peers     53 MiB chain   17 MiB db  0 bytes queue   79 KiB sync  RPC:  1 conn,    1 req/s, 24494 µs
2019-06-05 20:30:34 UTC    9/25 peers     53 MiB chain   17 MiB db  0 bytes queue   79 KiB sync  RPC:  1 conn,    1 req/s, 17362 µs
2019-06-05 20:29:55 UTC    9/25 peers     53 MiB chain   17 MiB db  0 bytes queue   79 KiB sync  RPC:  1 conn,    1 req/s, 18661 µs
2019-06-05 20:29:20 UTC    9/25 peers     53 MiB chain   17 MiB db  0 bytes queue   79 KiB sync  RPC:  1 conn,    7 req/s, 17362 µs
2019-06-05 20:28:49 UTC    9/25 peers     52 MiB chain   16 MiB db  0 bytes queue   82 KiB sync  RPC:  1 conn,    1 req/s, 32642 µs
2019-06-05 20:28:15 UTC   10/25 peers     49 MiB chain   16 MiB db  0 bytes queue   79 KiB sync  RPC:  1 conn,    1 req/s, 31118 µs
2019-06-05 20:27:41 UTC    6/25 peers     48 MiB chain   16 MiB db  0 bytes queue   79 KiB sync  RPC:  1 conn,    2 req/s, 25000 µs
2019-06-05 20:27:05 UTC    5/25 peers     48 MiB chain   16 MiB db  0 bytes queue   79 KiB sync  RPC:  1 conn,    0 req/s, 25000 µs
2019-06-05 20:26:33 UTC    5/25 peers     48 MiB chain   16 MiB db  0 bytes queue   79 KiB sync  RPC:  1 conn,    1 req/s, 20223 µs
2019-06-05 20:26:00 UTC    5/25 peers     48 MiB chain   16 MiB db  0 bytes queue   80 KiB sync  RPC:  1 conn,    1 req/s, 33003 µs
2019-06-05 20:26:00 UTC    4/25 peers     48 MiB chain   16 MiB db  0 bytes queue   80 KiB sync  RPC:  1 conn,    1 req/s, 33003 µs
2019-06-05 20:25:11 UTC    5/25 peers     48 MiB chain   16 MiB db  0 bytes queue   79 KiB sync  RPC:  1 conn,    0 req/s, 33558 µs
2019-06-05 20:24:33 UTC    6/25 peers     47 MiB chain   16 MiB db  0 bytes queue   79 KiB sync  RPC:  1 conn,    0 req/s, 33558 µs
2019-06-05 20:23:53 UTC    8/25 peers     47 MiB chain   16 MiB db  0 bytes queue   79 KiB sync  RPC:  1 conn,    1 req/s, 30569 µs
2019-06-05 20:23:53 UTC    8/25 peers     47 MiB chain   16 MiB db  0 bytes queue   79 KiB sync  RPC:  1 conn,    1 req/s, 30569 µs
2019-06-05 20:23:11 UTC    8/25 peers     47 MiB chain   16 MiB db  0 bytes queue   79 KiB sync  RPC:  1 conn,    1 req/s, 26161 µs
2019-06-05 20:22:43 UTC Updated conversion rate to Ξ1 = US$248.89 (19132568 wei/gas)
2019-06-05 20:22:40 UTC    7/25 peers     47 MiB chain   16 MiB db  0 bytes queue   79 KiB sync  RPC:  1 conn,    1 req/s, 17618 µs
2019-06-05 20:22:16 UTC    8/25 peers     47 MiB chain   16 MiB db  0 bytes queue   79 KiB sync  RPC:  1 conn,    0 req/s, 15189 µs
2019-06-05 20:21:37 UTC    8/25 peers     46 MiB chain   16 MiB db  0 bytes queue   79 KiB sync  RPC:  1 conn,    4 req/s, 21464 µs
2019-06-05 20:21:02 UTC    7/25 peers     44 MiB chain   15 MiB db  0 bytes queue   79 KiB sync  RPC:  1 conn,    0 req/s, 25221 µs
2019-06-05 20:21:02 UTC    7/25 peers     44 MiB chain   15 MiB db  0 bytes queue   79 KiB sync  RPC:  1 conn,    0 req/s, 25221 µs
2019-06-05 20:20:31 UTC    7/25 peers     43 MiB chain   15 MiB db  0 bytes queue   79 KiB sync  RPC:  1 conn,    0 req/s, 25221 µs
2019-06-05 20:19:50 UTC    5/25 peers     43 MiB chain   15 MiB db  0 bytes queue   79 KiB sync  RPC:  1 conn,    3 req/s, 25221 µs
stuck on block
2019-06-05 20:36:00 UTC Syncing #7901361 0xd3df…ad5c     0.00 blk/s    0.0 tx/s    0.0 Mgas/s      0+    0 Qed  #7895893   21/25 peers     62 MiB chain   17 MiB db  0 bytes queue  443 MiB sync  RPC:  1 conn,    0 req/s, 46705 µs
2019-06-05 20:35:55 UTC Syncing #7901361 0xd3df…ad5c     0.00 blk/s    0.0 tx/s    0.0 Mgas/s      0+    0 Qed  #7893988   21/25 peers     62 MiB chain   17 MiB db  0 bytes queue  355 MiB sync  RPC:  1 conn,    1 req/s, 46705 µs
2019-06-05 20:35:50 UTC Syncing #7901361 0xd3df…ad5c     0.00 blk/s    0.0 tx/s    0.0 Mgas/s      0+    0 Qed  #7893988   21/25 peers     62 MiB chain   17 MiB db  0 bytes queue  176 MiB sync  RPC:  1 conn,    1 req/s, 46705 µs
2019-06-05 20:35:45 UTC Syncing #7901361 0xd3df…ad5c     0.00 blk/s    0.0 tx/s    0.0 Mgas/s      0+    0 Qed  #7892083   20/25 peers     62 MiB chain   17 MiB db  0 bytes queue  147 MiB sync  RPC:  1 conn,    1 req/s, 38701 µs
2019-06-05 20:35:40 UTC Syncing #7901361 0xd3df…ad5c     0.00 blk/s    0.0 tx/s    0.0 Mgas/s      0+    0 Qed  #7885225   21/25 peers     62 MiB chain   17 MiB db  0 bytes queue  551 MiB sync  RPC:  1 conn,    0 req/s, 38701 µs
2019-06-05 20:35:35 UTC Syncing #7901361 0xd3df…ad5c     0.00 blk/s    0.0 tx/s    0.0 Mgas/s      0+    0 Qed  #7885225   19/25 peers     62 MiB chain   17 MiB db  0 bytes queue  401 MiB sync  RPC:  1 conn,    1 req/s, 38701 µs
2019-06-05 20:35:30 UTC Syncing #7901361 0xd3df…ad5c     0.00 blk/s    0.0 tx/s    0.0 Mgas/s      0+    0 Qed  #7885225   19/25 peers     62 MiB chain   17 MiB db  0 bytes queue  318 MiB sync  RPC:  1 conn,    1 req/s, 38701 µs
2019-06-05 20:35:25 UTC Syncing #7901361 0xd3df…ad5c     0.00 blk/s    0.0 tx/s    0.0 Mgas/s      0+    0 Qed  #7885225   19/25 peers     62 MiB chain   17 MiB db  0 bytes queue  212 MiB sync  RPC:  1 conn,    0 req/s, 33990 µs
2019-06-05 20:35:20 UTC Syncing #7901361 0xd3df…ad5c     0.00 blk/s    0.0 tx/s    0.0 Mgas/s      0+    0 Qed  #7884971   17/25 peers     62 MiB chain   17 MiB db  0 bytes queue  140 MiB sync  RPC:  1 conn,    1 req/s, 33990 µs
2019-06-05 20:35:15 UTC Syncing #7901361 0xd3df…ad5c     0.00 blk/s    0.0 tx/s    0.0 Mgas/s      0+    0 Qed  #7884971   16/25 peers     61 MiB chain   17 MiB db  0 bytes queue   60 MiB sync  RPC:  1 conn,    2 req/s, 33990 µs
2019-06-05 20:35:10 UTC Syncing #7901361 0xd3df…ad5c     0.00 blk/s    0.0 tx/s    0.0 Mgas/s      0+    0 Qed  #7884971   18/25 peers     61 MiB chain   17 MiB db  0 bytes queue   87 KiB sync  RPC:  1 conn,    1 req/s, 33990 µs
2019-06-05 20:35:08 UTC Syncing #7901361 0xd3df…ad5c     0.60 blk/s   59.2 tx/s    4.8 Mgas/s      0+    0 Qed  #7884971   17/25 peers     61 MiB chain   17 MiB db  0 bytes queue   79 KiB sync  RPC:  1 conn,    2 req/s, 32341 µs
2019-06-05 20:35:01 UTC Reorg to #7901360 0xba42…c2a0 (0x8d58…2732 #7901358 0x9dc9…e404 0x3b25…123b)
2019-06-05 20:35:00 UTC Syncing #7901359 0x8d58…2732     0.00 blk/s    0.0 tx/s    0.0 Mgas/s      0+    1 Qed  #7901360   13/25 peers     61 MiB chain   17 MiB db   98 KiB queue   80 KiB sync  RPC:  1 conn,    0 req/s, 33990 µs
2019-06-05 20:34:55 UTC Syncing #7901359 0x8d58…2732     0.00 blk/s    0.0 tx/s    0.0 Mgas/s      0+    0 Qed  #7901358   11/25 peers     61 MiB chain   17 MiB db  0 bytes queue   81 KiB sync  RPC:  1 conn,    1 req/s, 29244 µs
2019-06-05 20:34:51 UTC Syncing #7901359 0x8d58…2732     0.00 blk/s    0.0 tx/s    0.0 Mgas/s      0+    0 Qed  #7901358   11/25 peers     61 MiB chain   17 MiB db  0 bytes queue   79 KiB sync  RPC:  1 conn,    0 req/s, 29244 µs
2019-06-05 20:34:46 UTC Syncing #7901359 0x8d58…2732     0.00 blk/s    0.0 tx/s    0.0 Mgas/s      0+    0 Qed  #7901358   11/25 peers     61 MiB chain   17 MiB db  0 bytes queue   79 KiB sync  RPC:  1 conn,    0 req/s, 29244 µs
2019-06-05 20:34:45 UTC Syncing #7901359 0x8d58…2732     0.00 blk/s    0.0 tx/s    0.0 Mgas/s      0+    0 Qed  #7901358   11/25 peers     61 MiB chain   17 MiB db  0 bytes queue   79 KiB sync  RPC:  1 conn,    0 req/s, 29244 µs
2019-06-05 20:34:45 UTC Syncing #7901359 0x8d58…2732     0.00 blk/s    0.0 tx/s    0.0 Mgas/s      0+    0 Qed  #7901358   10/25 peers     61 MiB chain   17 MiB db  0 bytes queue   79 KiB sync  RPC:  1 conn,    0 req/s, 29244 µs
2019-06-05 20:34:44 UTC Syncing #7901359 0x8d58…2732     0.06 blk/s    6.6 tx/s    0.4 Mgas/s      0+    0 Qed  #7901358   11/25 peers     61 MiB chain   17 MiB db  0 bytes queue   79 KiB sync  RPC:  1 conn,    1 req/s, 29244 µs
2019-06-05 20:34:30 UTC Imported #7901359 0x8d58…2732 (102 txs, 7.99 Mgas, 709 ms, 29.14 KiB)
2019-06-05 20:34:09 UTC Imported #7901358 0x9dc9…e404 (136 txs, 7.99 Mgas, 632 ms, 34.54 KiB)
2019-06-05 20:34:09 UTC   10/25 peers     61 MiB chain   17 MiB db  0 bytes queue   79 KiB sync  RPC:  1 conn,    0 req/s, 23838 µs
2019-06-05 20:33:43 UTC Imported #7901357 0xec21…a3fd (118 txs, 8.00 Mgas, 563 ms, 28.45 KiB)
Also we have usual full node and it's not faced this issue (it's just continue syncing normaly)
After archive node restart it continuous syncing
Is it a bug? Or maybe we can do something to prevent restarting every two hours?
Thanks in advance
 APshenkin
All 100 comments

So found another strange behaviour. It looks like archive node take all 32GB cache. And when it uses all cache then it stucks
APshenkin
on 5 Jun 2019
@APshenkin if you specify a cache_size, parity will try to use all of that as cache, that is expected. Some memory will also be used beyond that during normal operation.
Things I am concerned about -
The node getting stuck after its cache fills
The large reorg that happened right before your node got stuck
 joshua-mir
on 5 Jun 2019
joshua-mir
on 5 Jun 2019
Yes I'm agreed, but it strange, that it stucks each time when cache fills (this was several times today already)
Feel free to ask any other questions
Will post some info here if this will occur again
APshenkin
on 5 Jun 2019
@joshua-mir So this occurs again
2019-06-06 02:10:45 UTC Syncing #7902878 0x4a3b…110b     0.00 blk/s    0.0 tx/s    0.0 Mgas/s      0+    0 Qed    #49400   24/25 peers    410 MiB chain   49 MiB db  0 bytes queue   50 MiB sync  RPC:  1 conn,    2 req/s, 44139 µs
--
2019-06-06 02:10:40 UTC Syncing #7902878 0x4a3b…110b     0.00 blk/s    0.0 tx/s    0.0 Mgas/s      0+    0 Qed    #49400   24/25 peers    402 MiB chain   49 MiB db  0 bytes queue   45 MiB sync  RPC:  1 conn,    1 req/s, 44139 µs
2019-06-06 02:10:35 UTC Syncing #7902878 0x4a3b…110b     0.00 blk/s    0.0 tx/s    0.0 Mgas/s      0+    0 Qed    #49400   23/25 peers    381 MiB chain   49 MiB db  0 bytes queue   28 MiB sync  RPC:  1 conn,    0 req/s, 44139 µs
2019-06-06 02:10:30 UTC Syncing #7902878 0x4a3b…110b     0.00 blk/s    0.0 tx/s    0.0 Mgas/s      0+    0 Qed    #46733   23/25 peers    366 MiB chain   49 MiB db  0 bytes queue   18 MiB sync  RPC:  1 conn,    1 req/s, 44139 µs
2019-06-06 02:10:25 UTC Syncing #7902878 0x4a3b…110b     0.00 blk/s    0.0 tx/s    0.0 Mgas/s      0+    0 Qed    #32382   20/25 peers    351 MiB chain   49 MiB db  0 bytes queue   16 MiB sync  RPC:  1 conn,    0 req/s, 44139 µs
2019-06-06 02:10:20 UTC Syncing #7902878 0x4a3b…110b     0.00 blk/s    0.0 tx/s    0.0 Mgas/s      0+    0 Qed    #57149   22/25 peers    341 MiB chain   49 MiB db  0 bytes queue   24 MiB sync  RPC:  1 conn,    2 req/s, 44139 µs
2019-06-06 02:10:15 UTC Syncing #7902878 0x4a3b…110b     0.00 blk/s    0.0 tx/s    0.0 Mgas/s      0+    0 Qed    #55119   17/25 peers    340 MiB chain   49 MiB db  0 bytes queue   18 MiB sync  RPC:  1 conn,    1 req/s, 44139 µs
2019-06-06 02:10:10 UTC Syncing #7902878 0x4a3b…110b     0.00 blk/s    0.0 tx/s    0.0 Mgas/s      0+    0 Qed    #47370   18/25 peers    337 MiB chain   49 MiB db  0 bytes queue   17 MiB sync  RPC:  1 conn,    0 req/s, 44139 µs
2019-06-06 02:10:05 UTC Syncing #7902878 0x4a3b…110b     0.00 blk/s    0.0 tx/s    0.0 Mgas/s      0+    0 Qed    #36835   18/25 peers    334 MiB chain   49 MiB db  0 bytes queue   18 MiB sync  RPC:  1 conn,    1 req/s, 44139 µs
2019-06-06 02:10:00 UTC Syncing #7902878 0x4a3b…110b     0.00 blk/s    0.0 tx/s    0.0 Mgas/s      0+    0 Qed    #54610   18/25 peers    333 MiB chain   49 MiB db  0 bytes queue   29 MiB sync  RPC:  1 conn,    0 req/s, 44139 µs
2019-06-06 02:09:55 UTC Syncing #7902878 0x4a3b…110b     0.00 blk/s    0.0 tx/s    0.0 Mgas/s      0+    0 Qed    #54610   12/25 peers    328 MiB chain   49 MiB db  0 bytes queue   27 MiB sync  RPC:  1 conn,    1 req/s, 44139 µs
2019-06-06 02:09:50 UTC Syncing #7902878 0x4a3b…110b     0.00 blk/s    0.0 tx/s    0.0 Mgas/s      0+    0 Qed    #54610   11/25 peers    328 MiB chain   49 MiB db  0 bytes queue   13 MiB sync  RPC:  1 conn,    1 req/s, 44139 µs
2019-06-06 02:09:45 UTC Syncing #7902878 0x4a3b…110b     0.00 blk/s    0.0 tx/s    0.0 Mgas/s      0+    0 Qed    #50805   10/25 peers    327 MiB chain   49 MiB db  0 bytes queue   11 MiB sync  RPC:  1 conn,    0 req/s, 44102 µs
2019-06-06 02:09:40 UTC Syncing #7902878 0x4a3b…110b     0.00 blk/s    0.0 tx/s    0.0 Mgas/s      0+    0 Qed    #45214    9/25 peers    327 MiB chain   49 MiB db  0 bytes queue   12 MiB sync  RPC:  1 conn,    1 req/s, 44102 µs
2019-06-06 02:09:35 UTC Syncing #7902878 0x4a3b…110b     0.00 blk/s    0.0 tx/s    0.0 Mgas/s      0+    0 Qed    #38751    9/25 peers    326 MiB chain   49 MiB db  0 bytes queue    9 MiB sync  RPC:  1 conn,    0 req/s, 43872 µs
2019-06-06 02:09:30 UTC Syncing #7902878 0x4a3b…110b     0.00 blk/s    0.0 tx/s    0.0 Mgas/s      0+    0 Qed    #35941    8/25 peers    326 MiB chain   49 MiB db  0 bytes queue    7 MiB sync  RPC:  1 conn,    1 req/s, 43872 µs
2019-06-06 02:09:25 UTC Syncing #7902878 0x4a3b…110b     0.00 blk/s    0.0 tx/s    0.0 Mgas/s      0+    0 Qed    #29726    6/25 peers    325 MiB chain   49 MiB db  0 bytes queue    8 MiB sync  RPC:  1 conn,    0 req/s, 43800 µs
2019-06-06 02:09:20 UTC Syncing #7902878 0x4a3b…110b     0.00 blk/s    0.0 tx/s    0.0 Mgas/s      0+    0 Qed    #25527    6/25 peers    324 MiB chain   49 MiB db  0 bytes queue    5 MiB sync  RPC:  1 conn,    2 req/s, 43800 µs
2019-06-06 02:09:15 UTC Syncing #7902878 0x4a3b…110b     0.00 blk/s    0.0 tx/s    0.0 Mgas/s      0+    0 Qed    #19685    4/25 peers    324 MiB chain   49 MiB db  0 bytes queue    4 MiB sync  RPC:  1 conn,    2 req/s, 43800 µs
2019-06-06 02:09:10 UTC Syncing #7902878 0x4a3b…110b     0.00 blk/s    0.0 tx/s    0.0 Mgas/s      0+    0 Qed    #16025    4/25 peers    324 MiB chain   49 MiB db  0 bytes queue    3 MiB sync  RPC:  1 conn,    1 req/s, 43800 µs
2019-06-06 02:09:05 UTC Syncing #7902878 0x4a3b…110b     0.00 blk/s    0.0 tx/s    0.0 Mgas/s      0+    0 Qed    #11811    4/25 peers    324 MiB chain   49 MiB db  0 bytes queue    2 MiB sync  RPC:  1 conn,    1 req/s, 43800 µs
2019-06-06 02:09:00 UTC Syncing #7902878 0x4a3b…110b     0.00 blk/s    0.0 tx/s    0.0 Mgas/s      0+    0 Qed     #9525    4/25 peers    324 MiB chain   49 MiB db  0 bytes queue    2 MiB sync  RPC:  1 conn,    1 req/s, 43328 µs
2019-06-06 02:08:55 UTC Syncing #7902878 0x4a3b…110b     0.00 blk/s    0.0 tx/s    0.0 Mgas/s      0+    0 Qed     #6731    3/25 peers    324 MiB chain   49 MiB db  0 bytes queue    1 MiB sync  RPC:  1 conn,    1 req/s, 43328 µs
2019-06-06 02:08:50 UTC Syncing #7902878 0x4a3b…110b     0.00 blk/s    0.0 tx/s    0.0 Mgas/s      0+    0 Qed     #4462    3/25 peers    324 MiB chain   49 MiB db  0 bytes queue    1 MiB sync  RPC:  1 conn,    2 req/s, 40224 µs
2019-06-06 02:08:45 UTC Syncing #7902878 0x4a3b…110b     0.00 blk/s    0.0 tx/s    0.0 Mgas/s      0+    0 Qed      #896    5/25 peers    320 MiB chain   49 MiB db  0 bytes queue    1 MiB sync  RPC:  1 conn,    1 req/s, 40224 µs
2019-06-06 02:08:40 UTC Syncing #7902878 0x4a3b…110b     0.00 blk/s    0.0 tx/s    0.0 Mgas/s      0+    0 Qed        #0    3/25 peers    320 MiB chain   49 MiB db  0 bytes queue   79 KiB sync  RPC:  1 conn,    1 req/s, 40224 µs
2019-06-06 02:08:35 UTC Syncing #7902878 0x4a3b…110b     0.00 blk/s    0.0 tx/s    0.0 Mgas/s      0+    0 Qed  #7902859    3/25 peers    319 MiB chain   49 MiB db  0 bytes queue   79 KiB sync  RPC:  1 conn,    0 req/s, 33841 µs
2019-06-06 02:08:10 UTC    0/25 peers    319 MiB chain   49 MiB db  0 bytes queue   79 KiB sync  RPC:  1 conn,    0 req/s, 33841 µs
2019-06-06 02:08:00 UTC Imported #7902878 0x4a3b…110b (184 txs, 6.98 Mgas, 688 ms, 24.98 KiB)
2019-06-06 02:07:46 UTC Imported #7902877 0xb5de…c514 (35 txs, 3.82 Mgas, 224 ms, 7.07 KiB) + another 1 block(s) containing 207 tx(s)
2019-06-06 02:07:31 UTC    1/25 peers    318 MiB chain   49 MiB db  0 bytes queue   79 KiB sync  RPC:  1 conn,    0 req/s, 33841 µs
2019-06-06 02:07:20 UTC Imported #7902874 0xc496…7548 (129 txs, 7.99 Mgas, 3102 ms, 20.17 KiB) + another 6 block(s) containing 765 tx(s)
2019-06-06 02:07:07 UTC Reorg to #7902867 0xd356…d615 (0x8082…84ab #7902866 0x794a…7153 )
2019-06-06 02:06:55 UTC    0/25 peers    318 MiB chain   48 MiB db  0 bytes queue   79 KiB sync  RPC:  1 conn,    0 req/s, 38258 µs
2019-06-06 02:06:24 UTC    1/25 peers    318 MiB chain   48 MiB db  0 bytes queue   79 KiB sync  RPC:  1 conn,    1 req/s, 38258 µs
2019-06-06 02:05:32 UTC Imported #7902867 0x8082…84ab (62 txs, 7.99 Mgas, 415 ms, 7.37 KiB)
2019-06-06 02:05:31 UTC    4/25 peers    318 MiB chain   48 MiB db  0 bytes queue   79 KiB sync  RPC:  1 conn,    3 req/s, 30119 µs
2019-06-06 02:05:31 UTC    4/25 peers    318 MiB chain   48 MiB db  0 bytes queue   79 KiB sync  RPC:  1 conn,    3 req/s, 30119 µs
2019-06-06 02:05:31 UTC Imported #7902866 0x794a…7153 (138 txs, 7.99 Mgas, 582 ms, 20.54 KiB)
2019-06-06 02:05:19 UTC Imported #7902862 0x91d9…c746 (93 txs, 8.01 Mgas, 894 ms, 15.32 KiB) + another 1 block(s) containing 139 tx(s)
2019-06-06 02:05:04 UTC Imported #7902860 0x34ce…49cc (203 txs, 8.00 Mgas, 564 ms, 34.38 KiB)
2019-06-06 02:04:40 UTC    4/25 peers    317 MiB chain   48 MiB db  0 bytes queue   79 KiB sync  RPC:  1 conn,    2 req/s, 21974 µs
2019-06-06 02:04:40 UTC    4/25 peers    317 MiB chain   48 MiB db  0 bytes queue   79 KiB sync  RPC:  1 conn,    2 req/s, 21974 µs
2019-06-06 02:04:40 UTC Imported #7902859 0x66cb…b7a0 (150 txs, 8.00 Mgas, 572 ms, 18.83 KiB)
2019-06-06 02:04:26 UTC Imported #7902858 0xbaed…6107 (242 txs, 7.92 Mgas, 504 ms, 36.30 KiB)
2019-06-06 02:04:11 UTC    4/25 peers    317 MiB chain   48 MiB db  0 bytes queue   79 KiB sync  RPC:  1 conn,    1 req/s, 18733 µs
And in this case parity wasn't use all memory

APshenkin
on 6 Jun 2019
Also maybe it will help somehow: We use trace_replayBlockTransactions API for each new generated block.
APshenkin
on 6 Jun 2019
that's an extremely heavy rpc method - it could very well be one of the causes of the problem here if you see it taking a while to return a response.
joshua-mir
on 6 Jun 2019
No, It's completes very fast. E.g. after syncing node after restart it completes ~ 150 success request per minute
APshenkin
on 6 Jun 2019
It's strange, but looks like increase disk space solve the issue.
There were ~120 GB free space. After increasing to ~ 500 GB issue was solved.
Our parity node doesn't stuck 4 hours already (previosly it stucks in 1-2 hours)
Also it's strange, but after increating disk space Active memory value was droped down 🤔

Will continue monitoring
APshenkin
on 6 Jun 2019
Just to warn you, 500gb will not be sufficient for an archive node (once you are in sync) - you will need upwards of 2tb. You don't want to hit a full disk either because it's a known issue that full disks can cause database corruption.
joshua-mir
on 6 Jun 2019
Our node is already synced up 😄
Current disk size 3.328Tb
parity folder size 2.6Tb
APshenkin
on 6 Jun 2019
Ah, you increased by 500gb, not to 500gb, misunderstood that 😅
joshua-mir
on 6 Jun 2019
Yes, sorry for that 🤷♂️
APshenkin
on 6 Jun 2019
So 9 hours without stopping blocks import!
I still think that it's strange behaviour (there was ~128 GB free disk space) but parity started working well only after increasing this value to ~ 500GB
APshenkin
on 6 Jun 2019
So 9 hours without stopping blocks import!
I still think that it's strange behaviour (there was ~128 GB free disk space) but parity started working well only after increasing this value to ~ 500GB
We've got more than 1TB free and I've seen parity getting stuck this morning. Doesn't seem like the free space has any influence on the issue.
 lacasian
on 7 Jun 2019
lacasian
on 7 Jun 2019
Agreed. Today we rebooted our node and after this we noticed, that after blocks syncing it lost all peers and stucks again (
APshenkin
on 8 Jun 2019
Related to #10626. I am having the exact same issue - 800GB free disk on 2 x 2TB SSD in raid0.
 dafky2000
on 12 Jun 2019
dafky2000
on 12 Jun 2019
Hi! I have like the same issue with my archive node, but after some time the peers come back and the parity prints some empty newlines instead of status message.
Here is the log, the issue starts around 2019-06-17 04:21:49, please take a look:
https://www.fusionsolutions.io/doc/ethlog.tar.gz
This happens weekly 1-2 times.
 iFA88
on 17 Jun 2019
iFA88
on 17 Jun 2019
Today the node has stopped about 10 times. I have added reversed peer which points to my other parity node on the same server, so have "survived" many peer drop period. But now has been stopped syncing:
2019-06-17 21:19:57  Syncing #7977726 0x4195…29fe     0.00 blk/s    0.0 tx/s    0.0 Mgas/s      0+   20 Qed  #7977745   42/256 peers    482 MiB chain   80 MiB db    3 MiB queue  155 KiB sync  RPC:  0 conn,   97 req/s,
2019-06-17 21:19:57  Syncing #7977726 0x4195…29fe     0.00 blk/s    0.0 tx/s    0.0 Mgas/s      0+   20 Qed  #7977745   42/256 peers    482 MiB chain   80 MiB db    3 MiB queue  155 KiB sync  RPC:  0 conn,   97 req/s,
htop says that the node uses a lot of disk r/w:
NI   PID USER      PRI  VIRT   RES CPU% MEM%   TIME+     DISK R/W NLWP Command
  0  5744 nodes      20 15.5G 12.1G 31.0 19.2  3h23:18  136.54 M/s   66 parity --reserved-p
Only the restart helps, if the devs needs any trace i can help.
iFA88
on 17 Jun 2019
@iFA88 @APshenkin can you please reproduce the issue with this trace enabled: -l sync=trace (add this to your Parity's startup parameters)? Thanks!
 grbIzl
on 20 Jun 2019
grbIzl
on 20 Jun 2019
@iFA88 @APshenkin can you please reproduce the issue with this trace enabled: -l sync=trace (add this to your Parity's startup parameters)? Thanks!
Yes, I ran now with that parameter.
When i use the following parameters --interface local --no-discovery --reserved-only and give reversed peer to my other full node, then it works fine.
UPDATE
May this flag is not an option.. that generates too much logs (2 mb / min) no one ever will read that, even i don't see if hangs or not.
iFA88
on 20 Jun 2019
May this flag is not an option.. that generates too much logs (2 mb / min) no one ever will read that, even i don't see if hangs or not.
I will try to manage it.
grbIzl
on 21 Jun 2019
About 24 hour log: https://www.fusionsolutions.io/doc/paritylog.tar.gz (1.2gb)
The node is currently in sync, i don't see when the node loses the sync during the time.
iFA88
on 21 Jun 2019
@iFA88 Thanks for the log! As I can see, the sync process in it is happening without stuck:
- The logging ends at 2019-06-21 17:21:40
- The last imported block before it was at:
2019-06-21 17:21:33 Verifier #11 INFO import Imported #8002255 0x63ba…08ed (181 txs, 7.99 Mgas, 1412 ms, 33.55 KiB)
Your node seems to be fully synced (the last block on mainnet right now is #8,002,908)
grbIzl
on 21 Jun 2019
I have written now a script what gets the current block in every minute from my nodes, example:
[2019-06-21 20:05:36.065820] OK [archive: 8002961] [full: 8002961] [peers: 30/50]
When its stuck we can see them easy.
iFA88
on 21 Jun 2019
Hey, I think i have reproduced a little sister of the issue:
https://www.fusionsolutions.io/doc/archivelog.tar.gz
Little sister, because in 5 mins the sync has continued, but the peers has been dropped/disconnected. I hope it helps something. Previous when the sync has been stopped and all peer dropped, then I got only peers who not synced full for hours.
iFA88
on 24 Jun 2019
@iFA88 thanks for the log again! I think, I've found one suspicious place, that could lead to the described behavior. I will proceed with PR for it
grbIzl
on 24 Jun 2019
@iFA88 do you mind helping with my patch's verification? If yes, can you just build parity from https://github.com/paritytech/parity-ethereum/pull/10772 or it would be easier for you, if we just provide binaries?
grbIzl
on 24 Jun 2019
@grbIzl That seems an easy patch :) Sadly i did not have building tools now for that. If you can build with Github, then I can use that.
Update
Okay, thank you! I will use now that.
iFA88
on 24 Jun 2019
@iFA88 you can use this binary for linux https://gitlab.parity.io/parity/parity-ethereum/-/jobs/167794/artifacts/download Let me know, if it's not accessible for you. Please use the same startup flags (with sync trace enabled) and your super watcher script.
grbIzl
on 24 Jun 2019
@grbIzl Thank you, already using that. I worry a little, because i have used stable repo (Parity-Ethereum/v2.4.6-stable-94164e1-20190514/x86_64-linux-gnu/rustc1.34.1
) and this is now Parity-Ethereum/v2.6.0-nightly-17e5d8c-20190624/x86_64-linux-gnu/rustc1.35.0.
iFA88
on 24 Jun 2019
@iFA88 if your node performs something critical, you should not proceed and let me know, i'll try to create a patch build basing on 2.4.6
grbIzl
on 24 Jun 2019
@grbIzl I already run it, it seems it works. I will report with the log when the issue appears.
iFA88
on 24 Jun 2019
@grbIzl may it happened again, please check it: https://www.fusionsolutions.io/doc/archivelog.tar.gz
Around 16:54:58 many peers have been dropped.
iFA88
on 24 Jun 2019
@iFA88 for now I don't see anything suspicious in this log. Nearly all peers were dropped in this timeframe because of connection timeout (some blink in network?)
grbIzl
on 24 Jun 2019
@grbIzl Nope, the network works well, my full node on the same system: https://gist.github.com/iFA88/3da803cb06bc9b859bf4eec29629dad5
iFA88
on 24 Jun 2019
@grbIzl Nope, the network works well, my full node on the same system: https://gist.github.com/iFA88/3da803cb06bc9b859bf4eec29629dad5
Ok. Got it. Let's do the following. Leave your node for several hours (till tomorrow), so we'll see how significant is the issue. If it is, I'll ask you to add one more tracing flag in order to go deeper to the network layer. It will increase log's size even more, but that should show, if there is an error somewhere and peers drop has unnatural reasons.
grbIzl
on 24 Jun 2019
Leave your node for several hours (till tomorrow), so we'll see how significant is the issue.
@iFA88 how are things looking today?
 dvdplm
on 25 Jun 2019
dvdplm
on 25 Jun 2019
Except the previous peer loss ( https://github.com/paritytech/parity-ethereum/issues/10724#issuecomment-505052717 ) the peers are in 33-35 range, soon for 23 hours. I think we should wait few days with this. Sometimes happens daily 5 times, sometimes one time in week.
iFA88
on 25 Jun 2019
Can confirm, the past 2 days have been running uncharacteristically well compared to previous weeks.
dafky2000
on 25 Jun 2019
In the last days worked well, may we can put solved to this issue.
iFA88
on 27 Jun 2019
Let's not get too excited, I have been running well the last couple days as well and I am still running 2.4.5
dafky2000
on 27 Jun 2019
I run my node with only my full node peer and without the sync parameter, yesterday three times lost the sync and after the last lost they can not recover:
2019-06-30 11:53:24  Syncing #8050063 0xabad…0014     0.00 blk/s    0.0 tx/s    0.0 Mgas/s      0+    0 Qed    #59548    1/25 peers    253 MiB chain  221 MiB db  0 bytes queue    8 MiB
sync  RPC:  0 conn,    0 req/s,    0 µs
2019-06-30 11:53:29  Syncing #8050063 0xabad…0014     0.00 blk/s    0.0 tx/s    0.0 Mgas/s      0+    0 Qed    #23495    1/25 peers    253 MiB chain  221 MiB db  0 bytes queue    8 MiB
sync  RPC:  0 conn,    0 req/s,    0 µs
2019-06-30 11:53:34  Syncing #8050063 0xabad…0014     0.00 blk/s    0.0 tx/s    0.0 Mgas/s      0+    0 Qed    #60962    1/25 peers    253 MiB chain  221 MiB db  0 bytes queue    8 MiB
sync  RPC:  0 conn,    0 req/s,    0 µs
2019-06-30 11:53:39  Syncing #8050063 0xabad…0014     0.00 blk/s    0.0 tx/s    0.0 Mgas/s      0+    0 Qed    #47620    1/25 peers    253 MiB chain  221 MiB db  0 bytes queue    8 MiB
sync  RPC:  0 conn,    0 req/s,    0 µs
2019-06-30 11:53:44  Syncing #8050063 0xabad…0014     0.00 blk/s    0.0 tx/s    0.0 Mgas/s      0+    0 Qed    #63995    1/25 peers    253 MiB chain  221 MiB db  0 bytes queue    8 MiB
sync  RPC:  0 conn,    0 req/s,    0 µs
My full node is working well.
Sadly the commit didn't solve the issue :(
iFA88
on 30 Jun 2019
I run my node with _only_ my full node peer and without the sync parameter, yesterday three times lost the sync and after the last lost they can not recover:
@iFA88 do I understand correctly, that you don't have any logs for it? Also (just for my understanding) why only one node?
Can you try to reproduce it with sync trace enabled?
grbIzl
on 30 Jun 2019
There is the log what I currently have:
https://www.fusionsolutions.io/doc/flog.tar.gz
The first problem happens on 2019-06-29 02:00:30. Because I have only one peer which are full sync in all time, I think the problem that the node hangs, and not the peer dropping. May the block import process hangs and the other peers drops our peer for the failure. If you check my logs you will see the correct problem.
May i should use another debug log parameter too.
iFA88
on 30 Jun 2019
@iFA88 Unfortunately without sync trace enabled it's impossible to say, what went wrong in your case. If we believe, that the problem is easier reproducible for such conf (with only one peer), can you try to run parity with this additional log parameter (-l sync=trace)?
grbIzl
on 30 Jun 2019
Yes, I run again with the trace parameter. If they stops again i will report it.
If you think about it, if you have a fully usable node with the latest data what you need, and the syncing stops, it is high possible that the issue is not due the peer.
iFA88
on 30 Jun 2019
@iFA88 do you have any updates on the issue?
grbIzl
on 3 Jul 2019
Sadly did not happen. I will report when it occurs.
iFA88
on 3 Jul 2019
I got an issue with the sync. My archive node got the blocks but doesn't imports it:
https://www.fusionsolutions.io/doc/syncissue.tar.gz
iFA88
on 4 Jul 2019
I got an issue with the sync. My archive node got the blocks but doesn't imports it:
https://www.fusionsolutions.io/doc/syncissue.tar.gz
Thank you for the logs! Did I understand correctly, that you're speaking about the issue at 2019-07-04 10:57:46.745713, when archive and full nodes had huge diff in last blocks? And this diff went to zero after one minute? (Asking because previously you had the different output for your watcher script).
If my understanding correct, here is my analysis of the provided logs: they are started at 2019-07-04 10:56:22. And immediately the node finds the peer and starts syncing, it takes some time to catch up. I don't know, what was going before 10:56 and don't know the reasons, why it was not connected to the full node (as there are no logs before 10:56), but after the connection is gained, the behaviour of the node is legit - it's syncing blocks. So as a summary: I don't see anything criminal.
grbIzl
on 4 Jul 2019
I have need to cut the log because it was more than 10gb. What actual happened:
- First time the archive node syncs thought my full node.
- My full node crashed https://github.com/paritytech/parity-ethereum/issues/10821#issuecomment-508402080 and i have must to stop the process.
- So my archive node has now 0 peer.
- I started my full node and has began sync.
- Archive node connected to my full node again. In this time the archive node generated about 10GB in 10 min
- On
2019-07-04 10:57:46have restarted my archive node watcher script. - Waited about 10-20 min and have seen that the archive node block number doesn't grow.. but the full node has soon full synced.
If you check the 3GB log you can see that my archive node got blocks from zero. That's very criminal that the node needs check again 8 million block headers. Why? I bet this happens when the node sync stuck.
Think about what happens, when a almost full synced client request ancient blocks from peers with full bandwidth and they floods with the data.
iFA88
on 4 Jul 2019
@iFA88 Thanks for info! Now I see bigger picture. You're right, that this checking of all blocks from scratch after full node's restart looks suspicious, and I will be looking into it. In my message I meant, nothing criminal from the original issue's standpoint, no connectivity loss, no sync loss etc
grbIzl
on 4 Jul 2019
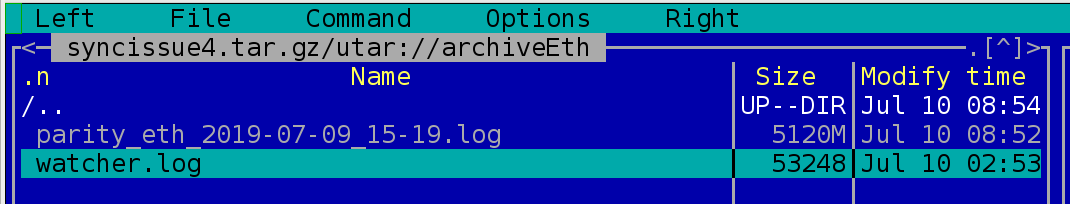
@grbIzl It happened again, but you can have now an uncut log:
https://www.fusionsolutions.io/doc/syncissue.tar.gz
The important logs are around:
2019-07-05 16:22:23 IO Worker #3 TRACE sync Completed subchain 0x92f0499850487872bafb73d0d9118db365b159734dc84d720d7c36896a4bd042
@iFA88 the latest logs were very helpful. After the analysis I've tried to address the issue in it (massive blocks requests). Would you mind helping with testing of the patch? If yes, you can find binary here https://gitlab.parity.io/parity/parity-ethereum/-/jobs/179037/artifacts/download The same requests for the procedure (sync trace target enabled). But please be aware, that it's based on our not stable master branch and if this node runs critical operations for you, don't use and let me know.
grbIzl
on 8 Jul 2019
I'm happy when I can help.
During the testing I'm operating with my full node, and I let archive node for testing. The most important is for me, that the database should be the same. It would be very bad when I got new database parity, upgrades my archive database and then I can not use the stable again.
I will download that file and will use it with sync trace, will report again when the issue occurs.
iFA88
on 8 Jul 2019
It would be very bad when I got new database parity, upgrades my archive database and then I can not use the stable again.
Please make sure you have a back up of your database before trying anything! AFAIK the database format did not change between 2.4 and 2.6.
dvdplm
on 8 Jul 2019
@grbIzl The given parity doesn't sync even when I restart:
https://www.fusionsolutions.io/doc/syncissue3.tar.gz
@dvdplm I can not make backup from a 2.755T database, I don't have enough free space for that. If something get wrong I need to full re-sync. That takes 10-12 days. Its not a big problem, just slow.
iFA88
on 8 Jul 2019
@iFA88 bummer! I will look into the log and try to emulate the issue. Thank you for your help!
grbIzl
on 8 Jul 2019
@grbIzl The given parity doesn't sync even when I restart:
https://www.fusionsolutions.io/doc/syncissue3.tar.gz
@iFA88 Are you sure, that your full node was working properly at this time? I see, that archive node doesn't receive any new blocks after 8111996. Also, if I understand correctly the format of your watcher's script output, it indicates, that the full node also had the latest block 8111996 all the time. If you believe, that the full node is operating properly, can you do me a favor and make a log for 2-3 minutes from both nodes (archive and full) with sync trace target enabled on both? Thanks!
grbIzl
on 9 Jul 2019
@grbIzl My full node has worked fine in that time:
2019-07-08 19:42:43  IO Worker #2 INFO import    42/50 peers    180 MiB chain   14 MiB db  0 bytes queue   62 KiB sync  RPC:  0 conn,  366 req/s,  952 µs
2019-07-08 19:42:45  Verifier #1 INFO import  Imported #8111995 0x4a09…882e (132 txs, 8.01 Mgas, 379 ms, 26.94 KiB)
2019-07-08 19:42:51  Verifier #5 INFO import  Imported #8111996 0x73fc…f16b (100 txs, 7.94 Mgas, 263 ms, 21.41 KiB)
2019-07-08 19:43:04  Verifier #2 INFO reorg  Reorg to #8111997 0xfe14…a13d (0xeba4…bebd #8111995 0x4a09…882e 0x73fc…f16b)
2019-07-08 19:43:04  Verifier #2 INFO import  Imported #8111997 0xfe14…a13d (26 txs, 6.30 Mgas, 417 ms, 12.97 KiB)
2019-07-08 19:43:13  IO Worker #2 INFO import    42/50 peers    214 MiB chain   15 MiB db  0 bytes queue   62 KiB sync  RPC:  0 conn,  299 req/s, 1258 µs
2019-07-08 19:43:43  IO Worker #0 INFO import    43/50 peers    252 MiB chain   15 MiB db  0 bytes queue   62 KiB sync  RPC:  0 conn,   13 req/s, 1146 µs
2019-07-08 19:43:44  Verifier #0 INFO import  Imported #8111998 0x310d…108c (195 txs, 8.01 Mgas, 429 ms, 36.60 KiB)
2019-07-08 19:43:52  Verifier #4 INFO import  Imported #8111999 0x92e0…ab54 (152 txs, 7.13 Mgas, 494 ms, 30.70 KiB)
2019-07-08 19:44:08  Verifier #7 INFO import  Imported #8112000 0xd078…aa33 (71 txs, 3.93 Mgas, 192 ms, 15.95 KiB)
My watcher script doesn't check the full node. It checks every minute that how much block was the diff in the previous request,what is the current block height and how many peers are on the archive node.
Yesterday have put back the previous parity Parity-Ethereum/v2.6.0-nightly-17e5d8c-20190624/x86_64-linux-gnu/rustc1.35.0 and that runs now without issue.
I will try to run again what you have given to test.
iFA88
on 9 Jul 2019
@grbIzl Here is the log from the two node with trace sync + watcher for 2-3 min:
https://www.fusionsolutions.io/doc/betaParityIssue.tar.gz
iFA88
on 9 Jul 2019
@iFA88 thanks for the log! I've prepared the updated patch. My last one was too radical and broke fork logic handling (as a result archive node was hanging on such block). Can you give it a try? https://gitlab.parity.io/parity/parity-ethereum/-/jobs/180062/artifacts/download You need to apply it only for the archive node.
grbIzl
on 9 Jul 2019
Okay, will report when the issue occurs.
iFA88
on 9 Jul 2019
Good morning,
Sadly the commit did not solved the sync issue. Logs:
https://www.fusionsolutions.io/doc/syncissue4.tar.gz
I have given 5GB limit for the logs, thats why that they end missing.
iFA88
on 10 Jul 2019
Good morning,
Sadly the commit did not solved the sync issue. Logs:
https://www.fusionsolutions.io/doc/syncissue4.tar.gz
I have given 5GB limit for the logs, thats why that they end missing.
@iFA88 it seems, that something went wrong during the logging. Inside the archive tons of small files\folders (everyone represents one log message).
grbIzl
on 10 Jul 2019
@grbIzl I dont know what happened, for me the archive is okay:
Please download again and/or try other application.
I have extracted with tar (GNU tar) 1.29 Copyright (C) 2015 Free Software Foundation, Inc. without problem.
iFA88
on 10 Jul 2019
Yep, tried again and it worked. Don't know, that was it :-(
grbIzl
on 10 Jul 2019
After this the client get block headers step by step n-1 from other peers:
2019-07-10 01:36:02  IO Worker #2 TRACE sync  New block with unknown parent (0xda7f8c3bbc392403b6eaf921037d826b4303f7705fcfed3d28b318c35714684f) 0x45733a95e2142b427f52b415759c7630fd0c01a80c0a650909ec31497ebb9e63
2019-07-10 01:36:02  IO Worker #2 TRACE sync  New unknown block 0x45733a95e2142b427f52b415759c7630fd0c01a80c0a650909ec31497ebb9e63
Yep, already looking into this place
grbIzl
on 10 Jul 2019
@iFA88 BTW do you have log from the full node for this timeframe?
grbIzl
on 10 Jul 2019
@grbIzl Yes i have, but without trace sync :/
iFA88
on 10 Jul 2019
@grbIzl Yes i have, but without trace sync :/
That's fine, I'd like to see, how deep was fork
grbIzl
on 10 Jul 2019
iFA88
on 10 Jul 2019
@iFA88 can you please share your config file and (or) startup parameters for your full node?
grbIzl
on 10 Jul 2019
Yes:
--ipc-apis all --tracing on --reserved-peers /own/config/archiveEthNode.txt --no-serve-light --no-periodic-snapshot --jsonrpc-allow-missing-blocks --no-persistent-txqueue --jsonrpc-server-threads 8 --ipc-path=/own/sockets/ethNode.ipc --min-gas-price=10000000 --tx-queue-mem-limit=4096 --tx-queue-size=256000 --reseal-on-txs=all --force-sealing --base-path "/mnt/node-1/eth" --rpcport 8548 --port 30306 --no-ws --no-secretstore --cache-size 4096 --log-file /own/log/nodes/eth/parity_eth_$DATE.log
@iFA88 can you please help with testing of the next patch? This time I'd like to apply the patch to your full node, the binary is here: https://gitlab.parity.io/parity/parity-ethereum/-/jobs/185203/artifacts/download Please keep the previously patched version for the archive node (if possible) and run both nodes with the same trace parameters as before (sync for archive, usual logging for full). In this build (except patch itself) one more log message added, that can spam your full node's log a little bit. I hope, that it's ok for you.
grbIzl
on 16 Jul 2019
So its something went very wrong..
What I have now:
archiveNode => specParity (Parity-Ethereum/v2.7.0-nightly-b82b0ad-20190709/x86_64-linux-gnu/rustc1.36.0)
fullNode => specialFullParity (Parity-Ethereum/v2.7.0-nightly-5277eb3-20190716/x86_64-linux-gnu/rustc1.36.0)
Logs:
https://www.fusionsolutions.io/doc/speclog.tar.gz
Result:
The fullNode works with few new log output. The archive node runs for few mins and quits, I have tried restart again and again, but nothing helps.
iFA88
on 17 Jul 2019
@iFA88 Thank again! Your help is invaluable! Is it possible to launch a short log session with both nodes patched and sync trace enabled on both as well? Just run them both and wait 1-2 mins
grbIzl
on 17 Jul 2019
iFA88
on 17 Jul 2019
@iFA88 you're saying, that archive node quits? Can you please explain in more details? Does it panic? How does it look like? From the logs it seems, that the node was simply shut down after several seconds :-(
grbIzl
on 17 Jul 2019
iFA88
on 17 Jul 2019
I will try recover my parity database. May that was for that I can only shut down the parity with SIGKILL..
UPDATE:
I need resync from scratch, it will take about 10 days when sync issue doesn't appears.
iFA88
on 17 Jul 2019
I need resync from scratch, it will take about 10 days when sync issue doesn't appears.
:-( I would also recommend check your disk and memory, in order to make sure, that it was not the reason for the corruption (fsck and memtest).
grbIzl
on 17 Jul 2019
Still syncing.. It is on #5805037 block now.. At least going without issue :)
iFA88
on 2 Aug 2019
Hey @iFA88 ! Has the sync completed?
grbIzl
on 13 Aug 2019
@grbIzl Still syncing.. best block is 6743002 now.
iFA88
on 13 Aug 2019
Good that the node has cached many blocks, because the archive node drops lot of times my full node. I database is now 1.7T, so about 15% missing from the full size.. about 6-10 days.
iFA88
on 13 Aug 2019
hey @APshenkin , i am facing the exact same problem with parity.
I noticed you have a nice graph of cache usage , would you mind sharing what tools did you use for this graph. Thanks!
 mnaboka
on 20 Aug 2019
mnaboka
on 20 Aug 2019
I got critical error which i can not handle during syncing.
2019-08-24 16:50:16 Block import failed for #7418712 (0xd32f…fab9): Parent not found (0xeef9…5f22)
I have put all log to the archive file and i have also put the rocksdb LOG file:
https://www.fusionsolutions.io/doc/archiveEth.tar.gz
Update:
The database has anyhow corrupted. Now they try to repair it. Disks and ram are okay.
Update 2:
There is no chance to repair the database, i need sync from the beginning.. Tried several times, but got only this:
2019-08-24 20:11:05  DB has been previously marked as corrupted, attempting repair
2019-08-24 23:47:35  DB corrupted: Invalid argument: You have to open all column families. Column families not opened: col6, col5, col1, col0, col3, col4, col2, attempting repair
I got critical error which i can not handle during syncing.
2019-08-24 16:50:16 Block import failed for #7418712 (0xd32f…fab9): Parent not found (0xeef9…5f22)
I have put all log to the archive file and i have also put the rocksdb LOG file:
https://www.fusionsolutions.io/doc/archiveEth.tar.gz
It's very sad to hear :-( It seems, that you bumped the bug in rocksDB implementation https://github.com/facebook/rocksdb/issues/3509 We see its sometimes, but still not able to address. I'm thinking, what I can do in order to help with resolution, but frankly there are not so many options available now (and all of them are not quick)
grbIzl
on 26 Aug 2019
Greetings! My archive node still syncing, but now the same issue has happened on my full node:
https://www.fusionsolutions.io/doc/ethlog.tar.gz
The issue has started on 2019-09-14 00:12:22 The node has dropped all peers and then probably they had requested ancient blocks from the new peers..
This is the first time that this happened with my full node.
Parity-Ethereum/v2.5.7-stable-6bd7db9-20190829/x86_64-linux-gnu/rustc1.36.0
iFA88
on 14 Sep 2019
The issue has started on
2019-09-14 00:12:22The node has dropped all peers and then probably they had requested ancient blocks from the new peers..
Yes, I see this stuck in logs, but I cannot say, what caused it without corresponding log targets enabled. I suggest for the sake of simplicity to track this problem with the full node separately and create another issue, if it repeats.
grbIzl
on 16 Sep 2019
Sadly it is very hard to reproduce with the full node. I think the problem is the same for both, If my archive node finish with the sync then i can apply trace outputs. I need at least 30 days for that.. :(
iFA88
on 16 Sep 2019
My archive node has finished syncing (Parity-Ethereum/v2.5.9-stable-06c7096-20190926/x86_64-linux-gnu/rustc1.36.0) After 20 min after the sync was done the issue has arrived. We can now talk about how we can debug this bug.
iFA88
on 23 Oct 2019
My archive node has finished syncing (
Parity-Ethereum/v2.5.9-stable-06c7096-20190926/x86_64-linux-gnu/rustc1.36.0) After 20 min after the sync was done the issue has arrived. We can now talk about how we can debug this bug.
Ok. For the start, can you please confirm, which exact versions run on your both nodes (full and archive)? Some time ago I made patches for both of them, did you apply these patches? If not, please don't for now. I'll try to figure out first, if it's possible to help you with backup.
grbIzl
on 23 Oct 2019
I run Parity-Ethereum/v2.5.9-stable-06c7096-20190926/x86_64-linux-gnu/rustc1.36.0 for all nodes. I can backup my full node, but I can not do any backup for my archive node because it is 3.2t. Yes I can apply patched clients and run it.
iFA88
on 23 Oct 2019
@iFA88 would it be ok for you to use our backup (made and backuped on Parity archive node)? We use 2.5.8 there, but the diff doesn't affect the db
grbIzl
on 24 Oct 2019
When i understand correctly, you want download my archive node db and use it in your local?
iFA88
on 24 Oct 2019
Actually vice versa. If anything happens on your archive node, you may download backup from us and apply it on your node.
grbIzl
on 24 Oct 2019
Alright, please, let we talk on gitter.
iFA88
on 24 Oct 2019
Related issues
 bryaan
·
3Comments
bryaan
·
3Comments
 famfamfam
·
3Comments
famfamfam
·
3Comments
 jordipainan
·
3Comments
jordipainan
·
3Comments
 danfinlay
·
3Comments
danfinlay
·
3Comments
 0x7CFE
·
3Comments
0x7CFE
·
3Comments