Parcel: Variables and functions are not accessible in browser dev console?
❔ Question
After bundle (both dev-server and prod build), variables and functions are not accessible in chrome console. Analyzing the code, the script and it's dependencies are all processed into one single big function. This might be the reason why I can't access a variable e.g. myString in the chrome developer tool console.
🔦 Context
I'm used to use both, the console.log() method and the browser built in console to debug my code and get latest values of functions / variables. This is one of the easiest and fastest ways imho.
💻 Code Sample
E.g. my main.js file
import "../styles/sass/main.scss";
import is from "is_js";

const myString = "Hello World";
Then i bundle it and launch the dev server using "parcel index.html"
And when i type in the chrome dev console "myString" i get an error saying:
Uncaught ReferenceError: sections is not defined at :1:1
🌍 Your Environment
| Software | Version(s) |
| ---------------- | ---------- |
| Parcel |1.9.7|
| Node |v8.11.2|
| npm/Yarn |5.6.0|
| Operating System |Windows 10 Pro|
 advename
All 5 comments
Definitely caused by the fact that parcel "bundles" and the variables are not known to the document scope, but the scope of the particular bundle. 😉
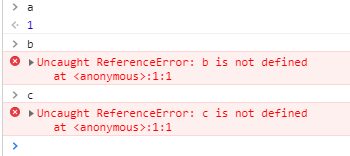
Same behaviour as if you use a closure or event for a 'document-ready' eg:
const a = 1;

(function() {
    const b = 2;
}());

document.addEventListener("DOMContentLoaded", function() {
    const c = 3;
});
The two ways to archive the result you probably want to hear is by using inline scripts from the HTML document, but this far from a practical solution. And making everything you need for development a global.
<script>
   const a = 3;
</script>
Also i would advice to not do that, instead utilise breakpoints from within your editor it will bring you to the right scope in the devtools, and you're also able to skip all that console.log() and console.dir() wrapping 😜
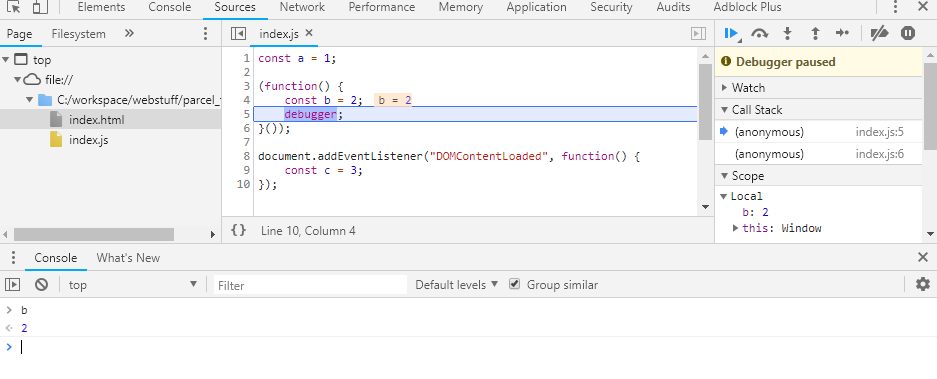
If you don't want to set up your editor you can still use the debugger; keyword to set a breakpoint in code. Chrome will halt on the specific line of code for you and the console will be scope aware.
 Hammster
on 20 Oct 2018
Hammster
on 20 Oct 2018
I've stumbled into this today and this is very disheartening. Plz fix ASAP.
 avalanche1
on 9 Sep 2019
avalanche1
on 9 Sep 2019
This is working as designed, according to the ES Module and Common JS specs. With modules, variables are scoped to the file they are in and are not global.
 devongovett
on 9 Sep 2019
devongovett
on 9 Sep 2019
Um, Devon, I appreciate all the work you do on Parcel - but shouldn't there be a method to debug bundled code?
For example, I am currently developping an extenstion for Chrome. The UI is React app built by Parcel. I import the whole bundle (src.abc.js) into extension's index.html.
I would very much like to be able to debug bundled code on extension's runtime.
plz?
avalanche1
on 10 Sep 2019
The browsers debugger should work if you make a breakpoint. And if you must make a global, you can assign to the window object.
devongovett
on 10 Sep 2019
Related issues
 urbanhop
·
3Comments
urbanhop
·
3Comments
 466023746
·
3Comments
466023746
·
3Comments
 dsky1990
·
3Comments
dsky1990
·
3Comments
 termhn
·
3Comments
termhn
·
3Comments
 jsftw86
·
3Comments
jsftw86
·
3Comments