Panel: Mobile responsiveness is broken between lg and md sized screen sizes.
DO NOT REPORT ISSUES CONFIGURING: SSL, PHP, APACHE, NGINX, YOUR MACHINE, SSH, SFTP, ETC. ON THIS GITHUB TRACKER.
For assistance installating this software, as well as debugging issues with dependencies, please use our discord server: https://discord.gg/pterodactyl
You MUST complete all of the below information when reporting a bug, failure to do so will result in closure of your issue. PLEASE stop spamming our tracker with "bugs" that are not related to this project.
STOP: READ FIRST, AND THEN DELETE THE ABOVE LINES
Background (please complete the following information):
- Panel or Daemon: Panel
- Version of Panel/Daemon: 1.0.0-rc6
- Server's OS: Ubuntu 18.04
- Your Computer's OS & Browser: Chrome 85.0.4183.102
Describe the bug
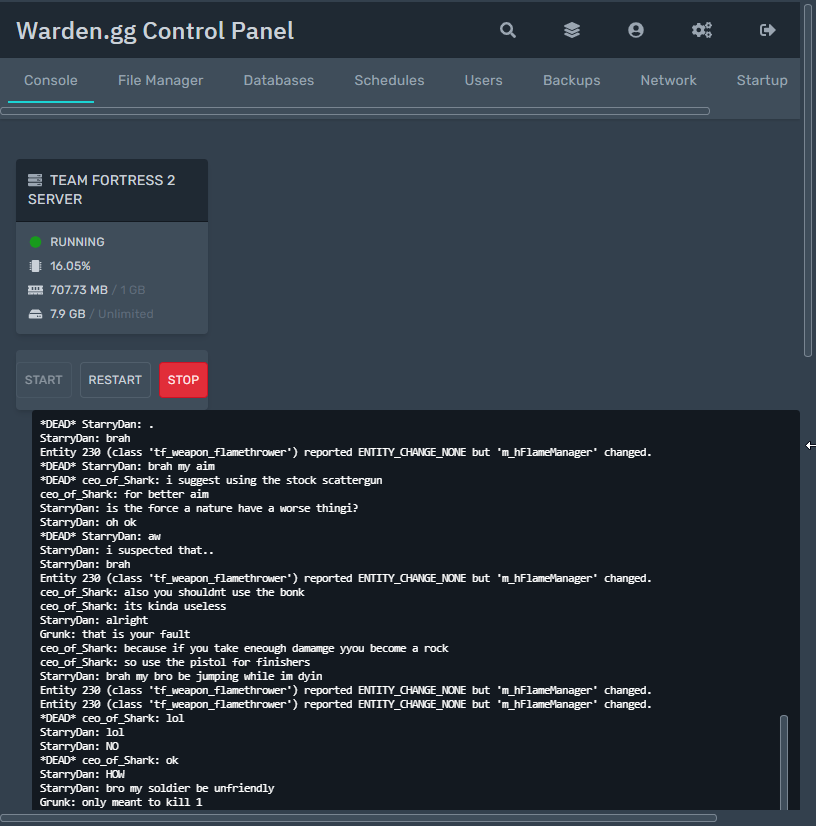
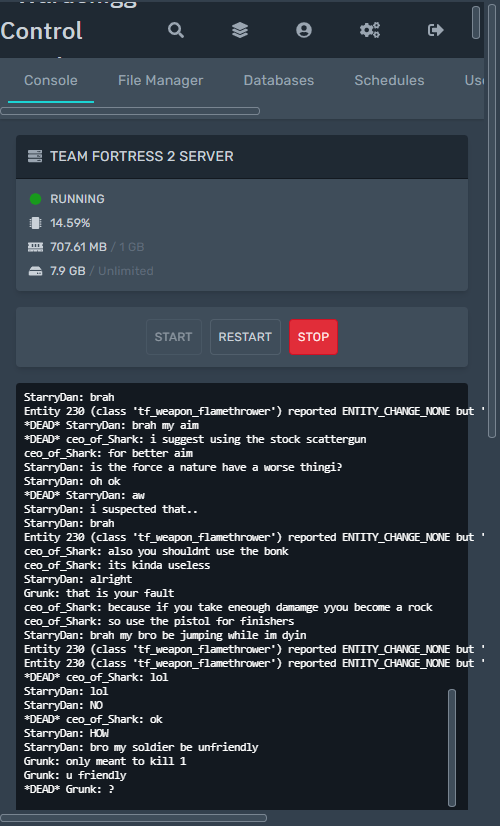
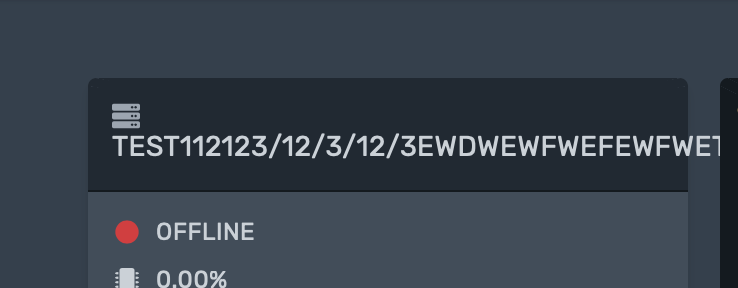
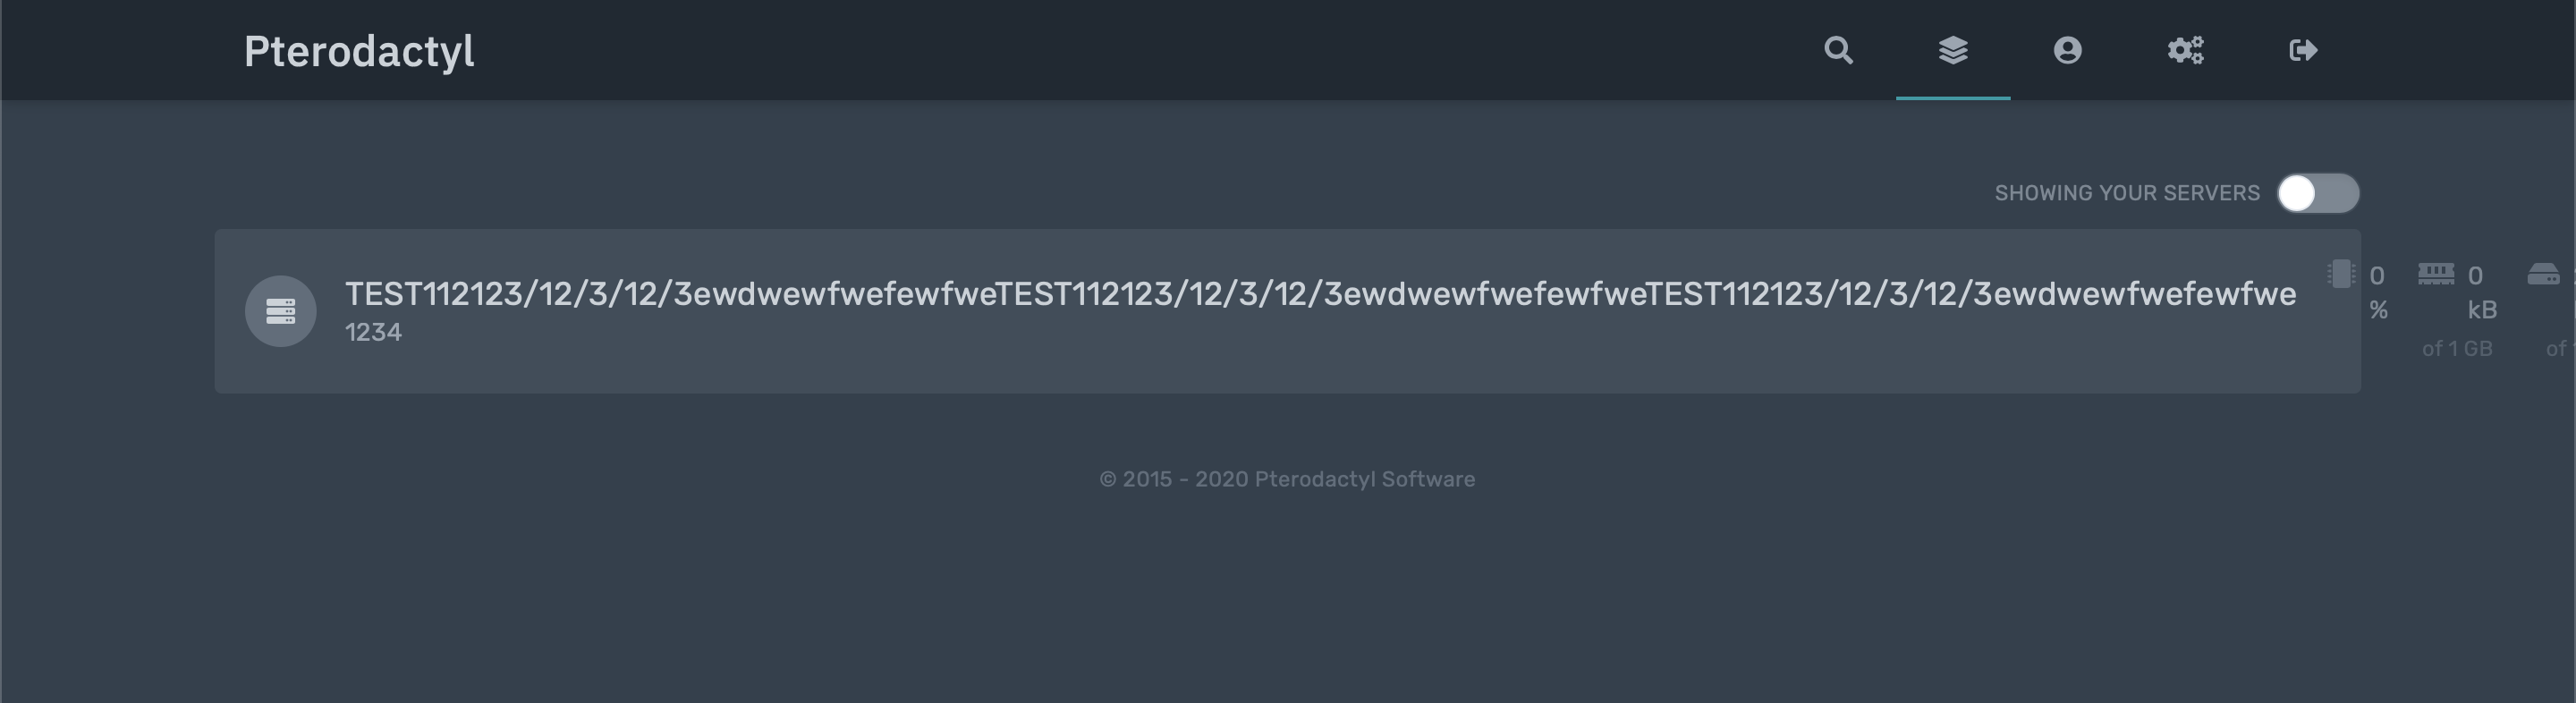
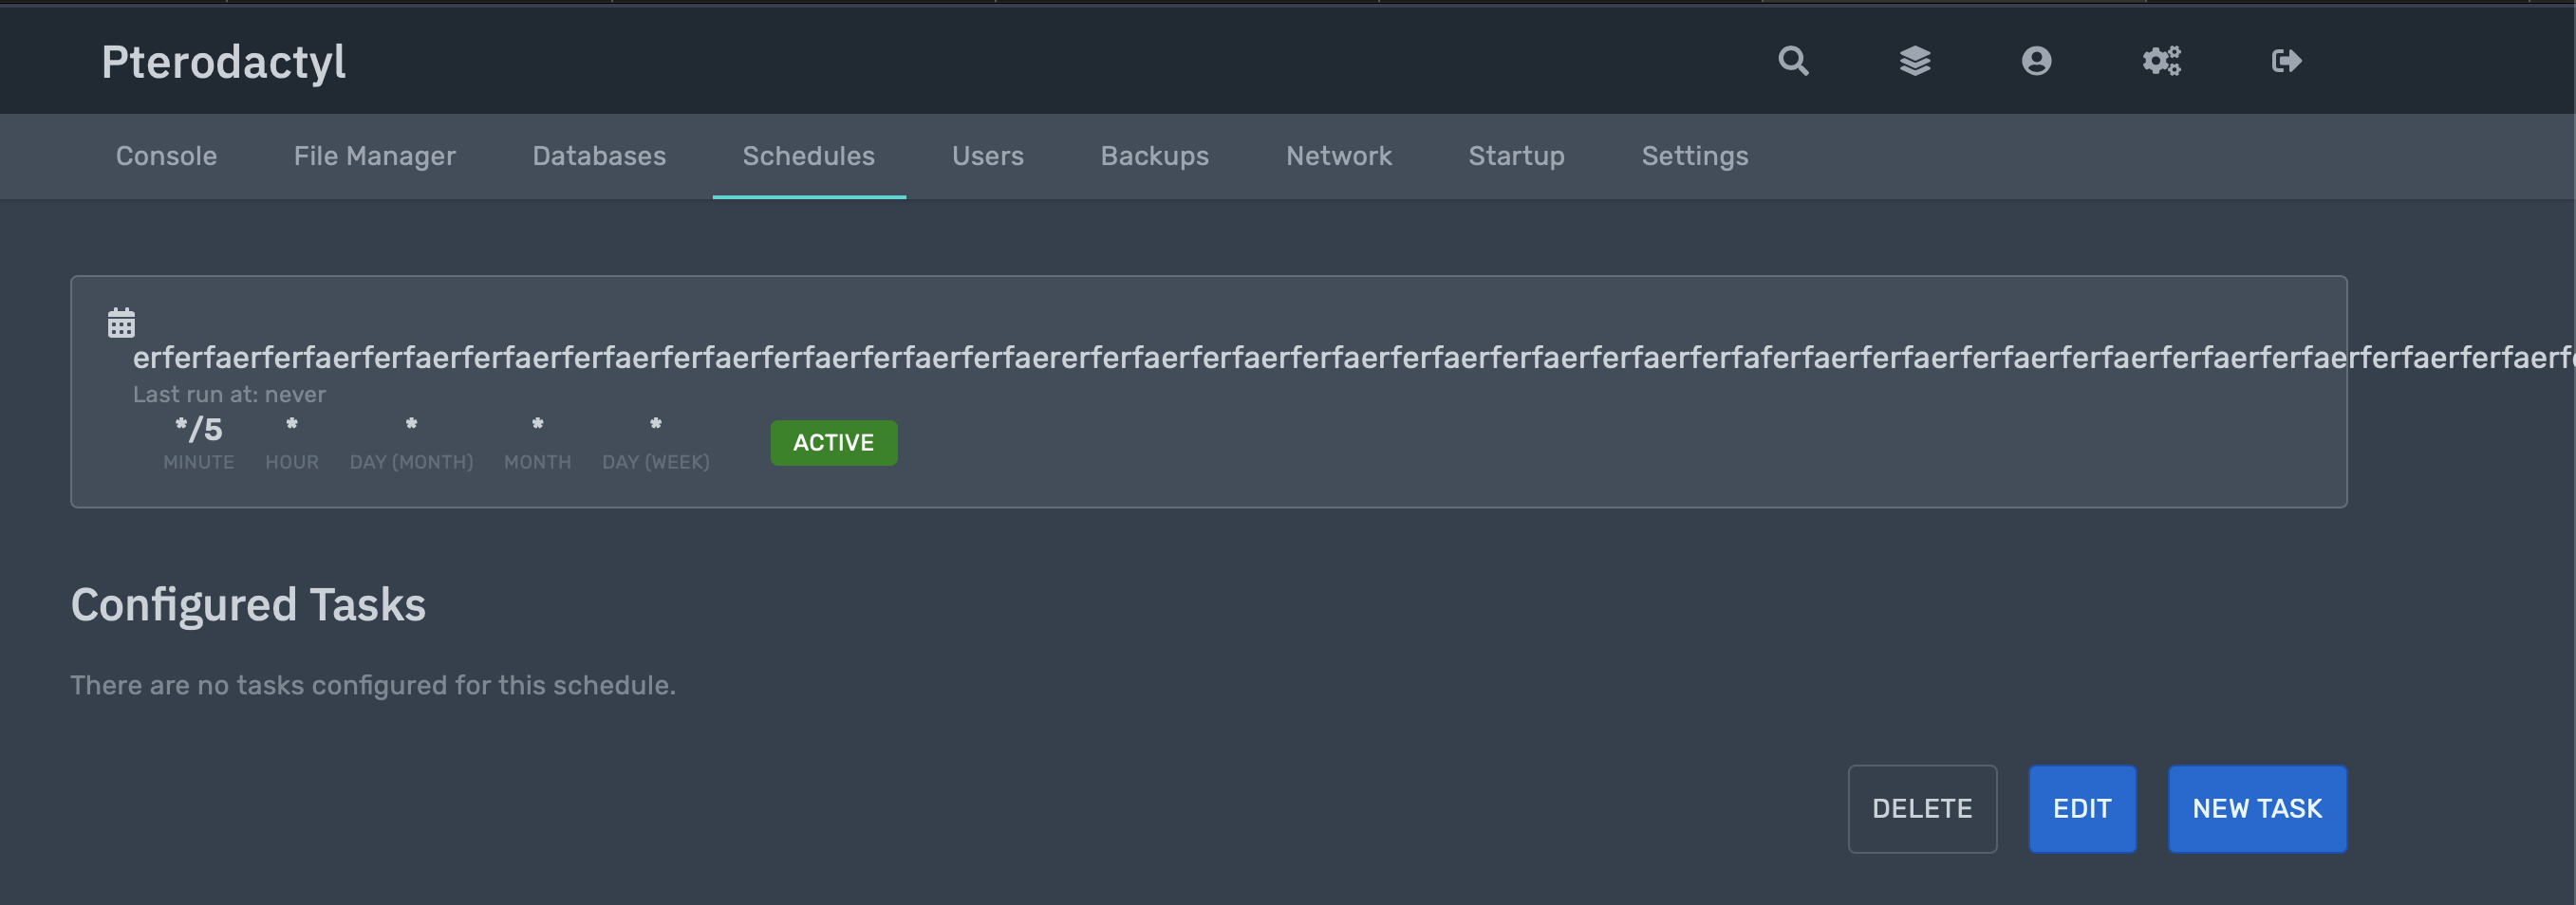
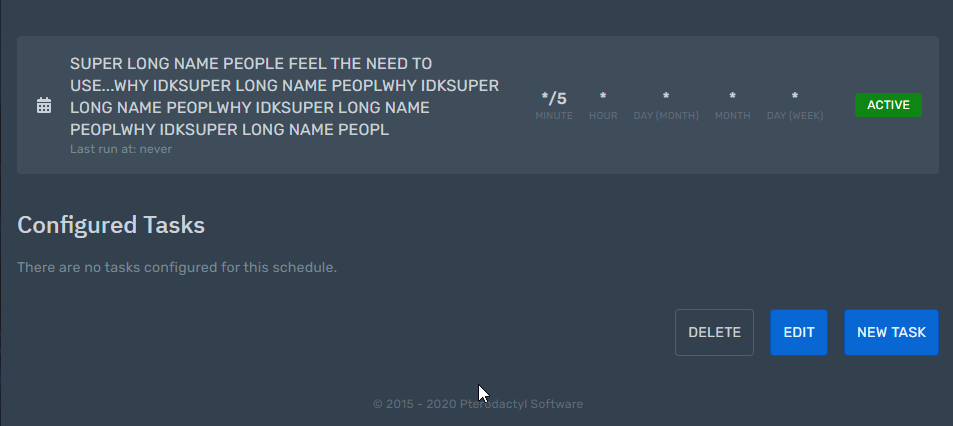
- Text isn't being shrunk to the proper screen size / it's causing an overflow with large titles.
- Text is overflowing on the console.
- Breakpoints aren't wrapping correctly.
To Reproduce
Shrink the panel to the certain sizes.
Expected behavior
Proper flow of mobile responsiveness.
 gabefraser
All 6 comments
/cc @LeCodeCo
 DaneEveritt
on 18 Sep 2020
DaneEveritt
on 18 Sep 2020
 zKoz210
on 20 Sep 2020
zKoz210
on 20 Sep 2020
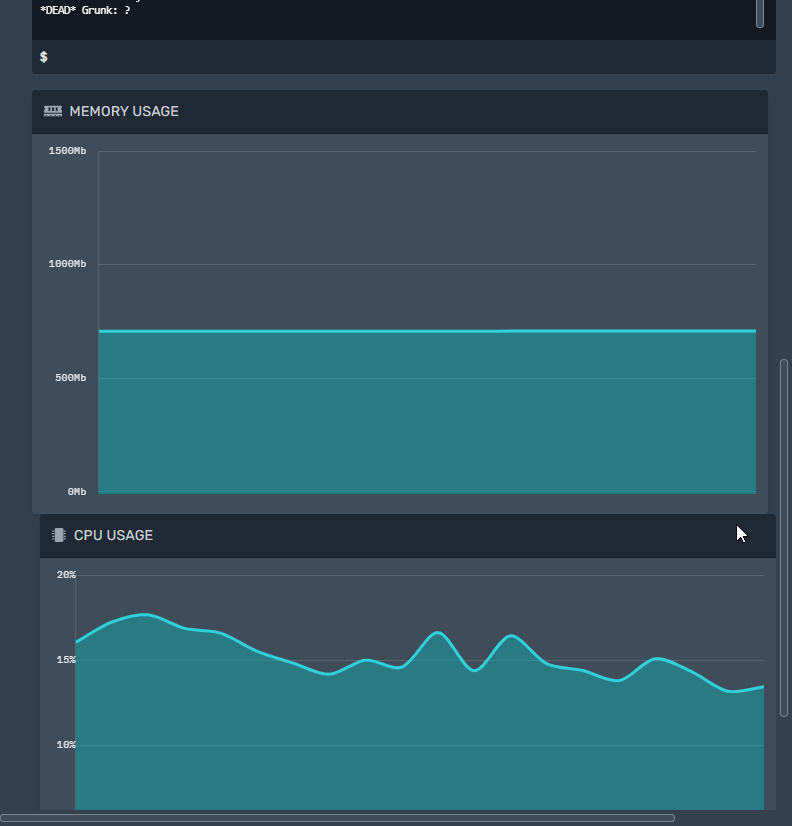
So me and @AreYouRlyScared were testing it out and we located the issue. It seems to only exist on Chrome and it's caused by the graphs when the server is running. The moment the server stops and the graphs disappear, everything works again.
We need to identify why the graphs stay really big.
 LeCodeCo
on 20 Sep 2020
LeCodeCo
on 20 Sep 2020
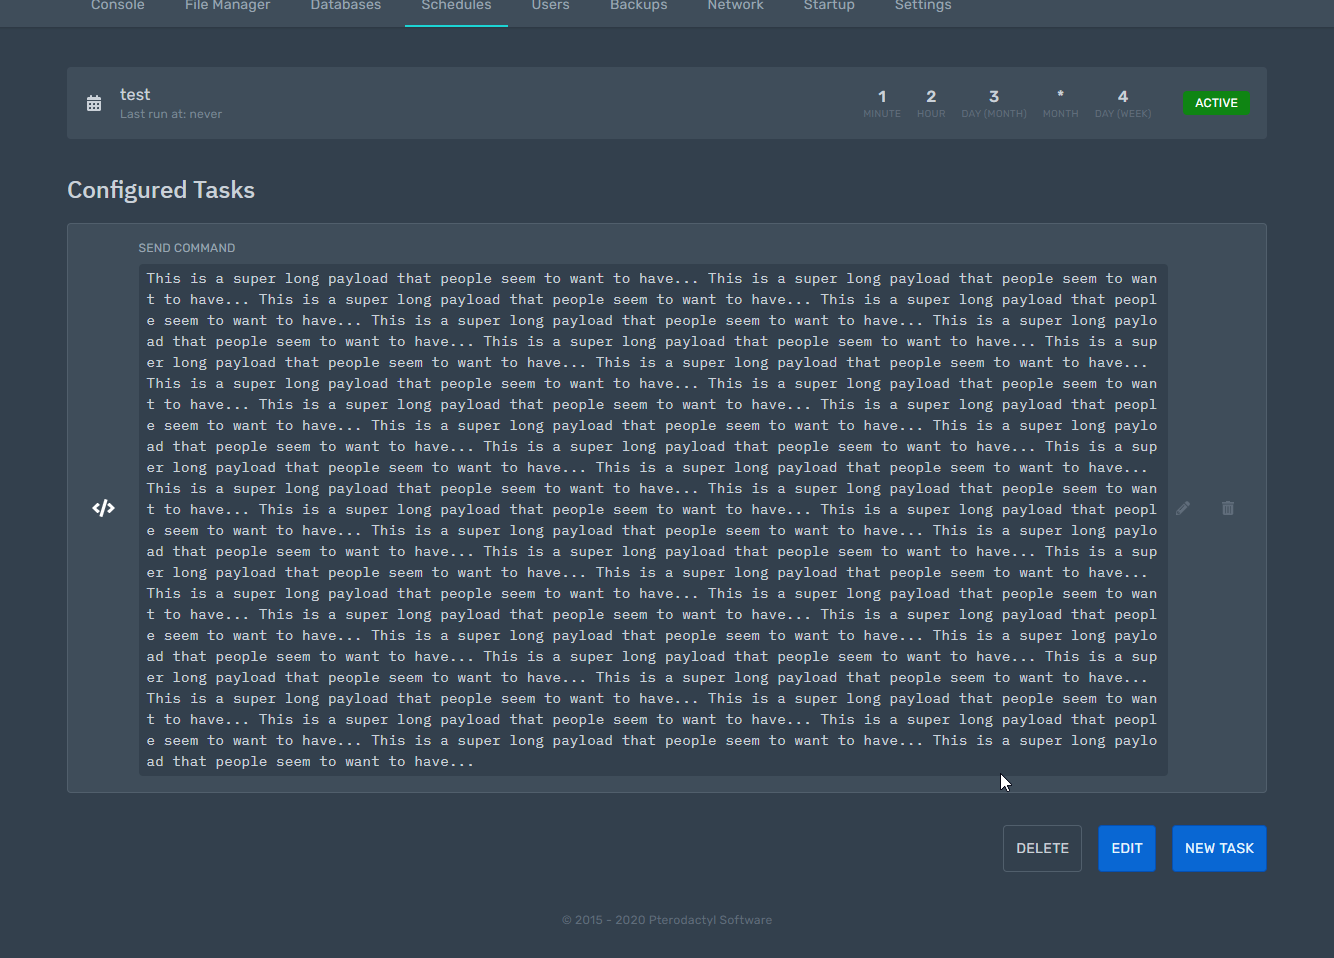
@zKoz210 The payload text was fixed to display as.
As for the title that is already fixed as well
The others will be fixed in a pr in the coming hour.
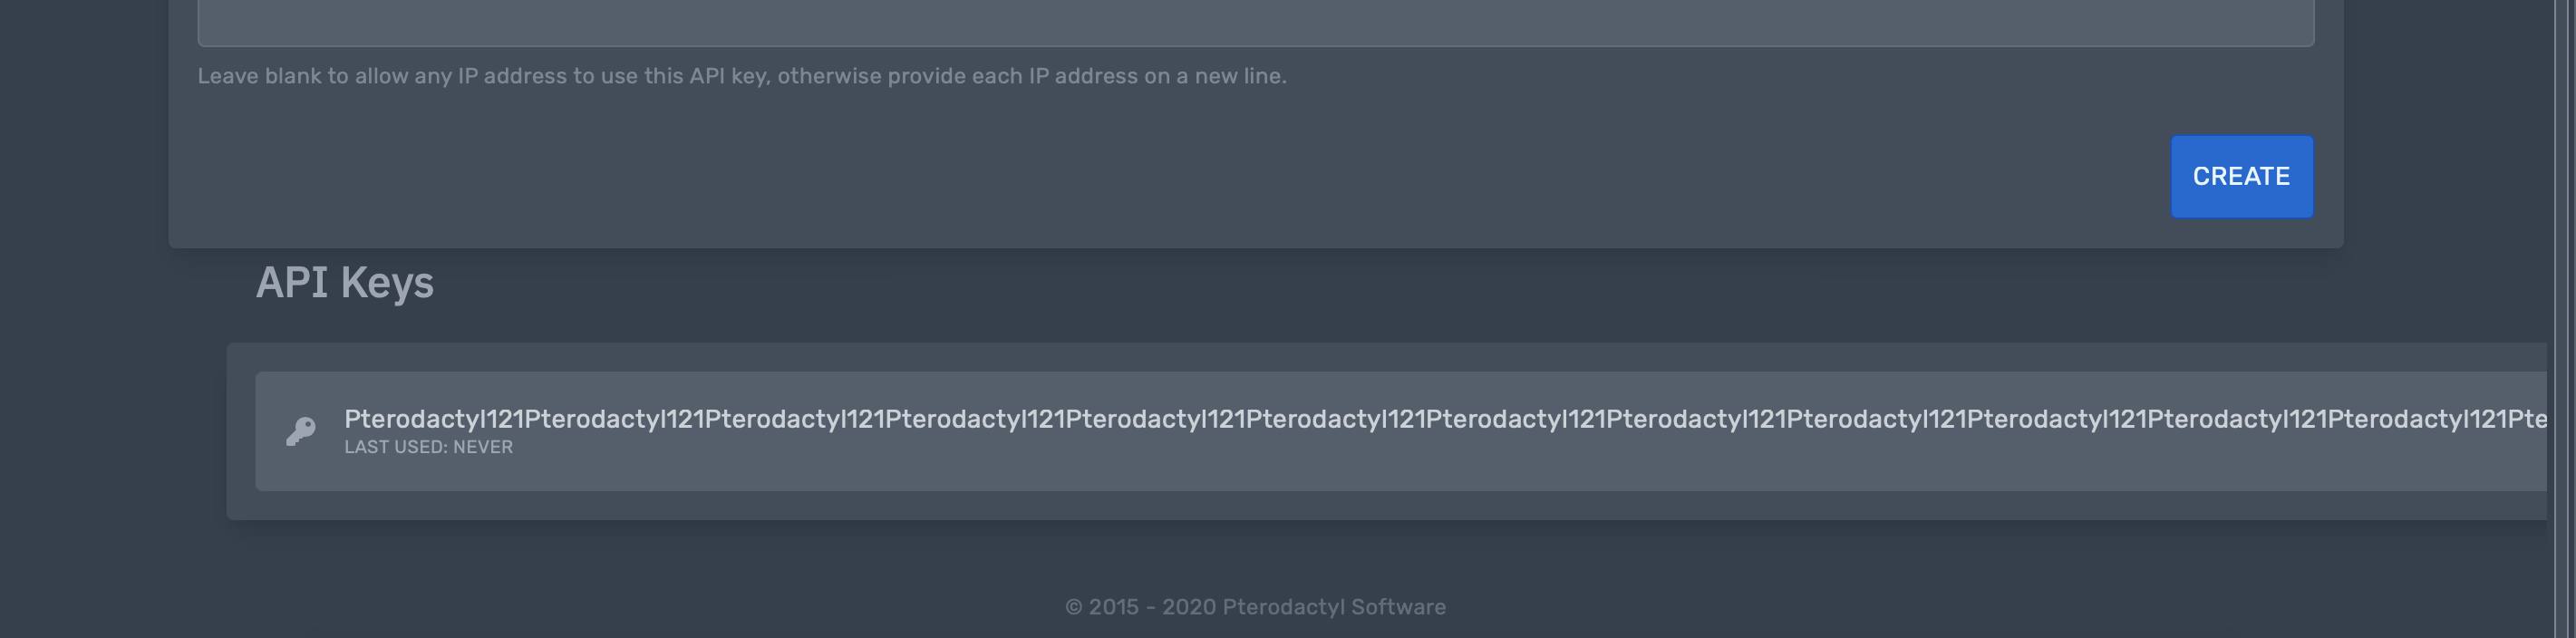
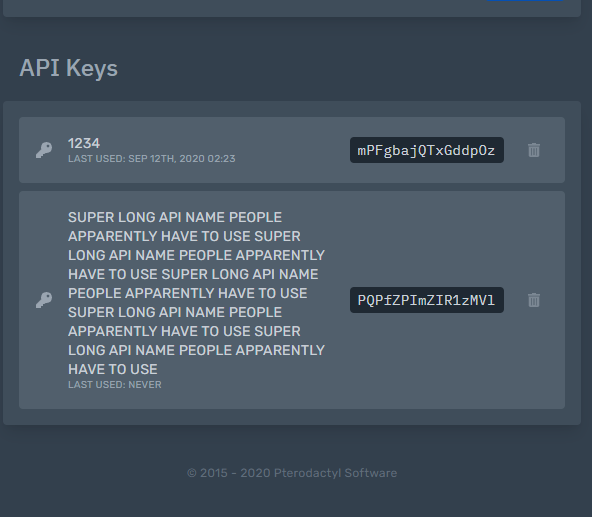
As for the API Keys one... it works properly for me?
 AreYouRlyScared
on 21 Sep 2020
AreYouRlyScared
on 21 Sep 2020
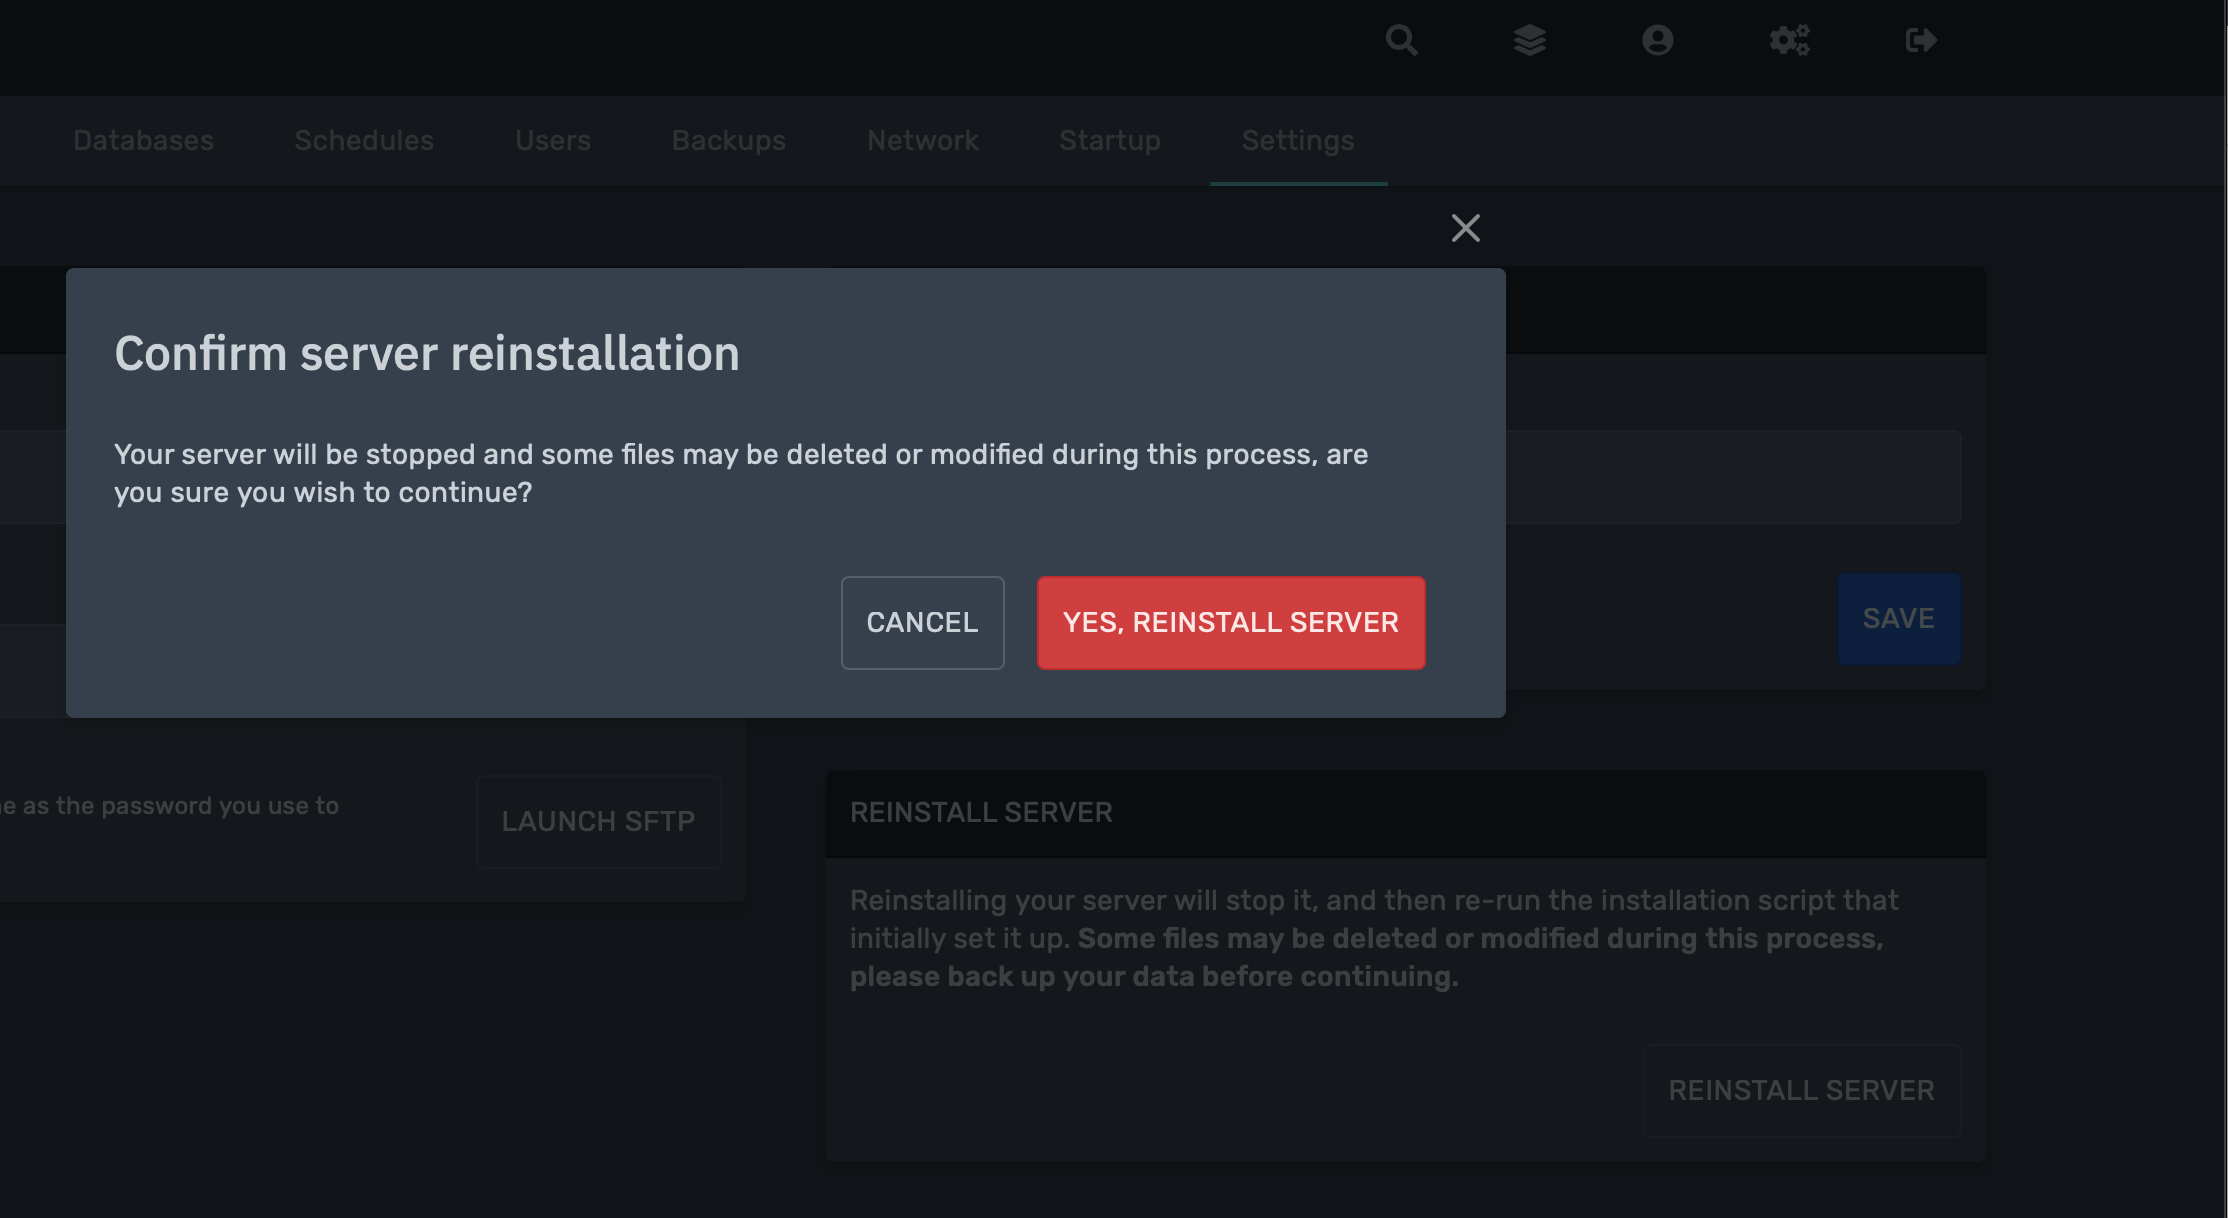
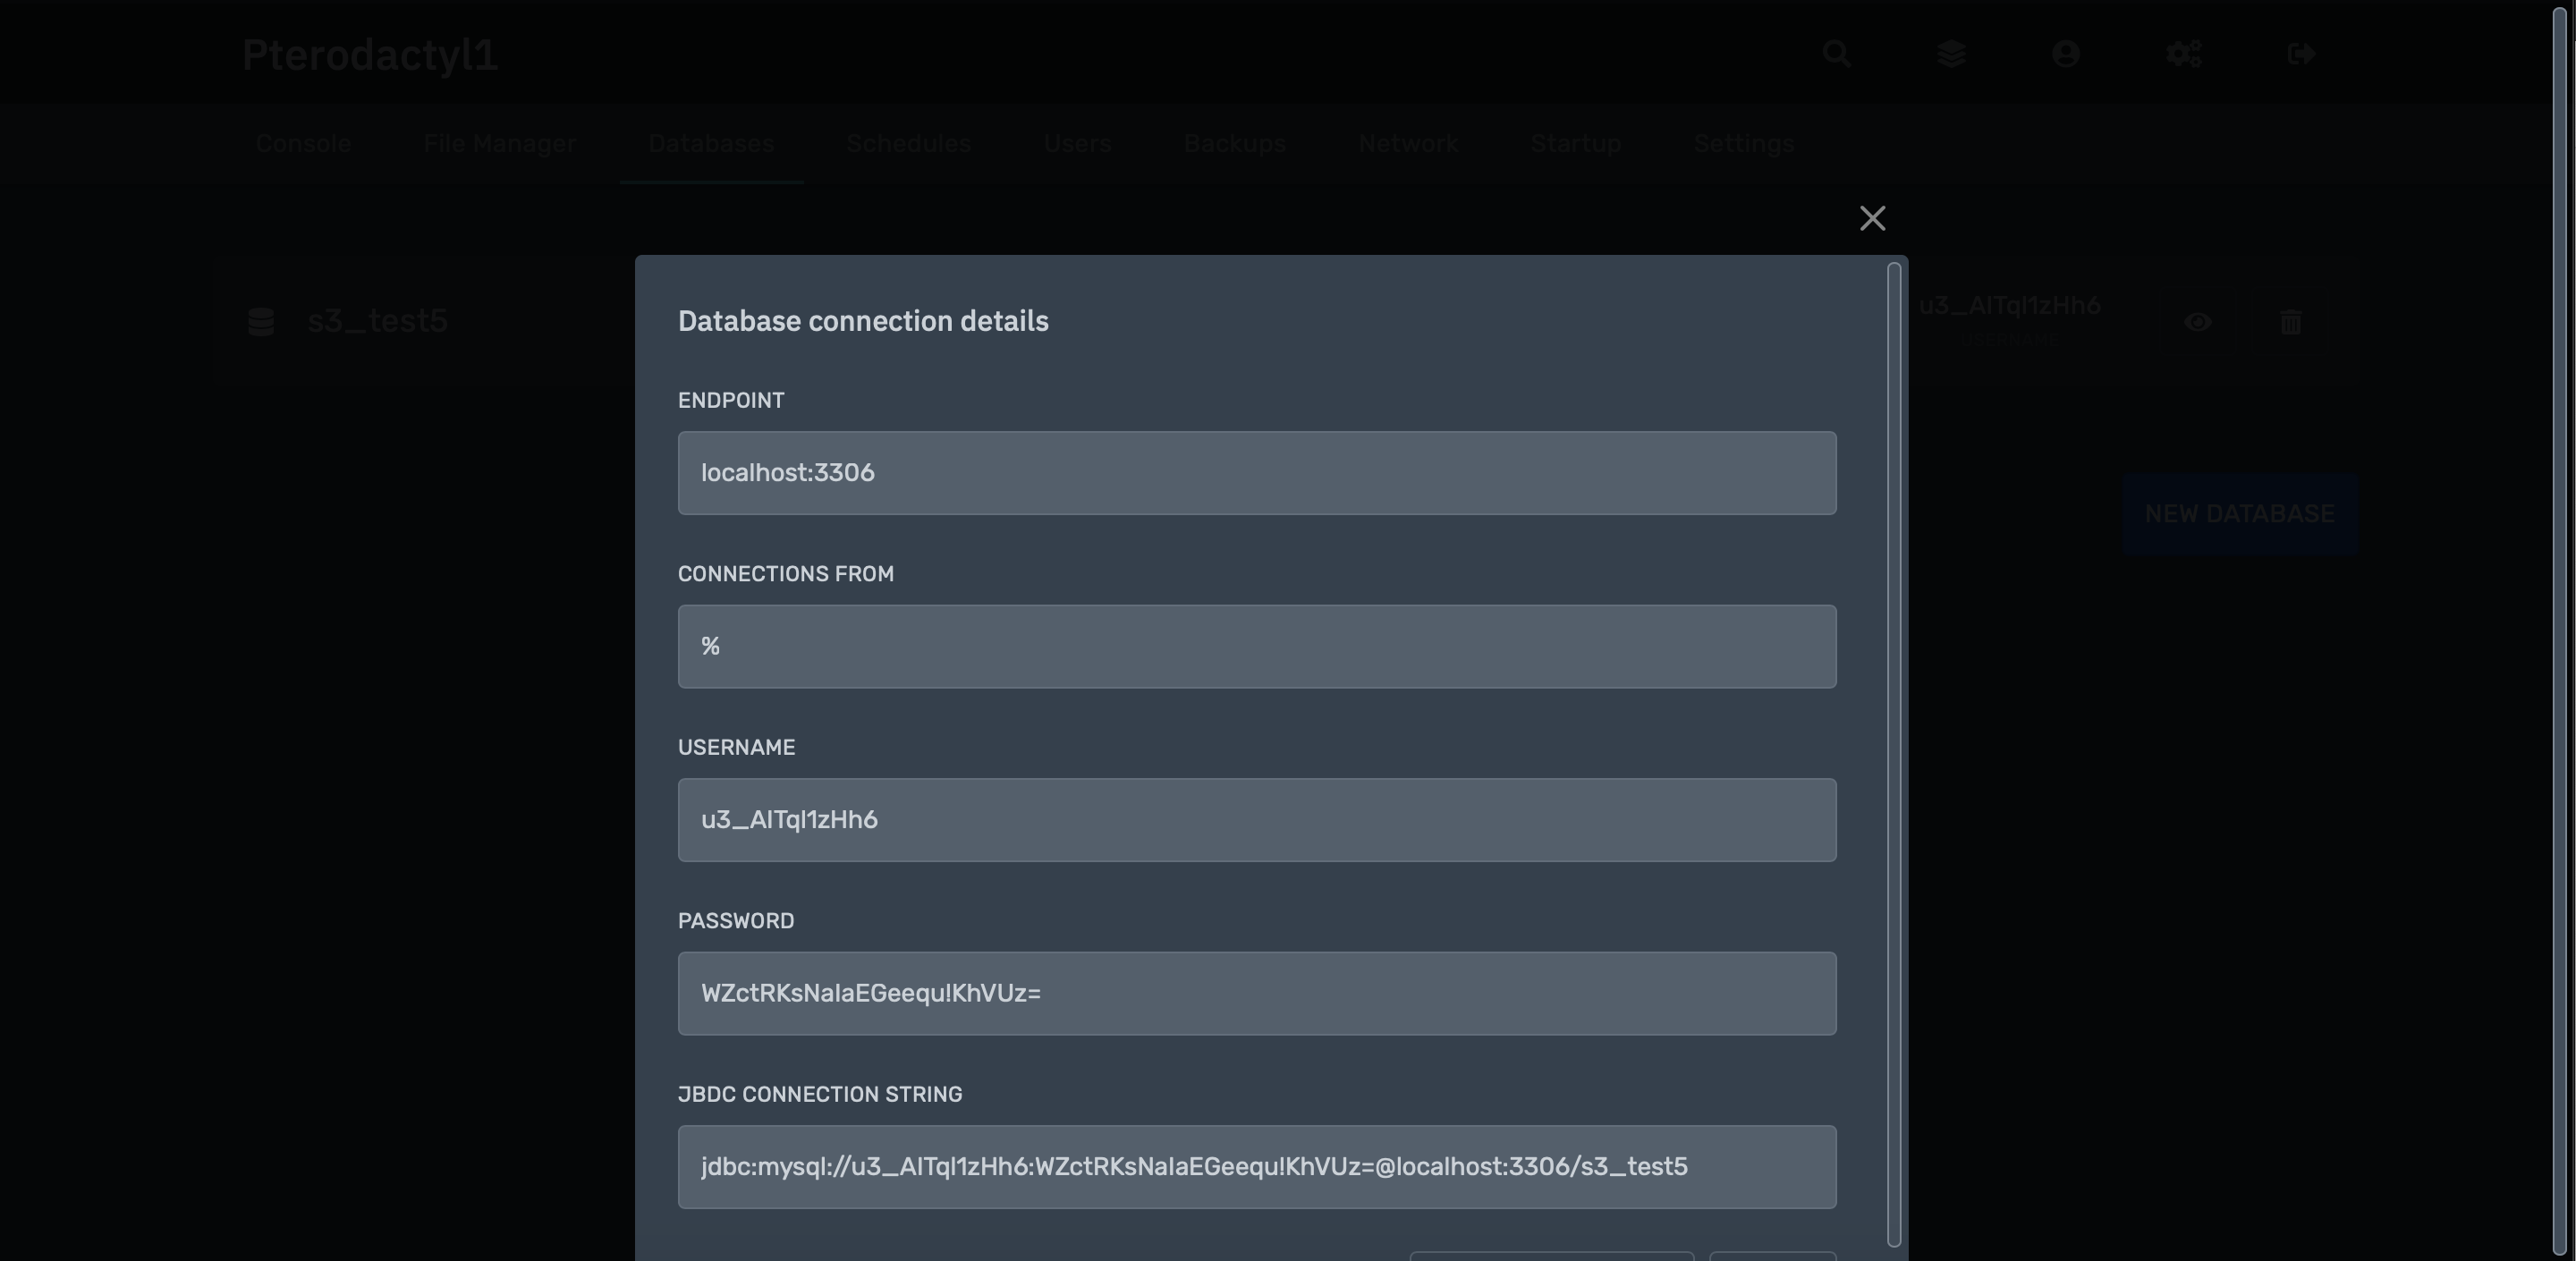
Modal window in the database view is not the same as everywhere else (background)
It would be cool if it was in the middle, instead of going to the bottom
zKoz210
on 21 Sep 2020
I mean it does go to the "middle" just the screen is too small to display all the information.
AreYouRlyScared
on 25 Sep 2020
Related issues
zKoz210
·
4Comments
 schrej
·
3Comments
schrej
·
3Comments
 parkervcp
·
3Comments
parkervcp
·
3Comments
 x390
·
4Comments
x390
·
4Comments
 CoolJWB
·
4Comments
CoolJWB
·
4Comments
Most helpful comment
@zKoz210 The payload text was fixed to display as.

As for the title that is already fixed as well

The others will be fixed in a pr in the coming hour.
As for the API Keys one... it works properly for me?
