Panel: Unable to redraw matplotlib plot when using interact
Unlike ipywidgets, the following minimally reproducible example does not appear to be working for me in the Jupyter notebook or Jupyter lab environment.
import matplotlib.pyplot as plt
import numpy as np

import panel as pn

from panel.interact import interact, interactive, fixed, interact_manual
from panel import widgets

pn.extension()

# from ipywidgets import interact

%load_ext autoreload
%autoreload 2
%matplotlib inline
%config InlineBackend.figure_format = 'retina'

def plot(minimum, maximum):
    x = np.arange(minimum, maximum)
    plt.plot(x, 3*x)


interact(plot, minimum=0, maximum=10)
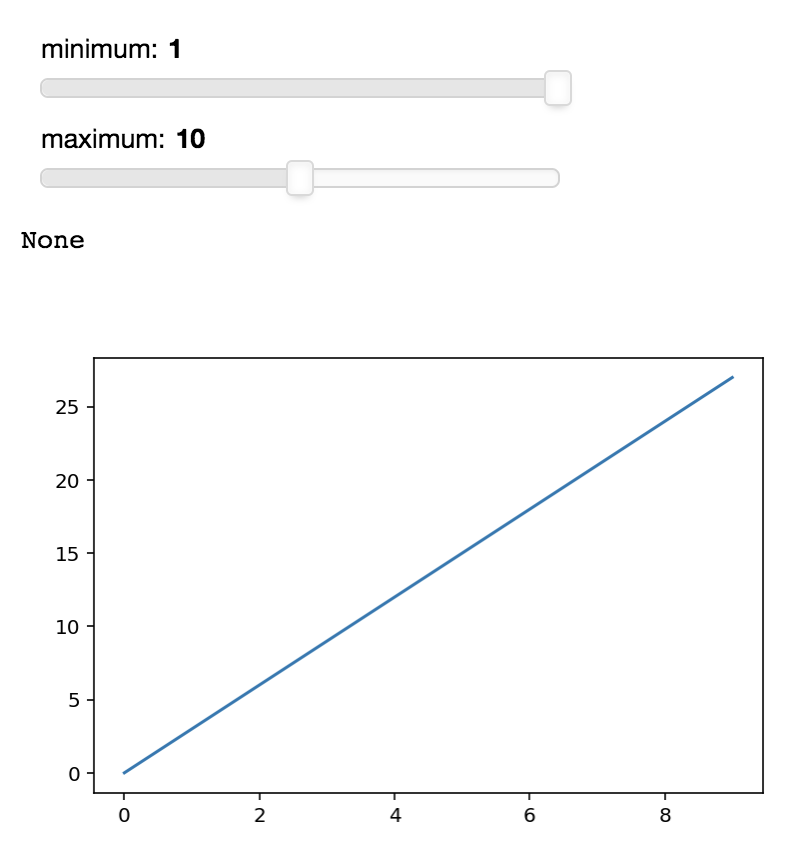
The widgets display, the plot also displays on load, but scrubbing through the ranges does not update the plot.
Screenshot showing that the plot renders is below:
Given the similarity to the ipywidgets API, I was expecting this minimal example to work straight out of the box. I think I might be missing something conceptually here, but I am not quite sure. Would you be kind enough to enlighten me?
 ericmjl
All 6 comments
Sure. Panel's interact function works with the return value of the given callback, which means that you have to ensure that whatever you want displayed is returned as the value, not displayed using whatever strange side effect %matplotlib inline uses to make the plot appear. I'm in no way an expert or even a casual Matplotlib user, so there is probably a much simpler way to get a proper Matplotlib figure out of a pyplot plotting call, but this should work:
import matplotlib.pyplot as plt
import numpy as np
import panel as pn
pn.extension()

def plot(minimum, maximum):
    x = np.arange(minimum, maximum)
    plot = plt.figure()
    plot.add_subplot(111).plot(x,3*x)
    plt.close(plot)
    return plot

pn.interact(plot, minimum=0, maximum=10)
 jbednar
on 16 Nov 2018
jbednar
on 16 Nov 2018
I think you can get the current figure with plt.gcf()
 philippjfr
on 16 Nov 2018
philippjfr
on 16 Nov 2018
@jbednar I see! Thank you for the pointers. That makes sense, thank you for correcting my misconception!
ericmjl
on 16 Nov 2018
Thanks, @philippjfr. That makes the answer much simpler:
import matplotlib.pyplot as plt
import numpy as np
import panel as pn
pn.extension()

def plot(minimum, maximum):
    x = np.arange(minimum, maximum)
    plt.plot(x,3*x)
    return plt.gcf()

pn.interact(plot, minimum=0, maximum=10)
I.e., add return plt.gcf() to the original code to return the current figure.
jbednar
on 16 Nov 2018
I did consider trying to replicate ipywidgets interact's behavior by looking for newly created matplotlib figures, but decided against it at the time.
philippjfr
on 16 Nov 2018
That would require spooky action at a distance, so I vote against it. I've added this question to the FAQ in https://github.com/pyviz/panel/pull/161. Thanks @ericmjl for bringing up the issue!
jbednar
on 16 Nov 2018
Related issues
 MarcSkovMadsen
·
3Comments
MarcSkovMadsen
·
4Comments
MarcSkovMadsen
·
3Comments
MarcSkovMadsen
·
4Comments
 zassa
·
4Comments
MarcSkovMadsen
·
3Comments
zassa
·
4Comments
MarcSkovMadsen
·
3Comments
 henriqueribeiro
·
3Comments
henriqueribeiro
·
3Comments